Deck 7: Pure Competition
Full screen (f)
Question
Question
Given the table below, what is the short-run profit-maximizing level of output for the firm? 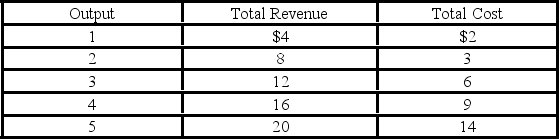
A) 2 units
B) 3 units
C) 4 units
D) 5 units
A) 2 units
B) 3 units
C) 4 units
D) 5 units
Question
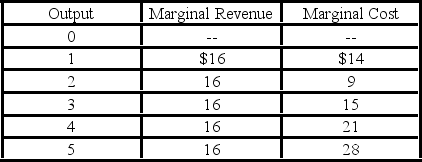
 Refer to the above table. The marginal cost of the third unit of output is:
A) $20.
B) $23.
C) $24.
D) $25.
Question
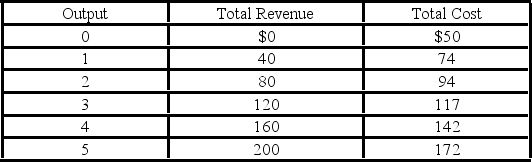
 Refer to the above data. At the profit-maximizing output, the firm's total revenue is:
A) $48.
B) $38.
C) $80.
D) $64.
Question
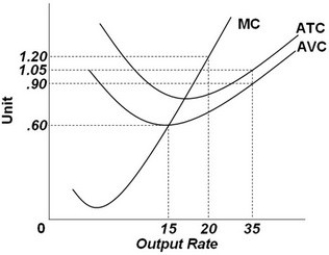 Refer to the above graph. It shows the cost curves for a competitive firm. At output level 20, the marginal cost is:
A) $0.60.
B) $0.90.
C) $1.05.
D) $1.20.
Question
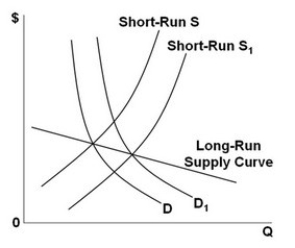 The graph above represents a(n):
A) decreasing-cost industry: firms may be paying lower prices for their inputs when the industry expands.
B) increasing-cost industry: firms may be paying higher prices for their inputs when the industry expands.
C) competitive, break-even industry: the long-run supply curve is upward sloping as it must be according to the law of supply.
D) constant-cost industry: prices of the inputs stay the same, and other production costs are constant as the industry expands.

Unlock Deck
Sign up to unlock the cards in this deck!
Unlock Deck
Unlock Deck
1/6
Play
Full screen (f)
Deck 7: Pure Competition
1
Total revenue for a perfectly competitive firm producing six units of output is $48. Total revenue for producing eight units of output is $64. Given this information, the:
A) firm should raise its price.
B) average revenue for producing eight units is $16.
C) marginal revenue for producing the eighth unit is $16.
D) marginal revenue for producing the eighth unit is $8.
A) firm should raise its price.
B) average revenue for producing eight units is $16.
C) marginal revenue for producing the eighth unit is $16.
D) marginal revenue for producing the eighth unit is $8.
marginal revenue for producing the eighth unit is $8.
2
Given the table below, what is the short-run profit-maximizing level of output for the firm?
A) 2 units
B) 3 units
C) 4 units
D) 5 units
A) 2 units
B) 3 units
C) 4 units
D) 5 units
4 units
3
Refer to the above table. The marginal cost of the third unit of output is:A) $20.
B) $23.
C) $24.
D) $25.
$23.
4
Refer to the above data. At the profit-maximizing output, the firm's total revenue is:A) $48.
B) $38.
C) $80.
D) $64.
Unlock Deck
Unlock for access to all 6 flashcards in this deck.
Unlock Deck
k this deck
5
Refer to the above graph. It shows the cost curves for a competitive firm. At output level 20, the marginal cost is:A) $0.60.
B) $0.90.
C) $1.05.
D) $1.20.
Unlock Deck
Unlock for access to all 6 flashcards in this deck.
Unlock Deck
k this deck
6
The graph above represents a(n):A) decreasing-cost industry: firms may be paying lower prices for their inputs when the industry expands.
B) increasing-cost industry: firms may be paying higher prices for their inputs when the industry expands.
C) competitive, break-even industry: the long-run supply curve is upward sloping as it must be according to the law of supply.
D) constant-cost industry: prices of the inputs stay the same, and other production costs are constant as the industry expands.
Unlock Deck
Unlock for access to all 6 flashcards in this deck.
Unlock Deck
k this deck
Unlock Deck
Unlock for access to all 6 flashcards in this deck.


