Deck 7: Economic Growth
Full screen (f)
Question
Question
Question
Question
Question
Question
Question
Question
Question
Question
The following table shows the GDP per capita of country X for 3 years.
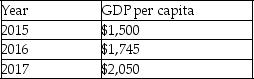
Refer to the table above.At what rate did the country grow between 2015 and 2016?
A) 12.45 percent
B) 15.95 percent
C) 16.33 percent
D) 18 percent
Refer to the table above.At what rate did the country grow between 2015 and 2016?
A) 12.45 percent
B) 15.95 percent
C) 16.33 percent
D) 18 percent
Question
Question
Question
The following table shows the GDP per capita of country X for 3 years.
Refer to the table above.If country X is expected to grow by 19 percent between the years 2017 and 2018,what is the expected GDP per capita for the year 2008?
A) $1,882
B) $2,439.50
C) $2,763.90
D) $3,015
Refer to the table above.If country X is expected to grow by 19 percent between the years 2017 and 2018,what is the expected GDP per capita for the year 2008?
A) $1,882
B) $2,439.50
C) $2,763.90
D) $3,015
Question
Question
The following table shows the GDP per capita of country X for 3 years.
Refer to the table above.At what rate did the country grow between 2016 and 2017?
A) 13.63 percent
B) 15.55 percent
C) 17.47 percent
D) 19.24 percent
Refer to the table above.At what rate did the country grow between 2016 and 2017?
A) 13.63 percent
B) 15.55 percent
C) 17.47 percent
D) 19.24 percent
Question
Question
Question
Question
Question
Question
Question
Question
Question
Question
The following figure shows graphs of various types of growth.
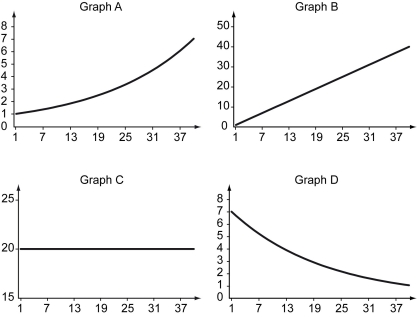
Refer to the figure above.The data in Graph A best represent ________.
A) linear growth
B) no growth
C) exponential growth
D) exponential decline
Refer to the figure above.The data in Graph A best represent ________.
A) linear growth
B) no growth
C) exponential growth
D) exponential decline
Question
Question
The following figure shows graphs of various types of growth.
Refer to the figure above.The data in Graph C best represent ________.
A) linear growth
B) no growth
C) exponential growth
D) exponential decline
Refer to the figure above.The data in Graph C best represent ________.
A) linear growth
B) no growth
C) exponential growth
D) exponential decline
Question
Question
Question
Question
Question
Question
Question
Question
Question
Question
The following figure shows graphs of various types of growth.
Refer to the figure above.The data in Graph B best represent ________.
A) linear growth
B) no growth
C) exponential growth
D) exponential decline
Refer to the figure above.The data in Graph B best represent ________.
A) linear growth
B) no growth
C) exponential growth
D) exponential decline
Question
The following figure shows graphs of various types of growth.
Refer to the figure above.The data in Graph D best represent ________.
A) linear growth
B) no growth
C) exponential growth
D) exponential decline
Refer to the figure above.The data in Graph D best represent ________.
A) linear growth
B) no growth
C) exponential growth
D) exponential decline
Question
Question
Question
Question
Question
Question
Question
Question
The following table shows the GDP per capita of various countries for the years 1960 and 2010 in PPP-adjusted 2005 dollars.The table also contains the implied growth rates,which show how much on average each country needed to grow each year to reach the 2010 level of GDP per capita starting from the 1960 level of GDP per capita.Use the table to answer the following questions.
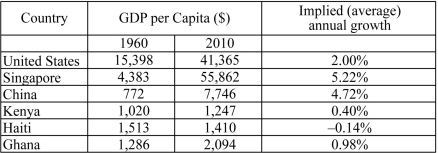
a)During 1960-2010,which countries were able to reduce the gap between their GDP per capita and the U.S.GDP per capita?
b)During 1960-2010,which countries failed to reduce the gap between their GDP per capita and the U.S.GDP per capita?
c)Why have some countries reduced the gap between their incomes and that of the United States and other countries failed to do so?
Question
Question
Question
Question
Question
Question
The following table shows the GDP per capita since 1820 in selected countries (in PPP-adjusted 2005 dollars).
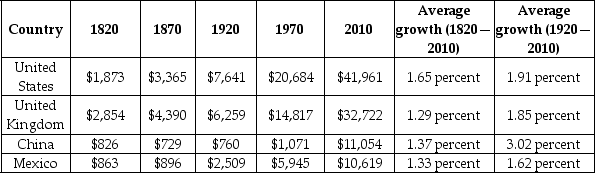
a)Identify the countries that experienced sustained growth between 1820 and 2010.
b)Identify the countries that experienced sustained growth from 1920 to 2010.
c)Identify the countries that experienced catch-up growth from 1920 to 2010.
a)Identify the countries that experienced sustained growth between 1820 and 2010.
b)Identify the countries that experienced sustained growth from 1920 to 2010.
c)Identify the countries that experienced catch-up growth from 1920 to 2010.
Question
Question
Question
Question
Question
Question
Question
Question
Question
The following table shows levels of consumption and investment in four countries.
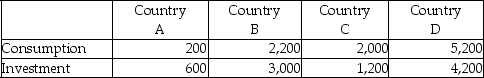
Refer to the table above.Which country has the lowest consumption rate?
A) Country A
B) Country B
C) Country C
D) Country D
Refer to the table above.Which country has the lowest consumption rate?
A) Country A
B) Country B
C) Country C
D) Country D
Question
The following table shows levels of consumption and investment in four countries.
Refer to the table above.Which country has the lowest savings rate?
A) Country A
B) Country B
C) Country C
D) Country D
Refer to the table above.Which country has the lowest savings rate?
A) Country A
B) Country B
C) Country C
D) Country D
Question
Question
Question
Question
The following table shows levels of consumption and investment in four countries.
Refer to the table above.Which country has the highest consumption rate?
A) Country A
B) Country B
C) Country C
D) Country D
Refer to the table above.Which country has the highest consumption rate?
A) Country A
B) Country B
C) Country C
D) Country D
Question
Question
Question
Question
Question
Question
Question
Question
Question
Question
The following table shows levels of consumption and investment in four countries.
Refer to the table above.Which country has the highest savings rate?
A) Country A
B) Country B
C) Country C
D) Country D
Refer to the table above.Which country has the highest savings rate?
A) Country A
B) Country B
C) Country C
D) Country D
Question
Question
Question
Question

Unlock Deck
Sign up to unlock the cards in this deck!
Unlock Deck
Unlock Deck
1/230
Play
Full screen (f)
Deck 7: Economic Growth
1
Suppose the annual growth rate of an economy is expected to be 3 percent.This implies that the economy's ________ is expected to ________ by 3 percent annually.
A) GDP per capita; increase
B) price level; increase
C) capital stock; increase
D) unemployment rate; decline
A) GDP per capita; increase
B) price level; increase
C) capital stock; increase
D) unemployment rate; decline
GDP per capita; increase
2
Decreases in the standard of living are associated with what sort of economic growth?
A) Slow economic growth
B) Sustained economic growth
C) Negative economic growth
D) Zero economic growth
A) Slow economic growth
B) Sustained economic growth
C) Negative economic growth
D) Zero economic growth
Negative economic growth
3
Economic growth refers to an increase in ________.
A) prices
B) tax rates
C) population
D) GDP per capita
A) prices
B) tax rates
C) population
D) GDP per capita
GDP per capita
4
Comparing GDPs over time requires the use of a ________.
A) base year
B) recession and boom period
C) worker productivity index
D) linear growth model
A) base year
B) recession and boom period
C) worker productivity index
D) linear growth model
Unlock Deck
Unlock for access to all 230 flashcards in this deck.
Unlock Deck
k this deck
5
Which of the following statements is true of the U.S.economy over the past 200 years?
A) Its GDP per capita has increased.
B) Its GDP per capita has decreased.
C) There has been no contraction in the economy.
D) The growth rate of GDP has been more than 10 percent per year.
A) Its GDP per capita has increased.
B) Its GDP per capita has decreased.
C) There has been no contraction in the economy.
D) The growth rate of GDP has been more than 10 percent per year.
Unlock Deck
Unlock for access to all 230 flashcards in this deck.
Unlock Deck
k this deck
6
Country A's GDP per capita at the beginning of 2005 was $22,150.At the beginning of 2006,it increased to $27,600.Calculate Country A's growth rate of GDP per capita between 2005 and 2006.
Unlock Deck
Unlock for access to all 230 flashcards in this deck.
Unlock Deck
k this deck
7
Changes in the price level are the sole factor in determining ________.
A) nominal GDP
B) monetary policy
C) real GDP
D) trade policy
A) nominal GDP
B) monetary policy
C) real GDP
D) trade policy
Unlock Deck
Unlock for access to all 230 flashcards in this deck.
Unlock Deck
k this deck
8
If GDP per capita in year T is represented by YT and the GDP per capita in the following year is represented by YT₊₁,then the formula for calculating the growth rate between these two years is ________.
A) (YT₊₁/YT)/100
B) (YT₊₁ − YT )/YT
C) (YT₊₁ + YT)/YT
D) (YT₊₁ + YT)/YT₊₁
A) (YT₊₁/YT)/100
B) (YT₊₁ − YT )/YT
C) (YT₊₁ + YT)/YT
D) (YT₊₁ + YT)/YT₊₁
Unlock Deck
Unlock for access to all 230 flashcards in this deck.
Unlock Deck
k this deck
9
The annual growth rate of U.S.real GDP per capita over the past 60 years has averaged around ________.
A) 0 percent
B) 2 percent
C) 4 percent
D) 6 percent
A) 0 percent
B) 2 percent
C) 4 percent
D) 6 percent
Unlock Deck
Unlock for access to all 230 flashcards in this deck.
Unlock Deck
k this deck
10
The following table shows the GDP per capita of country X for 3 years.
Refer to the table above.At what rate did the country grow between 2015 and 2016?
A) 12.45 percent
B) 15.95 percent
C) 16.33 percent
D) 18 percent
Refer to the table above.At what rate did the country grow between 2015 and 2016?
A) 12.45 percent
B) 15.95 percent
C) 16.33 percent
D) 18 percent
Unlock Deck
Unlock for access to all 230 flashcards in this deck.
Unlock Deck
k this deck
11
Suppose GDP per capita is $2,500 in 1912 and $2,550 in 1913.The growth rate of GDP per capita from 1912 to 1913 is ________.
A) 0.02 percent
B) 2 percent
C) 5 percent
D) 50 percent
A) 0.02 percent
B) 2 percent
C) 5 percent
D) 50 percent
Unlock Deck
Unlock for access to all 230 flashcards in this deck.
Unlock Deck
k this deck
12
Which of the following describes the effect of the Great Depression on economic growth?
A) The Great Depression resulted in permanently lower growth rates for the United States.
B) The Great Depression halted permanently the United States' sustained growth.
C) The Great Depression began the United States' sustained growth.
D) The Great Depression was a temporary event with no long-run effect on economic growth.
Unlock Deck
Unlock for access to all 230 flashcards in this deck.
Unlock Deck
k this deck
13
The following table shows the GDP per capita of country X for 3 years.
Refer to the table above.If country X is expected to grow by 19 percent between the years 2017 and 2018,what is the expected GDP per capita for the year 2008?
A) $1,882
B) $2,439.50
C) $2,763.90
D) $3,015
Refer to the table above.If country X is expected to grow by 19 percent between the years 2017 and 2018,what is the expected GDP per capita for the year 2008?
A) $1,882
B) $2,439.50
C) $2,763.90
D) $3,015
Unlock Deck
Unlock for access to all 230 flashcards in this deck.
Unlock Deck
k this deck
14
Which statement best describes the effect of the Great Depression on U.S.growth?
A) The Great Depression reversed all growth that had been experienced over the previous 100 years.
B) The U.S. economy grew at the same rate during the Great Depression as during the rest of the twentieth century.
C) The Great Depression temporarily reversed U.S. growth, but the U.S. economy grew steadily before and after it.
D) The Great Depression led to slow growth in the U.S. for the following 50 years.
Unlock Deck
Unlock for access to all 230 flashcards in this deck.
Unlock Deck
k this deck
15
The following table shows the GDP per capita of country X for 3 years.
Refer to the table above.At what rate did the country grow between 2016 and 2017?
A) 13.63 percent
B) 15.55 percent
C) 17.47 percent
D) 19.24 percent
Refer to the table above.At what rate did the country grow between 2016 and 2017?
A) 13.63 percent
B) 15.55 percent
C) 17.47 percent
D) 19.24 percent
Unlock Deck
Unlock for access to all 230 flashcards in this deck.
Unlock Deck
k this deck
16
Which of the following characterized the U.S.economy in the decades following the Great Depression?
A) The price level has decreased steadily over time.
B) Despite fairly constant growth, major economic downturns have produced net negative growth.
C) The economy was permanently and irreparably damaged by the events of the Great Depression.
D) Longer-run movements have indicated sustained and steady growth.
Unlock Deck
Unlock for access to all 230 flashcards in this deck.
Unlock Deck
k this deck
17
The advantage of using real GDP over nominal GDP is that it ________.
A) is easier to calculate
B) can be compared over time
C) takes the distribution of income into account
D) takes into account changes in the ruling political party
A) is easier to calculate
B) can be compared over time
C) takes the distribution of income into account
D) takes into account changes in the ruling political party
Unlock Deck
Unlock for access to all 230 flashcards in this deck.
Unlock Deck
k this deck
18
Real GDP refers to GDP adjusted for changes in ________.
A) tax rates
B) prices
C) net imports
D) ruling political party
A) tax rates
B) prices
C) net imports
D) ruling political party
Unlock Deck
Unlock for access to all 230 flashcards in this deck.
Unlock Deck
k this deck
19
The process by which a quantity grows at a constant proportion in every time period is called ________ growth.
A) linear
B) catch-up
C) exponential
D) logarithmic
A) linear
B) catch-up
C) exponential
D) logarithmic
Unlock Deck
Unlock for access to all 230 flashcards in this deck.
Unlock Deck
k this deck
20
The ________ nature of economic growth is one of the major reasons there are large differences in GDP per capita across countries.
A) linear
B) exponential
C) logarithmic
D) quadratic
A) linear
B) exponential
C) logarithmic
D) quadratic
Unlock Deck
Unlock for access to all 230 flashcards in this deck.
Unlock Deck
k this deck
21
Which characteristic of economic growth is responsible for the large differences in GDP per capita across countries?
Unlock Deck
Unlock for access to all 230 flashcards in this deck.
Unlock Deck
k this deck
22
Refer to the scenario above.What will be the difference in the GDPs per capita of both countries at the beginning of year 3?
A) $8.99
B) $30.39
C) $99.84
D) $339.69
A) $8.99
B) $30.39
C) $99.84
D) $339.69
Unlock Deck
Unlock for access to all 230 flashcards in this deck.
Unlock Deck
k this deck
23
Which of the following statements is true?
A) To depict variables that have exponential growth, it is more convenient to use an axis with a linear scale.
B) To depict variables that have exponential growth, it is more convenient to use an axis with a proportional scale.
C) Exponential growth refers to growth by the same amount in every time period.
D) Linear growth refers to growth by the same proportion in every time period.
Unlock Deck
Unlock for access to all 230 flashcards in this deck.
Unlock Deck
k this deck
24
GDP per capita in Australia is $50,000.If Australian GDP per capita grows 6 percent per year for 2 years,which formula shows its GDP per capita after 2 years?
A) $50,000 × 1.06
B) $50,000 × 1.12
C) $50,000 × 1.06 × 1.06
D) $50,000 × 1.06 × 1.12
A) $50,000 × 1.06
B) $50,000 × 1.12
C) $50,000 × 1.06 × 1.06
D) $50,000 × 1.06 × 1.12
Unlock Deck
Unlock for access to all 230 flashcards in this deck.
Unlock Deck
k this deck
25
The following figure shows graphs of various types of growth.
Refer to the figure above.The data in Graph A best represent ________.
A) linear growth
B) no growth
C) exponential growth
D) exponential decline
Refer to the figure above.The data in Graph A best represent ________.
A) linear growth
B) no growth
C) exponential growth
D) exponential decline
Unlock Deck
Unlock for access to all 230 flashcards in this deck.
Unlock Deck
k this deck
26
Initially Country A has a greater GDP per capita than Country B,but the growth rate in Country A is only 1 percent,while it is 2 percent in Country B.If these growth rates continue forever,which of the following is correct?
A) Country A will always have a higher GDP per capita than Country B.
B) Country B will not be able to sustain such a high growth rate.
C) The GDP per capita in Country B will eventually catch up to, but not overtake, that of Country A.
D) The GDP per capita in Country B will eventually overtake that of Country A.
Unlock Deck
Unlock for access to all 230 flashcards in this deck.
Unlock Deck
k this deck
27
The following figure shows graphs of various types of growth.
Refer to the figure above.The data in Graph C best represent ________.
A) linear growth
B) no growth
C) exponential growth
D) exponential decline
Refer to the figure above.The data in Graph C best represent ________.
A) linear growth
B) no growth
C) exponential growth
D) exponential decline
Unlock Deck
Unlock for access to all 230 flashcards in this deck.
Unlock Deck
k this deck
28
Exponential growth implies that ________.
A) growth rates can only be positive
B) growth rates will alternate between positive and negative values in every consecutive time period
C) relatively large differences in growth rates will translate into small differences in the level of a quantity after many years of growing
D) relatively small differences in growth rates will translate into large differences in the level of a quantity after many years of growing
Unlock Deck
Unlock for access to all 230 flashcards in this deck.
Unlock Deck
k this deck
29
Refer to the scenario above.What will be the GDP per capita of Country B at the beginning of year 3?
A) $2,450.65
B) $2,555.15
C) $2,646.00
D) $2,882.85
A) $2,450.65
B) $2,555.15
C) $2,646.00
D) $2,882.85
Unlock Deck
Unlock for access to all 230 flashcards in this deck.
Unlock Deck
k this deck
30
Refer to the scenario above.What will be the GDP per capita of Country A at the beginning of year 3?
A) $2,410.26
B) $2,546.16
C) $2,760.24
D) $2,800.00
A) $2,410.26
B) $2,546.16
C) $2,760.24
D) $2,800.00
Unlock Deck
Unlock for access to all 230 flashcards in this deck.
Unlock Deck
k this deck
31
When current growth builds on past growth,growth is ________.
A) exponential
B) linear
C) logarithmic
D) negative
A) exponential
B) linear
C) logarithmic
D) negative
Unlock Deck
Unlock for access to all 230 flashcards in this deck.
Unlock Deck
k this deck
32
Refer to the scenario above.Which of the following statements is true?
A) The gap between the GDP per capita of both countries will converge over time.
B) The gap between the GDP per capita of both countries will diverge over time.
C) The gap between the GDP per capita of both countries will remain the same over time.
D) In 30 years, the GDP per capita of Country A is likely to be higher than that of Country B.
Unlock Deck
Unlock for access to all 230 flashcards in this deck.
Unlock Deck
k this deck
33
Scenario: In 2010, world GDP per capita was $9,500. In the same year, the Economist magazine forecast that in 2020, world GDP per capita would be $15,000
Refer to the scenario above.The Economist magazine also forecasts that the rate of growth will remain constant through 2030.If this is correct,then world GDP per capita in 2030 will be closest to ________.
A) $20,000
B) $22,000
C) $24,000
D) $26,000
Refer to the scenario above.The Economist magazine also forecasts that the rate of growth will remain constant through 2030.If this is correct,then world GDP per capita in 2030 will be closest to ________.
A) $20,000
B) $22,000
C) $24,000
D) $26,000
Unlock Deck
Unlock for access to all 230 flashcards in this deck.
Unlock Deck
k this deck
34
Scenario: In 2010, world GDP per capita was $9,500. In the same year, the Economist magazine forecast that in 2020, world GDP per capita would be $15,000
Refer to the scenario above.If the Economist magazine's forecast is correct,then the growth rate per decade from 2010 to 2020 would be approximately ________.
A) 5 percent
B) 6 percent
C) 50 percent
D) 60 percent
Refer to the scenario above.If the Economist magazine's forecast is correct,then the growth rate per decade from 2010 to 2020 would be approximately ________.
A) 5 percent
B) 6 percent
C) 50 percent
D) 60 percent
Unlock Deck
Unlock for access to all 230 flashcards in this deck.
Unlock Deck
k this deck
35
Scenario: In 2000, world GDP per capita was $5,500. In 2010, world GDP per capita was $9,500.
Refer to the scenario above.If the world sustains this growth rate,approximately what will world GDP per capita be in 2030?
A) $16,400
B) $17,500
C) $21,500
D) $28,300
Refer to the scenario above.If the world sustains this growth rate,approximately what will world GDP per capita be in 2030?
A) $16,400
B) $17,500
C) $21,500
D) $28,300
Unlock Deck
Unlock for access to all 230 flashcards in this deck.
Unlock Deck
k this deck
36
If the effects of the growth in a variable are approximately constant,then the growth is likely to be ________.
A) linear
B) negligible
C) exponential
D) logarithmic
A) linear
B) negligible
C) exponential
D) logarithmic
Unlock Deck
Unlock for access to all 230 flashcards in this deck.
Unlock Deck
k this deck
37
The following figure shows graphs of various types of growth.
Refer to the figure above.The data in Graph B best represent ________.
A) linear growth
B) no growth
C) exponential growth
D) exponential decline
Refer to the figure above.The data in Graph B best represent ________.
A) linear growth
B) no growth
C) exponential growth
D) exponential decline
Unlock Deck
Unlock for access to all 230 flashcards in this deck.
Unlock Deck
k this deck
38
The following figure shows graphs of various types of growth.
Refer to the figure above.The data in Graph D best represent ________.
A) linear growth
B) no growth
C) exponential growth
D) exponential decline
Refer to the figure above.The data in Graph D best represent ________.
A) linear growth
B) no growth
C) exponential growth
D) exponential decline
Unlock Deck
Unlock for access to all 230 flashcards in this deck.
Unlock Deck
k this deck
39
Scenario: In 2000, the GDP per capita in Ohio is $35,000. Ohio's GDP per capita is predicted to increase 3 percent per year for the next 5 years.
Refer to the scenario above.If the prediction in the scenario is correct,by approximately what percentage will Ohio's GDP per capita rise in 2005?
A) 15 percent
B) 16 percent
C) 17 percent
D) 18 percent
Refer to the scenario above.If the prediction in the scenario is correct,by approximately what percentage will Ohio's GDP per capita rise in 2005?
A) 15 percent
B) 16 percent
C) 17 percent
D) 18 percent
Unlock Deck
Unlock for access to all 230 flashcards in this deck.
Unlock Deck
k this deck
40
Scenario: In 2000, world GDP per capita was $5,500. In 2010, world GDP per capita was $9,500.
Refer to the scenario above.If the world sustains this growth rate,approximately what will world GDP per capita be in 2020?
A) $13,500
B) $15,000
C) $16,400
D) $19,000
Refer to the scenario above.If the world sustains this growth rate,approximately what will world GDP per capita be in 2020?
A) $13,500
B) $15,000
C) $16,400
D) $19,000
Unlock Deck
Unlock for access to all 230 flashcards in this deck.
Unlock Deck
k this deck
41
The countries that have experienced fast growth in GDP per capita over the past 50 years are mostly located where?
A) Central America
B) East Asia
C) West Africa
D) South America
A) Central America
B) East Asia
C) West Africa
D) South America
Unlock Deck
Unlock for access to all 230 flashcards in this deck.
Unlock Deck
k this deck
42
While countries like Botswana and Singapore have experienced rapid growth rates since 1960,the growth of the Democratic Republic of the Congo is best described as ________.
A) steady
B) slow
C) negative
D) linear
A) steady
B) slow
C) negative
D) linear
Unlock Deck
Unlock for access to all 230 flashcards in this deck.
Unlock Deck
k this deck
43
"Catch-up growth" refers to a process where relatively poorer nations increase their incomes by ________.
A) working harder than more advanced nations
B) extracting more natural resources than more advanced nations
C) having higher birthrates than more advanced nations
D) using technologies from more advanced nations
A) working harder than more advanced nations
B) extracting more natural resources than more advanced nations
C) having higher birthrates than more advanced nations
D) using technologies from more advanced nations
Unlock Deck
Unlock for access to all 230 flashcards in this deck.
Unlock Deck
k this deck
44
Suppose that a nation's GDP per capita grows at a constant 4 percent per year.You graph the nation's GDP per capita on a graph with a linear time scale on the x-axis,and a linear GDP per capita scale on the y-axis.What will the nation's GDP per capita look like on the graph?
A) A horizontal line
B) A straight upward-sloping line
C) A curve that is sloped upward and increasing in slope
D) A curve that is sloped upward and decreasing in slope
A) A horizontal line
B) A straight upward-sloping line
C) A curve that is sloped upward and increasing in slope
D) A curve that is sloped upward and decreasing in slope
Unlock Deck
Unlock for access to all 230 flashcards in this deck.
Unlock Deck
k this deck
45
Which of the following pairs of countries has used catch-up growth over the past few decades to achieve incomes that are now comparable to that of the United States?
A) Singapore and South Korea
B) Mexico and Brazil
C) The United Kingdom and France
D) Kenya and Rwanda
A) Singapore and South Korea
B) Mexico and Brazil
C) The United Kingdom and France
D) Kenya and Rwanda
Unlock Deck
Unlock for access to all 230 flashcards in this deck.
Unlock Deck
k this deck
46
The following table shows the GDP per capita of various countries for the years 1960 and 2010 in PPP-adjusted 2005 dollars.The table also contains the implied growth rates,which show how much on average each country needed to grow each year to reach the 2010 level of GDP per capita starting from the 1960 level of GDP per capita.Use the table to answer the following questions.
a)During 1960-2010,which countries were able to reduce the gap between their GDP per capita and the U.S.GDP per capita?
b)During 1960-2010,which countries failed to reduce the gap between their GDP per capita and the U.S.GDP per capita?
c)Why have some countries reduced the gap between their incomes and that of the United States and other countries failed to do so?
Unlock Deck
Unlock for access to all 230 flashcards in this deck.
Unlock Deck
k this deck
47
The growth process whereby relatively poorer nations increase their income by taking advantage of knowledge and technologies already invented in other,technologically more advanced countries is known as ________ growth.
A) transfer
B) catch-up
C) trade-based
D) innovative
A) transfer
B) catch-up
C) trade-based
D) innovative
Unlock Deck
Unlock for access to all 230 flashcards in this deck.
Unlock Deck
k this deck
48
Catch-up growth is characterized by disparities in growth levels,magnified by the ________ nature of economic growth.
A) disproportionate
B) exponential
C) homogenous
D) linear
A) disproportionate
B) exponential
C) homogenous
D) linear
Unlock Deck
Unlock for access to all 230 flashcards in this deck.
Unlock Deck
k this deck
49
Country A's GDP per capita is 80 percent of Country B's GDP per capita.If both countries experience growth of 5 percent,Country A's GDP per capita will now be what percentage of Country B's GDP per capita?
A) 75 percent
B) 80 percent
C) 85 percent
D) 90 percent
A) 75 percent
B) 80 percent
C) 85 percent
D) 90 percent
Unlock Deck
Unlock for access to all 230 flashcards in this deck.
Unlock Deck
k this deck
50
Scenario: In 2000, the GDP per capita in Ohio is $35,000. Ohio's GDP per capita is predicted to increase 3 percent per year for the next 5 years.
Refer to the scenario above.If the prediction in the scenario is correct,what will Ohio's GDP per capita be in 2005 (to the nearest thousand)?
A) $39,000
B) $40,000
C) $41,000
D) $42,000
Refer to the scenario above.If the prediction in the scenario is correct,what will Ohio's GDP per capita be in 2005 (to the nearest thousand)?
A) $39,000
B) $40,000
C) $41,000
D) $42,000
Unlock Deck
Unlock for access to all 230 flashcards in this deck.
Unlock Deck
k this deck
51
China's GDP per capita is currently lower than that of Japan.If Japanese GDP per capita grows at 2 percent per year,how fast must Chinese GDP per capita grow to eventually catch up to Japanese GDP per capita?
A) At least 5 percent per year
B) At least 3 percent per year
C) Any rate above 2 percent per year
D) Any positive rate
A) At least 5 percent per year
B) At least 3 percent per year
C) Any rate above 2 percent per year
D) Any positive rate
Unlock Deck
Unlock for access to all 230 flashcards in this deck.
Unlock Deck
k this deck
52
The following table shows the GDP per capita since 1820 in selected countries (in PPP-adjusted 2005 dollars).
a)Identify the countries that experienced sustained growth between 1820 and 2010.
b)Identify the countries that experienced sustained growth from 1920 to 2010.
c)Identify the countries that experienced catch-up growth from 1920 to 2010.
a)Identify the countries that experienced sustained growth between 1820 and 2010.
b)Identify the countries that experienced sustained growth from 1920 to 2010.
c)Identify the countries that experienced catch-up growth from 1920 to 2010.
Unlock Deck
Unlock for access to all 230 flashcards in this deck.
Unlock Deck
k this deck
53
U.S.GDP per capita has increased approximately 2 percent per year over an extended period.This is a good example of what sort of growth?
A) Catch-up growth
B) Power growth
C) Linear growth
D) Sustained growth
A) Catch-up growth
B) Power growth
C) Linear growth
D) Sustained growth
Unlock Deck
Unlock for access to all 230 flashcards in this deck.
Unlock Deck
k this deck
54
Singapore had a GDP per capita of $395 in 1960.It then started taking advantage of knowledge and technologies already invented in other technologically advanced countries.In 2013,its GDP per capita had increased to $52,918.The growth in Singapore's average per capita GDP is considered to be ________ growth.
A) catch-up
B) sustained
C) instant
D) disguised
A) catch-up
B) sustained
C) instant
D) disguised
Unlock Deck
Unlock for access to all 230 flashcards in this deck.
Unlock Deck
k this deck
55
How does the concept of catch-up growth explain the diminishing income gap between developing economies and developed economies?
Unlock Deck
Unlock for access to all 230 flashcards in this deck.
Unlock Deck
k this deck
56
California's GDP per capita is $60,000,while Nevada's GDP per capita is $40,000.If both grow at 2 percent per year,how long will it take for the two states to have the same GDP per capita?
A) 25 years
B) 35 years
C) 50 years
D) They will never have the same GDP per capita
A) 25 years
B) 35 years
C) 50 years
D) They will never have the same GDP per capita
Unlock Deck
Unlock for access to all 230 flashcards in this deck.
Unlock Deck
k this deck
57
Sustained growth refers to a growth process in which ________.
A) GDP per capita grows at a positive and steady rate for long periods of time
B) GDP per capita grows at a rate of more than 20 percent per year for long periods of time
C) growth in GDP per capita is primarily attributed to public sector firms and enterprises
D) growth in GDP per capita is translated into an equal increase in welfare for all citizens in a country
Unlock Deck
Unlock for access to all 230 flashcards in this deck.
Unlock Deck
k this deck
58
Cross-country comparison of GDP per capita between 1960 and 2010 shows that countries such as ________ have grown at negative rates during this period.
A) Mexico and Brazil
B) Haiti and the Democratic Republic of Congo
C) India and China
D) South Korea and Singapore
A) Mexico and Brazil
B) Haiti and the Democratic Republic of Congo
C) India and China
D) South Korea and Singapore
Unlock Deck
Unlock for access to all 230 flashcards in this deck.
Unlock Deck
k this deck
59
Suppose that a nation's GDP per capita grows at a constant 4 percent per year.You graph the nation's GDP per capita on a graph with a linear time scale on the x-axis,and a proportional GDP per capita scale on the y-axis.What will the nation's GDP per capita look like on the graph?
A) A horizontal line
B) A straight upward-sloping line
C) A curve that is sloped upward, and increasing in slope
D) A curve that is sloped upward, and decreasing in slope
A) A horizontal line
B) A straight upward-sloping line
C) A curve that is sloped upward, and increasing in slope
D) A curve that is sloped upward, and decreasing in slope
Unlock Deck
Unlock for access to all 230 flashcards in this deck.
Unlock Deck
k this deck
60
The implied growth rate for a country between 1960 and 2010 was 6 percent.This implies that ________.
A) the country grew by at least 6 percent in any of the 50 years between 1960 to 2010 to reach the level of GDP in 2010 starting at the 1960 level
B) the growth rate of GDP in the country was above 6 percent between 1960 and 2010
C) the country grew at an average rate of 6 percent per year between 1960 and 2010 to reach the 2010 level of GDP starting at the 1960 level
D) the country grew at rates above 6 percent per year between 1960 and 2010 to reach the 2010 level of GDP starting at the 1960 level
Unlock Deck
Unlock for access to all 230 flashcards in this deck.
Unlock Deck
k this deck
61
The following table shows levels of consumption and investment in four countries.
Refer to the table above.Which country has the lowest consumption rate?
A) Country A
B) Country B
C) Country C
D) Country D
Refer to the table above.Which country has the lowest consumption rate?
A) Country A
B) Country B
C) Country C
D) Country D
Unlock Deck
Unlock for access to all 230 flashcards in this deck.
Unlock Deck
k this deck
62
The following table shows levels of consumption and investment in four countries.
Refer to the table above.Which country has the lowest savings rate?
A) Country A
B) Country B
C) Country C
D) Country D
Refer to the table above.Which country has the lowest savings rate?
A) Country A
B) Country B
C) Country C
D) Country D
Unlock Deck
Unlock for access to all 230 flashcards in this deck.
Unlock Deck
k this deck
63
The saving rate indicates ________.
A) the fraction of income that households save
B) the difference between household consumption and savings
C) the rate of return households earn on their savings
D) the difference between government revenue and government expenditure
A) the fraction of income that households save
B) the difference between household consumption and savings
C) the rate of return households earn on their savings
D) the difference between government revenue and government expenditure
Unlock Deck
Unlock for access to all 230 flashcards in this deck.
Unlock Deck
k this deck
64
Consider two economies: Barylia and Lithasia.The GDP per capita in Lithasia is $6,000,while the GDP per capita in Barylia is $12,000.Both countries grow exponentially at an annual rate of 10 percent.How will their GDPs vary over the next year? Is there any limitation to comparing the absolute levels of GDP per capita of both countries over the next years? If yes,what is a plausible solution?
Unlock Deck
Unlock for access to all 230 flashcards in this deck.
Unlock Deck
k this deck
65
Scenario: In a closed economy without a government, the consumption expenditure equals $5,000 and the investment expenditure equals $2,000.
Refer to the scenario above.What is the national income of the economy?
A) $2,000
B) $5,000
C) $7,000
D) $10,000
Refer to the scenario above.What is the national income of the economy?
A) $2,000
B) $5,000
C) $7,000
D) $10,000
Unlock Deck
Unlock for access to all 230 flashcards in this deck.
Unlock Deck
k this deck
66
The following table shows levels of consumption and investment in four countries.
Refer to the table above.Which country has the highest consumption rate?
A) Country A
B) Country B
C) Country C
D) Country D
Refer to the table above.Which country has the highest consumption rate?
A) Country A
B) Country B
C) Country C
D) Country D
Unlock Deck
Unlock for access to all 230 flashcards in this deck.
Unlock Deck
k this deck
67
The rates of return that households expect on their savings are determined by ________.
A) tax rates
B) interest rates
C) exchange rates
D) the level of government expenditure
A) tax rates
B) interest rates
C) exchange rates
D) the level of government expenditure
Unlock Deck
Unlock for access to all 230 flashcards in this deck.
Unlock Deck
k this deck
68
The process by which the stock of equipment and structures available to an economy is increased by investment is referred to as ________.
A) investment growth
B) output expansion
C) physical capital accumulation
D) autonomous growth
A) investment growth
B) output expansion
C) physical capital accumulation
D) autonomous growth
Unlock Deck
Unlock for access to all 230 flashcards in this deck.
Unlock Deck
k this deck
69
The value of all equipment and structures in an economy is referred to as its ________.
A) national income
B) physical capital stock
C) wealth
D) asset value
A) national income
B) physical capital stock
C) wealth
D) asset value
Unlock Deck
Unlock for access to all 230 flashcards in this deck.
Unlock Deck
k this deck
70
Assuming all else equal,if the production technology available to a nation improves,its ________.
A) GDP decreases
B) stock of physical capital decreases
C) GDP increases
D) population increases
A) GDP decreases
B) stock of physical capital decreases
C) GDP increases
D) population increases
Unlock Deck
Unlock for access to all 230 flashcards in this deck.
Unlock Deck
k this deck
71
In a closed economy without a government,________.
A) consumption equals savings
B) consumption equals investment
C) saving equals investment
D) saving equals net exports
A) consumption equals savings
B) consumption equals investment
C) saving equals investment
D) saving equals net exports
Unlock Deck
Unlock for access to all 230 flashcards in this deck.
Unlock Deck
k this deck
72
A new coal-fired power plant will increase aggregate production.Which element of the aggregate production function Y = A × F(K,H)will this power plant increase?
A) A
B) F
C) K
D) H
A) A
B) F
C) K
D) H
Unlock Deck
Unlock for access to all 230 flashcards in this deck.
Unlock Deck
k this deck
73
Which of the following statements is true?
A) A nation with a high saving rate will accumulate capital slowly.
B) A nation with a high saving rate will accumulate capital rapidly.
C) In a closed economy, government spending equals zero.
D) In a closed economy, aggregate consumption equals zero.
A) A nation with a high saving rate will accumulate capital slowly.
B) A nation with a high saving rate will accumulate capital rapidly.
C) In a closed economy, government spending equals zero.
D) In a closed economy, aggregate consumption equals zero.
Unlock Deck
Unlock for access to all 230 flashcards in this deck.
Unlock Deck
k this deck
74
Explain how saving equals investment in a closed capitalist economy.
Unlock Deck
Unlock for access to all 230 flashcards in this deck.
Unlock Deck
k this deck
75
Scenario: In a closed economy without a government, the consumption expenditure equals $5,000 and the investment expenditure equals $2,000.
Refer to the scenario above.If the population of the economy is 200,the per capita national income is ________.
A) $10
B) $17
C) $35
D) $50
Refer to the scenario above.If the population of the economy is 200,the per capita national income is ________.
A) $10
B) $17
C) $35
D) $50
Unlock Deck
Unlock for access to all 230 flashcards in this deck.
Unlock Deck
k this deck
76
The following table shows levels of consumption and investment in four countries.
Refer to the table above.Which country has the highest savings rate?
A) Country A
B) Country B
C) Country C
D) Country D
Refer to the table above.Which country has the highest savings rate?
A) Country A
B) Country B
C) Country C
D) Country D
Unlock Deck
Unlock for access to all 230 flashcards in this deck.
Unlock Deck
k this deck
77
In a closed economy,________ equal to zero.
A) investment is
B) consumption is
C) net exports are
D) government spending is
A) investment is
B) consumption is
C) net exports are
D) government spending is
Unlock Deck
Unlock for access to all 230 flashcards in this deck.
Unlock Deck
k this deck
78
In a closed economy without a government,income equals aggregate ________.
A) consumption
B) saving
C) saving plus aggregate investment
D) saving plus aggregate consumption
A) consumption
B) saving
C) saving plus aggregate investment
D) saving plus aggregate consumption
Unlock Deck
Unlock for access to all 230 flashcards in this deck.
Unlock Deck
k this deck
79
From the perspective of individual households,income can only be consumed or saved,the latter of which become ________ utilized by firms.
A) investment
B) capital depreciation
C) intellectual property
D) interest rates
A) investment
B) capital depreciation
C) intellectual property
D) interest rates
Unlock Deck
Unlock for access to all 230 flashcards in this deck.
Unlock Deck
k this deck
80
Consider two countries,Country A and Country B,that are alike in most respects.However,the saving rates in the two countries differ.Country A's saving rate is greater than Country B's saving rate.Which of the following statements is true?
A) The rate of physical capital accumulation will be the same in both economies.
B) Physical capital accumulation will occur faster in Country A than in Country B.
C) Physical capital accumulation will occur faster in Country B than in Country A.
D) The growth rate in Country B is likely to be higher than the growth rate in Country A in the long run.
Unlock Deck
Unlock for access to all 230 flashcards in this deck.
Unlock Deck
k this deck
Unlock Deck
Unlock for access to all 230 flashcards in this deck.


