Deck 17: The Trade Off between Inflation and Unemployment
Full screen (f)
Question
Question
Question
Question
Question
Question
Question
Question
Question
Question
Question
Question
Question
Question
Question
Question
Question
Question
Question
Question
Question
Question
Question
Question
Question
Question
Question
Question
Question
Question
Question
Question
Question
Question
Question
Question
Question
Question
Question
Question
Question
Question
Figure 17-3
Given the situation in graph (1)in Figure 17-3,what can be expected to change in graph (1)when the economy's self-correcting mechanism operates?
A) aggregate demand increases
B) aggregate demand decreases
C) aggregate supply increases
D) aggregate supply decreases
Given the situation in graph (1)in Figure 17-3,what can be expected to change in graph (1)when the economy's self-correcting mechanism operates?
A) aggregate demand increases
B) aggregate demand decreases
C) aggregate supply increases
D) aggregate supply decreases
Question
Question
Figure 17-2
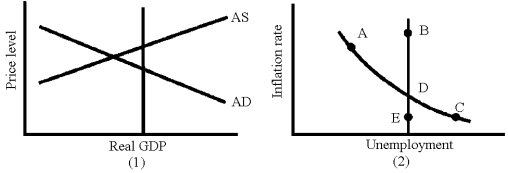
Given the situation in graph (1)in Figure 17-2,what action could be expected from the economy's self-correcting mechanism?
A) an increase in aggregate demand
B) a decrease in aggregate demand
C) an increase in aggregate supply
D) a decrease in aggregate supply
Given the situation in graph (1)in Figure 17-2,what action could be expected from the economy's self-correcting mechanism?
A) an increase in aggregate demand
B) a decrease in aggregate demand
C) an increase in aggregate supply
D) a decrease in aggregate supply
Question
Question
Question
Question
Question
Question
Question
Figure 17-1
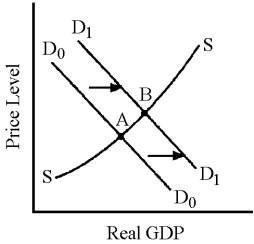
Which of the following is t about the economy depicted in Figure 17-1?
A) Tax incentives are being used to stimulate aggregate supply.
B) Policy makers believe the costs of unemployment are higher than the costs of inflation.
C) Contractionary monetary policy is being enacted to fight inflation.
D) Prices are rising but real GDP is falling.
Question
Figure 17-2
Given the situation in graph (1)in Figure 17-2,what movement would be expected in graph (2)from the economy's self-correcting mechanism?
A) A to B
B) A to D
C) C to E
D) D to C
Given the situation in graph (1)in Figure 17-2,what movement would be expected in graph (2)from the economy's self-correcting mechanism?
A) A to B
B) A to D
C) C to E
D) D to C
Question
Question
Figure 17-1
Which of the following is t about the economy depicted in Figure 17-1?
A) It is experiencing supply-side inflation.
B) Policy makers have chosen to fight inflation rather than unemployment.
C) The increase in aggregate demand has increased prices but not real GDP.
D) The slope of the aggregate supply curve embodies the trade-off between unemployment and inflation.
Question
Question
Question
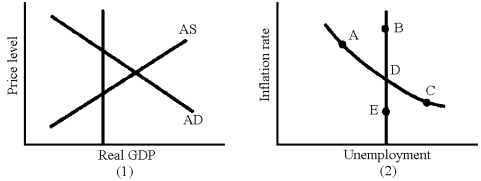
Figure 17-3
Given the situation in graph (1)in Figure 17-3,what movement would be expected in graph (2)from the economy's self-correcting mechanism?
A) A to B
B) A to D
C) C to E
D) D to C
Given the situation in graph (1)in Figure 17-3,what movement would be expected in graph (2)from the economy's self-correcting mechanism?
A) A to B
B) A to D
C) C to E
D) D to C
Question
Question
Question
Question
Question
Question
Question
Question
Question
Question
Question
Question
Question
Question
Question
Question
Question
Question
Question
Question
Question
Question
Question

Unlock Deck
Sign up to unlock the cards in this deck!
Unlock Deck
Unlock Deck
1/214
Play
Full screen (f)
Deck 17: The Trade Off between Inflation and Unemployment
1
The supply-side shocks of the 1970s shifted the aggregate supply curve inward.
True
2
The economy's self-correcting mechanism ensures that neither recessionary nor inflationary gaps will be eliminated eventually.
True
3
Every year from 1954 to 1984,the U.S.economy was characterized by higher output and lower prices.
False
4
Inflation can come from the demand side or from the supply side of the economy.
Unlock Deck
Unlock for access to all 214 flashcards in this deck.
Unlock Deck
k this deck
5
A stimulus to aggregate demand will normally pull prices up but cause a reduction in output.
Unlock Deck
Unlock for access to all 214 flashcards in this deck.
Unlock Deck
k this deck
6
Expansionary fiscal and monetary policy from 2008 to 2010,took the risk of being inflationary for the sake of avoiding additional unemployment.
Unlock Deck
Unlock for access to all 214 flashcards in this deck.
Unlock Deck
k this deck
7
The Phillips curve shows the relationship between the rate of inflation and the rate of growth of real GDP.
Unlock Deck
Unlock for access to all 214 flashcards in this deck.
Unlock Deck
k this deck
8
The cure for inflation can come only from changes on the demand side.
Unlock Deck
Unlock for access to all 214 flashcards in this deck.
Unlock Deck
k this deck
9
An inflationary gap will eliminate itself through a process of price increases.
Unlock Deck
Unlock for access to all 214 flashcards in this deck.
Unlock Deck
k this deck
10
If aggregate demand grows faster than aggregate supply,the equilibrium price level will rise.
Unlock Deck
Unlock for access to all 214 flashcards in this deck.
Unlock Deck
k this deck
11
Demand-side inflation is usually accompanied by increasing real GDP,while supply-side inflation is usually accompanied by falling real GDP.
Unlock Deck
Unlock for access to all 214 flashcards in this deck.
Unlock Deck
k this deck
12
The Phillips curve explains the trade-off between inflation and unemployment.
Unlock Deck
Unlock for access to all 214 flashcards in this deck.
Unlock Deck
k this deck
13
In December of 2007,with an unemployment rate of 5.0 percent,most economists believed this was above the natural rate.
Unlock Deck
Unlock for access to all 214 flashcards in this deck.
Unlock Deck
k this deck
14
An economy eliminates a recessionary gap by reducing wages and prices.
Unlock Deck
Unlock for access to all 214 flashcards in this deck.
Unlock Deck
k this deck
15
Supply-side inflation will increase the price level and reduce real GDP.
Unlock Deck
Unlock for access to all 214 flashcards in this deck.
Unlock Deck
k this deck
16
In 2010 the U.S.economy's inflation rate was higher than its unemployment rate.
Unlock Deck
Unlock for access to all 214 flashcards in this deck.
Unlock Deck
k this deck
17
If the U.S.economy had grown faster than it actually did from 2009 to 2010,the unemployment rate would have been higher.
Unlock Deck
Unlock for access to all 214 flashcards in this deck.
Unlock Deck
k this deck
18
The natural rate of unemployment corresponds to what is sometimes called the full employment unemployment rate.
Unlock Deck
Unlock for access to all 214 flashcards in this deck.
Unlock Deck
k this deck
19
The U.S.economy in the 1990s benefited from an aggregate supply curve shifting outward.
Unlock Deck
Unlock for access to all 214 flashcards in this deck.
Unlock Deck
k this deck
20
The Phillips curve assumes that shocks to the economy come from the demand side.
Unlock Deck
Unlock for access to all 214 flashcards in this deck.
Unlock Deck
k this deck
21
The rational expectations hypothesis is impeccably logical,but inconsistent with the facts.
Unlock Deck
Unlock for access to all 214 flashcards in this deck.
Unlock Deck
k this deck
22
To make rational forecasts,your predictions do not have to be correct all of the time.
Unlock Deck
Unlock for access to all 214 flashcards in this deck.
Unlock Deck
k this deck
23
One explanation for the increase in the natural rate of unemployment in 2010 was a mismatch between the skills of the American labor force and the skills that the modern job market demanded.
Unlock Deck
Unlock for access to all 214 flashcards in this deck.
Unlock Deck
k this deck
24
If rational expectations are assumed,inflation can be reduced with no corresponding increase in unemployment.
Unlock Deck
Unlock for access to all 214 flashcards in this deck.
Unlock Deck
k this deck
25
Most economists and policy makers decided in 2007-2010 that reducing unemployment was the main national priority.
Unlock Deck
Unlock for access to all 214 flashcards in this deck.
Unlock Deck
k this deck
26
If the short-run Phillips curve is fairly horizontal,attempts to fight inflation will generate considerable unemployment.
Unlock Deck
Unlock for access to all 214 flashcards in this deck.
Unlock Deck
k this deck
27
Keynesian economists generally agree that unemployment is more costly than inflation.
Unlock Deck
Unlock for access to all 214 flashcards in this deck.
Unlock Deck
k this deck
28
Inflation targeting requires monetary policy makers to rely heavily on the Phillips curve.
Unlock Deck
Unlock for access to all 214 flashcards in this deck.
Unlock Deck
k this deck
29
Workers expecting inflation will expect wage increases to be built into their wage contracts.
Unlock Deck
Unlock for access to all 214 flashcards in this deck.
Unlock Deck
k this deck
30
An increase in aggregate demand will reduce the unemployment rate only if the ensuing inflation is anticipated.
Unlock Deck
Unlock for access to all 214 flashcards in this deck.
Unlock Deck
k this deck
31
Monetarists typically favor strong policy measures to fight recession.
Unlock Deck
Unlock for access to all 214 flashcards in this deck.
Unlock Deck
k this deck
32
An example of indexing is a "cost of living" adjustment clause in a wage contract.
Unlock Deck
Unlock for access to all 214 flashcards in this deck.
Unlock Deck
k this deck
33
The aggregate supply curve slopes upward when the real wage falls initially as the price level rises.
Unlock Deck
Unlock for access to all 214 flashcards in this deck.
Unlock Deck
k this deck
34
The rational expectations theory claims that workers and firms will not make systematic errors when they forecast inflation.
Unlock Deck
Unlock for access to all 214 flashcards in this deck.
Unlock Deck
k this deck
35
If expectations are rational,the difference between the actual rate of inflation and the expected rate of inflation will be zero.
Unlock Deck
Unlock for access to all 214 flashcards in this deck.
Unlock Deck
k this deck
36
Fiscal and monetary policy can reduce unemployment with no negative side effects.
Unlock Deck
Unlock for access to all 214 flashcards in this deck.
Unlock Deck
k this deck
37
If nominal wages increase at the same rate as inflation,then the aggregate supply curve will be a horizontal line.
Unlock Deck
Unlock for access to all 214 flashcards in this deck.
Unlock Deck
k this deck
38
The government can fight inflation by manipulating both aggregate demand and aggregate supply.
Unlock Deck
Unlock for access to all 214 flashcards in this deck.
Unlock Deck
k this deck
39
According to rational expectations theory,a long period of unemployment is necessary to reduce inflation.
Unlock Deck
Unlock for access to all 214 flashcards in this deck.
Unlock Deck
k this deck
40
European governments accepted prolonged periods of unemployment in the 1990s in order to reduce inflation.
Unlock Deck
Unlock for access to all 214 flashcards in this deck.
Unlock Deck
k this deck
41
What is the crucial difference between inflation generated on the demand side versus inflation generated on the supply side?
A) Demand-side inflation is short-lived, while supply-side inflation lasts for a long time.
B) Demand-side inflation leads to budget surpluses, while supply-side inflation contributes to budget deficits.
C) Supply-side inflation is subject to control of policy makers, while demand-side inflation is beyond their reach.
D) Demand-side inflation is normally accompanied by rising real GDP, while supply-side inflation may be accompanied by falling real GDP.
Unlock Deck
Unlock for access to all 214 flashcards in this deck.
Unlock Deck
k this deck
42
Figure 17-3
Given the situation in graph (1)in Figure 17-3,what can be expected to change in graph (1)when the economy's self-correcting mechanism operates?
A) aggregate demand increases
B) aggregate demand decreases
C) aggregate supply increases
D) aggregate supply decreases
Given the situation in graph (1)in Figure 17-3,what can be expected to change in graph (1)when the economy's self-correcting mechanism operates?
A) aggregate demand increases
B) aggregate demand decreases
C) aggregate supply increases
D) aggregate supply decreases
Unlock Deck
Unlock for access to all 214 flashcards in this deck.
Unlock Deck
k this deck
43
Demand-side inflation differs from supply-side inflation in the following way:
A) demand-side inflation has higher output; supply-side inflation has lower output.
B) demand-side inflation has lower output; supply-side inflation has higher output.
C) demand-side inflation is always followed by stagflation; supply-side inflation is always followed by demand-side inflation.
D) demand-side inflation has a self-correcting mechanism; supply-side inflation does not.
Unlock Deck
Unlock for access to all 214 flashcards in this deck.
Unlock Deck
k this deck
44
Figure 17-2
Given the situation in graph (1)in Figure 17-2,what action could be expected from the economy's self-correcting mechanism?
A) an increase in aggregate demand
B) a decrease in aggregate demand
C) an increase in aggregate supply
D) a decrease in aggregate supply
Given the situation in graph (1)in Figure 17-2,what action could be expected from the economy's self-correcting mechanism?
A) an increase in aggregate demand
B) a decrease in aggregate demand
C) an increase in aggregate supply
D) a decrease in aggregate supply
Unlock Deck
Unlock for access to all 214 flashcards in this deck.
Unlock Deck
k this deck
45
A decrease in the price of foreign oil will affect the U.S.economy by
A) increasing aggregate demand.
B) decreasing aggregate demand.
C) increasing aggregate supply.
D) decreasing aggregate supply.
A) increasing aggregate demand.
B) decreasing aggregate demand.
C) increasing aggregate supply.
D) decreasing aggregate supply.
Unlock Deck
Unlock for access to all 214 flashcards in this deck.
Unlock Deck
k this deck
46
The economy's self-correcting mechanism
A) tends to push unemployment toward a specific point called the natural rate of unemployment.
B) works better at correcting inflationary gaps than recessionary gaps.
C) cannot work if the Phillips curve is vertical.
D) ensures that the economy will not have to endure a long period of high unemployment.
Unlock Deck
Unlock for access to all 214 flashcards in this deck.
Unlock Deck
k this deck
47
An increase in AD will trigger more inflation under which of the following conditions?
A) AD is relatively steep.
B) AD is relatively flat.
C) AS is relatively steep.
D) AS is relatively flat.
A) AD is relatively steep.
B) AD is relatively flat.
C) AS is relatively steep.
D) AS is relatively flat.
Unlock Deck
Unlock for access to all 214 flashcards in this deck.
Unlock Deck
k this deck
48
A reduction in aggregate demand will normally reduce
A) prices.
B) real GDP.
C) employment.
D) All of the above are correct.
A) prices.
B) real GDP.
C) employment.
D) All of the above are correct.
Unlock Deck
Unlock for access to all 214 flashcards in this deck.
Unlock Deck
k this deck
49
A decrease in AS will trigger more inflation under which of the following conditions?
A) AD is relatively steep.
B) AD is relatively flat.
C) AS is relatively steep.
D) AS is relatively flat.
A) AD is relatively steep.
B) AD is relatively flat.
C) AS is relatively steep.
D) AS is relatively flat.
Unlock Deck
Unlock for access to all 214 flashcards in this deck.
Unlock Deck
k this deck
50
Which of the following could trigger demand-side inflation?
A) a decrease in the money supply
B) an increase in taxes
C) an increase in government spending
D) an increase in interest rates
A) a decrease in the money supply
B) an increase in taxes
C) an increase in government spending
D) an increase in interest rates
Unlock Deck
Unlock for access to all 214 flashcards in this deck.
Unlock Deck
k this deck
51
Figure 17-1
Which of the following is t about the economy depicted in Figure 17-1?
A) Tax incentives are being used to stimulate aggregate supply.
B) Policy makers believe the costs of unemployment are higher than the costs of inflation.
C) Contractionary monetary policy is being enacted to fight inflation.
D) Prices are rising but real GDP is falling.
Unlock Deck
Unlock for access to all 214 flashcards in this deck.
Unlock Deck
k this deck
52
Figure 17-2
Given the situation in graph (1)in Figure 17-2,what movement would be expected in graph (2)from the economy's self-correcting mechanism?
A) A to B
B) A to D
C) C to E
D) D to C
Given the situation in graph (1)in Figure 17-2,what movement would be expected in graph (2)from the economy's self-correcting mechanism?
A) A to B
B) A to D
C) C to E
D) D to C
Unlock Deck
Unlock for access to all 214 flashcards in this deck.
Unlock Deck
k this deck
53
If economic fluctuations originate on the supply side,
A) there will be no relationship between unemployment and inflation.
B) real wage increases will be necessary to eliminate unemployment.
C) inflation and unemployment will be negatively related.
D) inflation and unemployment will be positively related.
A) there will be no relationship between unemployment and inflation.
B) real wage increases will be necessary to eliminate unemployment.
C) inflation and unemployment will be negatively related.
D) inflation and unemployment will be positively related.
Unlock Deck
Unlock for access to all 214 flashcards in this deck.
Unlock Deck
k this deck
54
Figure 17-1
Which of the following is t about the economy depicted in Figure 17-1?
A) It is experiencing supply-side inflation.
B) Policy makers have chosen to fight inflation rather than unemployment.
C) The increase in aggregate demand has increased prices but not real GDP.
D) The slope of the aggregate supply curve embodies the trade-off between unemployment and inflation.
Unlock Deck
Unlock for access to all 214 flashcards in this deck.
Unlock Deck
k this deck
55
An increase in AD will trigger less inflation under which of the following conditions?
A) AD is relatively steep.
B) AD is relatively flat.
C) AS is relatively steep.
D) AS is relatively flat.
A) AD is relatively steep.
B) AD is relatively flat.
C) AS is relatively steep.
D) AS is relatively flat.
Unlock Deck
Unlock for access to all 214 flashcards in this deck.
Unlock Deck
k this deck
56
Which of the following could trigger supply-side inflation?
A) a decrease in the wage rate for all workers
B) an increase in raw materials' prices
C) an increase in productivity of capital
D) an increase in the labor force
A) a decrease in the wage rate for all workers
B) an increase in raw materials' prices
C) an increase in productivity of capital
D) an increase in the labor force
Unlock Deck
Unlock for access to all 214 flashcards in this deck.
Unlock Deck
k this deck
57
Figure 17-3
Given the situation in graph (1)in Figure 17-3,what movement would be expected in graph (2)from the economy's self-correcting mechanism?
A) A to B
B) A to D
C) C to E
D) D to C
Given the situation in graph (1)in Figure 17-3,what movement would be expected in graph (2)from the economy's self-correcting mechanism?
A) A to B
B) A to D
C) C to E
D) D to C
Unlock Deck
Unlock for access to all 214 flashcards in this deck.
Unlock Deck
k this deck
58
The economy's self-correcting mechanism to eliminate a recessionary gap relies on
A) falling interest rates that shift the aggregate demand curve outward.
B) falling wage rates that shift the aggregate supply curve outward.
C) rising wage rates that shift the aggregate supply curve inward.
D) increases in the price level that shift the aggregate supply curve inward.
A) falling interest rates that shift the aggregate demand curve outward.
B) falling wage rates that shift the aggregate supply curve outward.
C) rising wage rates that shift the aggregate supply curve inward.
D) increases in the price level that shift the aggregate supply curve inward.
Unlock Deck
Unlock for access to all 214 flashcards in this deck.
Unlock Deck
k this deck
59
A decrease in AS will trigger less inflation under which of the following conditions?
A) AD is relatively steep.
B) AD is relatively flat.
C) AS is relatively steep.
D) AS is relatively flat.
A) AD is relatively steep.
B) AD is relatively flat.
C) AS is relatively steep.
D) AS is relatively flat.
Unlock Deck
Unlock for access to all 214 flashcards in this deck.
Unlock Deck
k this deck
60
Stagflation can be defined as a situation characterized by
A) rising prices and rising output.
B) rising prices and falling output.
C) falling prices and falling output.
D) falling prices and rising output.
A) rising prices and rising output.
B) rising prices and falling output.
C) falling prices and falling output.
D) falling prices and rising output.
Unlock Deck
Unlock for access to all 214 flashcards in this deck.
Unlock Deck
k this deck
61
Which of the following is most likely to result in unemployment?
A) Aggregate demand grows more rapidly than aggregate supply.
B) Aggregate demand and aggregate supply grow at the same rate.
C) Aggregate supply grows more rapidly than aggregate demand.
D) Neither aggregate demand nor aggregate supply grows at all.
A) Aggregate demand grows more rapidly than aggregate supply.
B) Aggregate demand and aggregate supply grow at the same rate.
C) Aggregate supply grows more rapidly than aggregate demand.
D) Neither aggregate demand nor aggregate supply grows at all.
Unlock Deck
Unlock for access to all 214 flashcards in this deck.
Unlock Deck
k this deck
62
If the fluctuations in the economy's real growth rate from year to year are caused primarily by variations in the rate at which aggregate demand increases,then data would show the
A) worst recession occurs when output expands most rapidly.
B) slowest inflation occurs when output expands most rapidly.
C) slowest economic growth occurs when output grows most rapidly.
D) most rapid inflation occurs when output expands most rapidly.
A) worst recession occurs when output expands most rapidly.
B) slowest inflation occurs when output expands most rapidly.
C) slowest economic growth occurs when output grows most rapidly.
D) most rapid inflation occurs when output expands most rapidly.
Unlock Deck
Unlock for access to all 214 flashcards in this deck.
Unlock Deck
k this deck
63
A study of the U.S.price level and real GDP from 1972 to 2007 reveals a clear upward march toward higher prices and greater output.What explains this?
A) Both the aggregate demand curve and the aggregate supply curve have shifted to the left year after year.
B) Both the aggregate demand curve and the aggregate supply curve have shifted to the right year after year.
C) The aggregate supply curve has shifted to the right while the aggregate demand curve has shifted to the left.
D) The aggregate supply curve has shifted to the left while the aggregate demand curve has shifted to the right.
Unlock Deck
Unlock for access to all 214 flashcards in this deck.
Unlock Deck
k this deck
64
Aggregate supply tends to grow because
A) there are more workers in the economy every year.
B) there is more capital in the economy every year.
C) technology tends to improve every year.
D) All of the above are correct.
A) there are more workers in the economy every year.
B) there is more capital in the economy every year.
C) technology tends to improve every year.
D) All of the above are correct.
Unlock Deck
Unlock for access to all 214 flashcards in this deck.
Unlock Deck
k this deck
65
If the fluctuations in the economy's real growth rate from year to year are caused primarily by variations in the rate at which aggregate demand increases,then data would show
A) a cyclical relationship between inflation and unemployment.
B) a direct relationship between inflation and unemployment.
C) an inverse relationship between inflation and unemployment.
D) no relationship between inflation and unemployment.
A) a cyclical relationship between inflation and unemployment.
B) a direct relationship between inflation and unemployment.
C) an inverse relationship between inflation and unemployment.
D) no relationship between inflation and unemployment.
Unlock Deck
Unlock for access to all 214 flashcards in this deck.
Unlock Deck
k this deck
66
If AD increases at a faster rate than AS,the result will be
A) demand-side inflation.
B) supply-side inflation.
C) falling prices.
D) stable prices.
A) demand-side inflation.
B) supply-side inflation.
C) falling prices.
D) stable prices.
Unlock Deck
Unlock for access to all 214 flashcards in this deck.
Unlock Deck
k this deck
67
Which of the following observations concerning the Phillips curve is not t?
A) They are normally upward-sloping.
B) They are more commonly constructed for price inflation.
C) They depict the inverse relation between wage inflation and unemployment.
D) They depict the rate of unemployment on the horizontal axis.
A) They are normally upward-sloping.
B) They are more commonly constructed for price inflation.
C) They depict the inverse relation between wage inflation and unemployment.
D) They depict the rate of unemployment on the horizontal axis.
Unlock Deck
Unlock for access to all 214 flashcards in this deck.
Unlock Deck
k this deck
68
During the 1960s and early 1970s,economists believed that the Phillips curve indicated
A) that higher inflation was the price for more unemployment.
B) that higher levels of employment could be achieved with lower inflation.
C) a menu of choices for policy makers.
D) All of the above are correct.
A) that higher inflation was the price for more unemployment.
B) that higher levels of employment could be achieved with lower inflation.
C) a menu of choices for policy makers.
D) All of the above are correct.
Unlock Deck
Unlock for access to all 214 flashcards in this deck.
Unlock Deck
k this deck
69
If AS increases at a faster rate than AD,the result will be
A) demand-side inflation.
B) supply-side inflation.
C) falling prices.
D) stable prices.
A) demand-side inflation.
B) supply-side inflation.
C) falling prices.
D) stable prices.
Unlock Deck
Unlock for access to all 214 flashcards in this deck.
Unlock Deck
k this deck
70
A movement from an upper point to a lower point on the Phillips curve shows
A) decrease in the inflation and decrease in the unemployment.
B) increase in the inflation and decrease in the employment.
C) increase in the inflation and increase in the employment.
D) decrease in the inflation and increase in the unemployment.
A) decrease in the inflation and decrease in the unemployment.
B) increase in the inflation and decrease in the employment.
C) increase in the inflation and increase in the employment.
D) decrease in the inflation and increase in the unemployment.
Unlock Deck
Unlock for access to all 214 flashcards in this deck.
Unlock Deck
k this deck
71
If AD and AS increase at exactly the same rate,the result will be
A) demand-side inflation.
B) supply-side inflation.
C) falling prices.
D) stable prices.
A) demand-side inflation.
B) supply-side inflation.
C) falling prices.
D) stable prices.
Unlock Deck
Unlock for access to all 214 flashcards in this deck.
Unlock Deck
k this deck
72
If aggregate demand had grown faster than it did from 2009 to 2010,then the U.S.economy would have experienced
A) higher unemployment and higher inflation.
B) lower unemployment and lower inflation.
C) higher unemployment and lower inflation.
D) lower unemployment and higher inflation.
A) higher unemployment and higher inflation.
B) lower unemployment and lower inflation.
C) higher unemployment and lower inflation.
D) lower unemployment and higher inflation.
Unlock Deck
Unlock for access to all 214 flashcards in this deck.
Unlock Deck
k this deck
73
Aggregate demand grows because
A) patent laws protect and stimulate new inventions.
B) there is more machinery and technology improves.
C) the government increases its spending, a growing population increases consumer spending, and the Fed increases the money supply.
D) All of the above are correct.
A) patent laws protect and stimulate new inventions.
B) there is more machinery and technology improves.
C) the government increases its spending, a growing population increases consumer spending, and the Fed increases the money supply.
D) All of the above are correct.
Unlock Deck
Unlock for access to all 214 flashcards in this deck.
Unlock Deck
k this deck
74
As a generalization,it can be said that
A) aggregate demand shifts to the right every year, but aggregate supply rarely does.
B) aggregate supply shifts to the right every year, but aggregate demand rarely does.
C) both aggregate demand and aggregate supply shift to the right each year.
D) neither aggregate demand nor aggregate supply curve shifts to the right each year.
Unlock Deck
Unlock for access to all 214 flashcards in this deck.
Unlock Deck
k this deck
75
If the fluctuations in the economy's real growth rate from year to year are caused primarily by variations in the rate at which aggregate supply increases,then data would show
A) a cyclical relationship between inflation and unemployment.
B) a direct relationship between inflation and unemployment.
C) an inverse relationship between inflation and unemployment.
D) no relationship between inflation and unemployment.
A) a cyclical relationship between inflation and unemployment.
B) a direct relationship between inflation and unemployment.
C) an inverse relationship between inflation and unemployment.
D) no relationship between inflation and unemployment.
Unlock Deck
Unlock for access to all 214 flashcards in this deck.
Unlock Deck
k this deck
76
If aggregate demand in the U.S.had grown more slowly than it actually did in 2010,the
A) unemployment rate would have been even lower.
B) inflation rate would have been even lower.
C) unemployment rate would have been the same.
D) economy would have grown faster.
A) unemployment rate would have been even lower.
B) inflation rate would have been even lower.
C) unemployment rate would have been the same.
D) economy would have grown faster.
Unlock Deck
Unlock for access to all 214 flashcards in this deck.
Unlock Deck
k this deck
77
The Phillips curve shows the relationship between
A) the rate of inflation and the rate of unemployment.
B) the rate of growth of real GDP and the rate of unemployment.
C) real prices and real GDP.
D) the rate of inflation and the rate of growth of real GDP.
A) the rate of inflation and the rate of unemployment.
B) the rate of growth of real GDP and the rate of unemployment.
C) real prices and real GDP.
D) the rate of inflation and the rate of growth of real GDP.
Unlock Deck
Unlock for access to all 214 flashcards in this deck.
Unlock Deck
k this deck
78
On the vertical axis,the Phillips curve depicts the
A) the rate of unemployment.
B) rate of inflation.
C) rate of growth of nominal GDP.
D) rate of growth of real GDP.
A) the rate of unemployment.
B) rate of inflation.
C) rate of growth of nominal GDP.
D) rate of growth of real GDP.
Unlock Deck
Unlock for access to all 214 flashcards in this deck.
Unlock Deck
k this deck
79
A scatter diagram of the position of the U.S.economy from 1972 through 2007 with the price level on the vertical axis and real GDP on the horizontal axis would show a movement generally toward the
A) northwest.
B) northeast.
C) southwest.
D) southeast.
A) northwest.
B) northeast.
C) southwest.
D) southeast.
Unlock Deck
Unlock for access to all 214 flashcards in this deck.
Unlock Deck
k this deck
80
The unemployment rate for the U.S.economy in 2010 averaged about
A) 10 percent.
B) 8 percent.
C) 4 percent.
D) 2 percent.
A) 10 percent.
B) 8 percent.
C) 4 percent.
D) 2 percent.
Unlock Deck
Unlock for access to all 214 flashcards in this deck.
Unlock Deck
k this deck
Unlock Deck
Unlock for access to all 214 flashcards in this deck.


