Deck 9: Inference for Regression
Full screen (f)
Question
Use the following to answer the questions below:
Computer output from a regression analysis is provided.
The regression equation is Y = 72.9 - 0.519 X
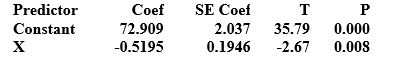
-What is the sample slope for this model?
A) 72.909
B) 2.037
C) -0.5195
D) 0.1946
Computer output from a regression analysis is provided.
The regression equation is Y = 72.9 - 0.519 X
-What is the sample slope for this model?
A) 72.909
B) 2.037
C) -0.5195
D) 0.1946
Question
Use the following to answer the questions below:
Computer output from a regression analysis is provided.
The regression equation is Y = 72.9 - 0.519 X
-What is the sample intercept for this model?
A) 72.909
B) 2.037
C) -0.5195
D) 0.1946
Computer output from a regression analysis is provided.
The regression equation is Y = 72.9 - 0.519 X
-What is the sample intercept for this model?
A) 72.909
B) 2.037
C) -0.5195
D) 0.1946
Question
Use the following to answer the questions below:
Computer output from a regression analysis is provided.
The regression equation is Y = 72.9 - 0.519 X
-What is the standard error of the sample slope?
A) 72.909
B) 2.037
C) -0.519
D) 0.1946
Computer output from a regression analysis is provided.
The regression equation is Y = 72.9 - 0.519 X
-What is the standard error of the sample slope?
A) 72.909
B) 2.037
C) -0.519
D) 0.1946
Question
Use the following to answer the questions below:
Computer output from a regression analysis is provided.
The regression equation is Y = 72.9 - 0.519 X
-What is the p-value for testing if the slope in the population is different from zero?
A) 0.5195
B) 0.1946
C) p < 0.001
D) 0.008
Computer output from a regression analysis is provided.
The regression equation is Y = 72.9 - 0.519 X
-What is the p-value for testing if the slope in the population is different from zero?
A) 0.5195
B) 0.1946
C) p < 0.001
D) 0.008
Question
Use the following to answer the questions below:
Computer output from a regression analysis is provided.
The regression equation is Y = 72.9 - 0.519 X
-The sample size in this situation is n = 157. What are the degrees of freedom for constructing a confidence interval for, or performing a test about, the population slope?
A) 157
B) 156
C) 155
D) 153
Question
Use the following to answer the questions below:
Computer output from a regression analysis is provided.
The regression equation is Y = 72.9 - 0.519 X
-The sample size in this situation is n = 157. Construct a 95% confidence interval for the population slope. Round the margin of error to four decimal places.
A) -0.9038 to -0.1352
B) -0.9009 to -0.1381
C) -0.8976 to -0.1414
D) -0.9138 to -0.1252
Question
Use the following to answer the questions below:
Computer output from a regression analysis is provided.
The regression equation is Y = 72.9 - 0.519 X
-Use the p-value for testing if the slope in the population is different from zero (and a 5% significance level) to make a clear conclusion about the effectiveness of the model.
A) p-value = 0.008 There is very strong evidence that the population slope differs from zero, and thus is an effective model for predicting this response variable.
B) p-value = 0.008 There is not enough evidence that the population slope differs from zero, and thus this is not an effective model for predicting this response variable.
Question
Use the following to answer the questions below:
Computer output from a regression analysis is provided.
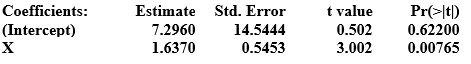
-What is the sample slope for this model?
A) 1.6370
B) 0.5453
C) 7.2960
D) 14.5444
Computer output from a regression analysis is provided.
-What is the sample slope for this model?
A) 1.6370
B) 0.5453
C) 7.2960
D) 14.5444
Question
Use the following to answer the questions below:
Computer output from a regression analysis is provided.
-What is the sample intercept for this model?
A) 1.6370
B) 0.5453
C) 7.2960
D) 14.5444
Computer output from a regression analysis is provided.
-What is the sample intercept for this model?
A) 1.6370
B) 0.5453
C) 7.2960
D) 14.5444
Question
Use the following to answer the questions below:
Computer output from a regression analysis is provided.
-What is the standard error of the sample slope?
A) 1.6370
B) 0.5453
C) 7.2960
D) 14.5444
Computer output from a regression analysis is provided.
-What is the standard error of the sample slope?
A) 1.6370
B) 0.5453
C) 7.2960
D) 14.5444
Question
Use the following to answer the questions below:
Computer output from a regression analysis is provided.
-What is the p-value for testing if the slope in the population is different from zero?
A) 0.502
B) 0.622
C) 0.5453
D) 0.00765
Computer output from a regression analysis is provided.
-What is the p-value for testing if the slope in the population is different from zero?
A) 0.502
B) 0.622
C) 0.5453
D) 0.00765
Question
Use the following to answer the questions below:
Computer output from a regression analysis is provided.
-The sample size in this situation is n = 20. What are the degrees of freedom for constructing a confidence interval, or performing a test about, the population slope?
A) 17
B) 18
C) 19
D) 20
Computer output from a regression analysis is provided.
-The sample size in this situation is n = 20. What are the degrees of freedom for constructing a confidence interval, or performing a test about, the population slope?
A) 17
B) 18
C) 19
D) 20
Question
Use the following to answer the questions below:
Computer output from a regression analysis is provided.
-The sample size in this situation is n = 20. Construct a 95% confidence interval for the population slope. Round the margin of error to three decimal places.
A) 0.491 to 2.783
B) 0.568 to 2.706
C) 0.578 to 2.697
D) 0.5327 to 2.741
Computer output from a regression analysis is provided.
-The sample size in this situation is n = 20. Construct a 95% confidence interval for the population slope. Round the margin of error to three decimal places.
A) 0.491 to 2.783
B) 0.568 to 2.706
C) 0.578 to 2.697
D) 0.5327 to 2.741
Question
Use the following to answer the questions below:
Computer output from a regression analysis is provided.
-Use the p-value for testing if the slope in the population is different from zero (and a 5% significance level) to make a clear conclusion about the effectiveness of the model.
A) p-value = 0.00765
There is very strong evidence that the population slope differs from zero, and thus is an effective model for predicting this response variable.
B) p-value = 0.00765
There is not enough evidence that the population slope differs from zero, and thus is not an effective model for predicting this response variable.
Question
The website for the Quantitative Environmental Learning Project (funded by the National Science Foundation) describes data they collected on the lengths and widths of Puget Sound Butter Clams. A scatterplot of the data (with the regression line) is provided.
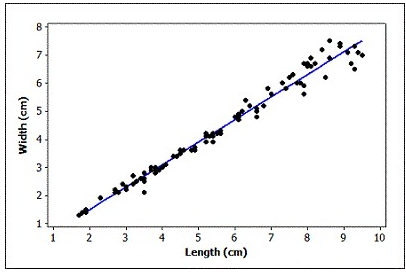
Use the scatterplot to check each of the conditions for using a linear model with this data. Is using a linear model appropriate for these data?
Use the scatterplot to check each of the conditions for using a linear model with this data. Is using a linear model appropriate for these data?
Question
Question
Question
Question
Use the following to answer the questions below:
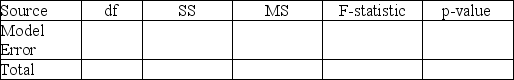
In a regression analysis based on a sample of size n = 30, SSModel = 750 and SSTotal = 2,500.
-Use this information to fill in all values in an analysis of variance table as shown.

In a regression analysis based on a sample of size n = 30, SSModel = 750 and SSTotal = 2,500.
-Use this information to fill in all values in an analysis of variance table as shown.
Question
Use the following to answer the questions below:
In a regression analysis based on a sample of size n = 30, SSModel = 750 and SSTotal = 2,500.
-Compute .
.
A) 30%
B) 83%
C) 1.2%
D) 5.5%
In a regression analysis based on a sample of size n = 30, SSModel = 750 and SSTotal = 2,500.
-Compute
.A) 30%
B) 83%
C) 1.2%
D) 5.5%
Question
Question
Use the following to answer the questions below:
In a regression analysis with n = 25, SSE = 1,800 and SSTotal = 2,000.
-Use this information to fill in all values in an analysis of variance table as shown. Round decimal answers to three decimal places.
In a regression analysis with n = 25, SSE = 1,800 and SSTotal = 2,000.
-Use this information to fill in all values in an analysis of variance table as shown. Round decimal answers to three decimal places.
Question
Use the following to answer the questions below:
In a regression analysis with n = 25, SSE = 1,800 and SSTotal = 2,000.
-Compute .
.
A) 10%
B) 0.10%
C) 11%
D) 0.11%
In a regression analysis with n = 25, SSE = 1,800 and SSTotal = 2,000.
-Compute
.A) 10%
B) 0.10%
C) 11%
D) 0.11%
Question
Question
Use the following to answer the questions below:
Students in a small statistics course wanted to investigate if forearm length (in cm) was useful for predicting foot length (in cm). The data they collected are displayed in the provided scatterplot (with regression), and the computer output from the analysis is provided.
Use three decimal places when reporting the results from any calculations, unless otherwise specified.
?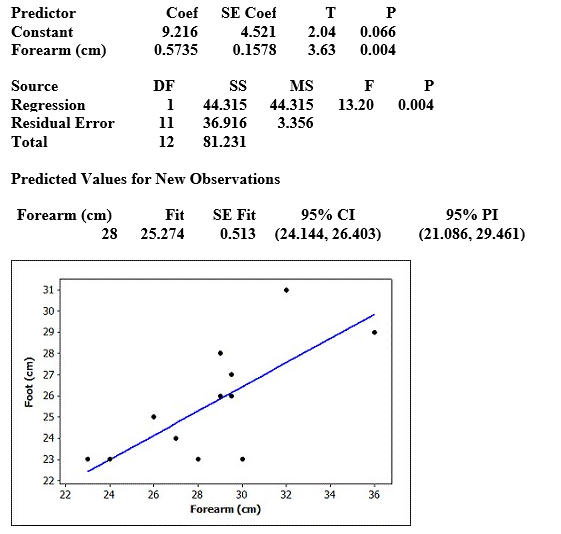
The regression equation is Foot (cm) = 9.22 + 0.574 Forearm (cm)
-Consider the scatterplot. Should we have any significant concerns about the conditions being met for using a linear model with these data?
Question
Use the following to answer the questions below:
Students in a small statistics course wanted to investigate if forearm length (in cm) was useful for predicting foot length (in cm). The data they collected are displayed in the provided scatterplot (with regression), and the computer output from the analysis is provided.
Use three decimal places when reporting the results from any calculations, unless otherwise specified.
?
The regression equation is Foot (cm) = 9.22 + 0.574 Forearm (cm)
-Use the fitted model to predict the foot length for someone whose arm is 30 cm long. Report your answer with two decimal places.
A) 26.44 cm
B) 25.89 cm
C) 26.12 cm
D) 25.73 cm
Question
Use the following to answer the questions below:
Students in a small statistics course wanted to investigate if forearm length (in cm) was useful for predicting foot length (in cm). The data they collected are displayed in the provided scatterplot (with regression), and the computer output from the analysis is provided.
Use three decimal places when reporting the results from any calculations, unless otherwise specified.
?
The regression equation is Foot (cm) = 9.22 + 0.574 Forearm (cm)
-What is the estimated slope in this regression model?
A) 0.574
B) 9.22
C) 0.5735
D) 9.216
Question
Use the following to answer the questions below:
Students in a small statistics course wanted to investigate if forearm length (in cm) was useful for predicting foot length (in cm). The data they collected are displayed in the provided scatterplot (with regression), and the computer output from the analysis is provided.
Use three decimal places when reporting the results from any calculations, unless otherwise specified.
?
The regression equation is Foot (cm) = 9.22 + 0.574 Forearm (cm)
-What is the test statistic for a test of the slope? What is the p-value? What is the conclusion of the test, in context?
A) t = 3.63; p-value = 0.004
There is strong evidence that forearm length is a useful predictor of foot length.
B) t = 2.04; p-value = 0.066
There is not enough evidence to conclude that forearm length is a useful predictor of foot length.
C) t = 3.63; p-value = 0.004
There is not enough evidence to conclude that forearm length is a useful predictor of foot length.
D) t = 2.04; p-value = 0.066
There is strong evidence that forearm length is a useful predictor of foot length.
Question
Use the following to answer the questions below:
Students in a small statistics course wanted to investigate if forearm length (in cm) was useful for predicting foot length (in cm). The data they collected are displayed in the provided scatterplot (with regression), and the computer output from the analysis is provided.
Use three decimal places when reporting the results from any calculations, unless otherwise specified.
?
The regression equation is Foot (cm) = 9.22 + 0.574 Forearm (cm)
-Use the ANOVA table to determine the overall sample size.
A) 13
B) 12
C) 11
D) 10
Question
Use the following to answer the questions below:
Students in a small statistics course wanted to investigate if forearm length (in cm) was useful for predicting foot length (in cm). The data they collected are displayed in the provided scatterplot (with regression), and the computer output from the analysis is provided.
Use three decimal places when reporting the results from any calculations, unless otherwise specified.
?
The regression equation is Foot (cm) = 9.22 + 0.574 Forearm (cm)
-Construct a 90% confidence interval for the population slope.
A) 0.291 to 0.857
B) 0.265 to 0.883
C) 0.314 to 0.834
D) 0.277 to 0.871
Question
Use the following to answer the questions below:
Students in a small statistics course wanted to investigate if forearm length (in cm) was useful for predicting foot length (in cm). The data they collected are displayed in the provided scatterplot (with regression), and the computer output from the analysis is provided.
Use three decimal places when reporting the results from any calculations, unless otherwise specified.
?
The regression equation is Foot (cm) = 9.22 + 0.574 Forearm (cm)
-Use the ANOVA table to compute and interpret
.
A) 0.546
About 55% of the variability in foot lengths in this sample is explained by the person's forearm length.
B) 0.298
About 30% of the variability in foot lengths in this sample is explained by the person's forearm length.
C) 0.454
About 45% of the variability in foot lengths in this sample is explained by the person's forearm length.
D) 0.206
About 21% of the variability in foot lengths in this sample is explained by the person's forearm length.
Question
Use the following to answer the questions below:
Students in a small statistics course wanted to investigate if forearm length (in cm) was useful for predicting foot length (in cm). The data they collected are displayed in the provided scatterplot (with regression), and the computer output from the analysis is provided.
Use three decimal places when reporting the results from any calculations, unless otherwise specified.
The regression equation is Foot (cm) = 9.22 + 0.574 Forearm (cm)
-The correlation between foot length and forearm length is 0.7389. Compute and interpret for this regression model.
Students in a small statistics course wanted to investigate if forearm length (in cm) was useful for predicting foot length (in cm). The data they collected are displayed in the provided scatterplot (with regression), and the computer output from the analysis is provided.
Use three decimal places when reporting the results from any calculations, unless otherwise specified.
The regression equation is Foot (cm) = 9.22 + 0.574 Forearm (cm)
-The correlation between foot length and forearm length is 0.7389. Compute and interpret
for this regression model. Question
Use the following to answer the questions below:
Students in a small statistics course wanted to investigate if forearm length (in cm) was useful for predicting foot length (in cm). The data they collected are displayed in the provided scatterplot (with regression), and the computer output from the analysis is provided.
Use three decimal places when reporting the results from any calculations, unless otherwise specified.
?
The regression equation is Foot (cm) = 9.22 + 0.574 Forearm (cm)
-Use the ANOVA table to find the standard deviation of the error term. Round your answer to three decimal places.
Question
Use the following to answer the questions below:
Students in a small statistics course wanted to investigate if forearm length (in cm) was useful for predicting foot length (in cm). The data they collected are displayed in the provided scatterplot (with regression), and the computer output from the analysis is provided.
Use three decimal places when reporting the results from any calculations, unless otherwise specified.
The regression equation is Foot (cm) = 9.22 + 0.574 Forearm (cm)
-Based on the output, provide and interpret a 95% confidence interval for the mean foot length for all individuals with a forearm that is 28 cm long.
Question
Use the following to answer the questions below:
Students in a small statistics course wanted to investigate if forearm length (in cm) was useful for predicting foot length (in cm). The data they collected are displayed in the provided scatterplot (with regression), and the computer output from the analysis is provided.
Use three decimal places when reporting the results from any calculations, unless otherwise specified.
The regression equation is Foot (cm) = 9.22 + 0.574 Forearm (cm)
-Based on the output, provide and interpret a 95% prediction interval for the foot length of a specific individual with a forearm that is 28 cm long.
Question
Use the following to answer the questions below:
Students in a small statistics course wanted to investigate if forearm length (in cm) was useful for predicting foot length (in cm). The data they collected are displayed in the provided scatterplot (with regression), and the computer output from the analysis is provided.
Use three decimal places when reporting the results from any calculations, unless otherwise specified.
The regression equation is Foot (cm) = 9.22 + 0.574 Forearm (cm)
-When conducting inference for the population slope, it is most common to test if the population slope is different from zero. However, there are other situations where a different test might be more interesting. For instance, it is often said that the length of the forearm is roughly the same as the length of the foot (see, for example, the movie Pretty Woman). What population slope is implied by this statement, and what would the hypotheses for testing the accuracy of this claim look like?
Question
Use the following to answer the questions below:
Data were collected on GPA and number of Facebook friends for students in a small statistics class. Some summary statistics, partial output from the regression analysis, and a scatterplot of the data (with regression line) are provided. Assume that students in this class are typical of all students at the university.
Use three decimal places when reporting the results from any calculations, unless otherwise specified.
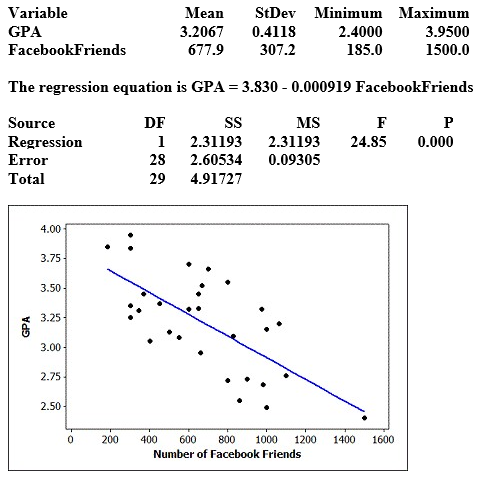
-Use the scatterplot to determine whether we should have any strong concerns about the conditions being met for using a linear model with these data.
Data were collected on GPA and number of Facebook friends for students in a small statistics class. Some summary statistics, partial output from the regression analysis, and a scatterplot of the data (with regression line) are provided. Assume that students in this class are typical of all students at the university.
Use three decimal places when reporting the results from any calculations, unless otherwise specified.
-Use the scatterplot to determine whether we should have any strong concerns about the conditions being met for using a linear model with these data.
Question
Use the following to answer the questions below:
Data were collected on GPA and number of Facebook friends for students in a small statistics class. Some summary statistics, partial output from the regression analysis, and a scatterplot of the data (with regression line) are provided. Assume that students in this class are typical of all students at the university.
Use three decimal places when reporting the results from any calculations, unless otherwise specified.
-Use the equation of the least squares line to predict the GPA for someone with 800 Facebook friends.
A) 3.095
B) 3.830
C) 3.153
D) 3.024
Question
Use the following to answer the questions below:
Data were collected on GPA and number of Facebook friends for students in a small statistics class. Some summary statistics, partial output from the regression analysis, and a scatterplot of the data (with regression line) are provided. Assume that students in this class are typical of all students at the university.
Use three decimal places when reporting the results from any calculations, unless otherwise specified.
-Use the information in the ANOVA table to determine the number of students included in the dataset.
A) 31
B) 30
C) 29
D) 28
Question
Use the following to answer the questions below:
Data were collected on GPA and number of Facebook friends for students in a small statistics class. Some summary statistics, partial output from the regression analysis, and a scatterplot of the data (with regression line) are provided. Assume that students in this class are typical of all students at the university.
Use three decimal places when reporting the results from any calculations, unless otherwise specified.
-Use the information in the ANOVA table to compute and interpret .
.
A) = 0.470
About 47% of the variability in GPA for students in this sample is explained by number of Facebook friends.
B) = 0.686
About 69% of the variability in GPA for students in this sample is explained by number of Facebook friends.
C) = 0.470
About 53% of the variability in GPA for students in this sample is explained by number of Facebook friends.
D) = 0.686
About 31% of the variability in GPA for students in this sample is explained by number of Facebook friends.
Data were collected on GPA and number of Facebook friends for students in a small statistics class. Some summary statistics, partial output from the regression analysis, and a scatterplot of the data (with regression line) are provided. Assume that students in this class are typical of all students at the university.
Use three decimal places when reporting the results from any calculations, unless otherwise specified.
-Use the information in the ANOVA table to compute and interpret
.A)
= 0.470About 47% of the variability in GPA for students in this sample is explained by number of Facebook friends.
B)
= 0.686About 69% of the variability in GPA for students in this sample is explained by number of Facebook friends.
C)
= 0.470About 53% of the variability in GPA for students in this sample is explained by number of Facebook friends.
D)
= 0.686About 31% of the variability in GPA for students in this sample is explained by number of Facebook friends.
Question
Use the following to answer the questions below:
Data were collected on GPA and number of Facebook friends for students in a small statistics class. Some summary statistics, partial output from the regression analysis, and a scatterplot of the data (with regression line) are provided. Assume that students in this class are typical of all students at the university.
Use three decimal places when reporting the results from any calculations, unless otherwise specified.
-Is the linear model effective at predicting GPA? Use the information from the computer output and α = 0.05. Include all details of the test.
Question
Use the following to answer the questions below:
Data were collected on GPA and number of Facebook friends for students in a small statistics class. Some summary statistics, partial output from the regression analysis, and a scatterplot of the data (with regression line) are provided. Assume that students in this class are typical of all students at the university.
Use three decimal places when reporting the results from any calculations, unless otherwise specified.
-Use the information in the computer output to compute the standard deviation of the error term.
A) 0.305
B) 0.093
C) 0.412
D) 0.317
Question
Use the following to answer the questions below:
Data were collected on GPA and number of Facebook friends for students in a small statistics class. Some summary statistics, partial output from the regression analysis, and a scatterplot of the data (with regression line) are provided. Assume that students in this class are typical of all students at the university.
Use three decimal places when reporting the results from any calculations, unless otherwise specified.
-Use the provided output to construct a 90% confidence interval for the mean GPA of all students with 800 Facebook friends.
A) 2.993 to 3.197
B) 2.760 to 3.430
C) 3.035 to 3.155
D) 2.916 to 3.274
Question
Use the following to answer the questions below:
Data were collected on GPA and number of Facebook friends for students in a small statistics class. Some summary statistics, partial output from the regression analysis, and a scatterplot of the data (with regression line) are provided. Assume that students in this class are typical of all students at the university.
Use three decimal places when reporting the results from any calculations, unless otherwise specified.
-Use the provided output to construct a 90% prediction interval for the GPA of a student with 800 Facebook friends.
A) 2.566 to 3.624
B) 1.361 to 4.829
C) 2.784 to 3.406
D) 2.224 to 3.966
Question
Use the following to answer the questions below:
Data were collected on GPA and number of Facebook friends for students in a small statistics class. Some summary statistics, partial output from the regression analysis, and a scatterplot of the data (with regression line) are provided. Assume that students in this class are typical of all students at the university.
Use three decimal places when reporting the results from any calculations, unless otherwise specified.
-Use the following output to identify and interpret a 95% interval for the mean GPA for all students with 500 Facebook friends.
Predicted Values for New Observations

A) CI: (3.2378, 3.5036)
We are 95% sure that the mean GPA for all students with 500 Facebook friends is between 3.2378 and 3.5036.
B) PI: (2.7315, 4.0089)
We are 95% sure that the GPA of a student with 500 Facebook friends is between 2.7315 and 4.0089.
Data were collected on GPA and number of Facebook friends for students in a small statistics class. Some summary statistics, partial output from the regression analysis, and a scatterplot of the data (with regression line) are provided. Assume that students in this class are typical of all students at the university.
Use three decimal places when reporting the results from any calculations, unless otherwise specified.
-Use the following output to identify and interpret a 95% interval for the mean GPA for all students with 500 Facebook friends.
Predicted Values for New Observations
A) CI: (3.2378, 3.5036)
We are 95% sure that the mean GPA for all students with 500 Facebook friends is between 3.2378 and 3.5036.
B) PI: (2.7315, 4.0089)
We are 95% sure that the GPA of a student with 500 Facebook friends is between 2.7315 and 4.0089.
Question
Use the following to answer the questions below:
Data were collected on GPA and number of Facebook friends for students in a small statistics class. Some summary statistics, partial output from the regression analysis, and a scatterplot of the data (with regression line) are provided. Assume that students in this class are typical of all students at the university.
Use three decimal places when reporting the results from any calculations, unless otherwise specified.
-Use the following output to identify and interpret a 95% interval for the GPA of a single student with 500 Facebook friends.
Predicted Values for New Observations

A) PI: (2.7315, 4.0089)
We are 95% sure that the GPA of a student with 500 Facebook friends is between 2.7315 and 4.0089.
B) CI: (3.2378, 3.5036)
We are 95% sure that the mean GPA for all students with 500 Facebook friends is between 3.2378 and 3.5036.
Data were collected on GPA and number of Facebook friends for students in a small statistics class. Some summary statistics, partial output from the regression analysis, and a scatterplot of the data (with regression line) are provided. Assume that students in this class are typical of all students at the university.
Use three decimal places when reporting the results from any calculations, unless otherwise specified.
-Use the following output to identify and interpret a 95% interval for the GPA of a single student with 500 Facebook friends.
Predicted Values for New Observations
A) PI: (2.7315, 4.0089)
We are 95% sure that the GPA of a student with 500 Facebook friends is between 2.7315 and 4.0089.
B) CI: (3.2378, 3.5036)
We are 95% sure that the mean GPA for all students with 500 Facebook friends is between 3.2378 and 3.5036.
Question
Use the following to answer the questions below:
Data were collected on GPA and number of Facebook friends for students in a small statistics class. Some summary statistics, partial output from the regression analysis, and a scatterplot of the data (with regression line) are provided. Assume that students in this class are typical of all students at the university.
Use three decimal places when reporting the results from any calculations, unless otherwise specified.
-The correlation between GPA and number of Facebook friends is -0.686. Use the correlation and α = 0.05 to test for a linear association between GPA and number of Facebook friends. Include all details of the test.
Question
Use the following to answer the questions below:
Data were collected on GPA and number of Facebook friends for students in a small statistics class. Some summary statistics, partial output from the regression analysis, and a scatterplot of the data (with regression line) are provided. Assume that students in this class are typical of all students at the university.
Use three decimal places when reporting the results from any calculations, unless otherwise specified.
-The correlation between GPA and number of Facebook friends is -0.686. Use the correlation and α = 0.05 to test for a negative linear association between GPA and number of Facebook friends. Include all details of the test.
Question
Use the following to answer the questions below:
Data were collected on GPA and number of Facebook friends for students in a small statistics class. Some summary statistics, partial output from the regression analysis, and a scatterplot of the data (with regression line) are provided. Assume that students in this class are typical of all students at the university.
Use three decimal places when reporting the results from any calculations, unless otherwise specified.
-Use the information in the computer output to compute the standard error of the slope, SE. Round the answer to six decimal places.
A) 0.000184
B) 0.000183
C) 0.000992
D) 0.000993
Question
Use the following to answer the questions below:
Data were collected on GPA and number of Facebook friends for students in a small statistics class. Some summary statistics, partial output from the regression analysis, and a scatterplot of the data (with regression line) are provided. Assume that students in this class are typical of all students at the university.
Use three decimal places when reporting the results from any calculations, unless otherwise specified.
-Compute the t test statistic for the slope.
A) -4.989
B) -5.022
C) -5.465
D) - 5.479
Question
Use the following to answer the questions below:
Data were collected on the age (in years) and price (in thousands of dollars) of a random sample of 25 used Hyundai Elantras. A scatterplot of the data (with regression line) and computer output from a regression analysis are provided.
Use three decimal places when reporting the results from any calculations, unless otherwise specified.
The regression equation is Price = 15.3 - 1.71 Age
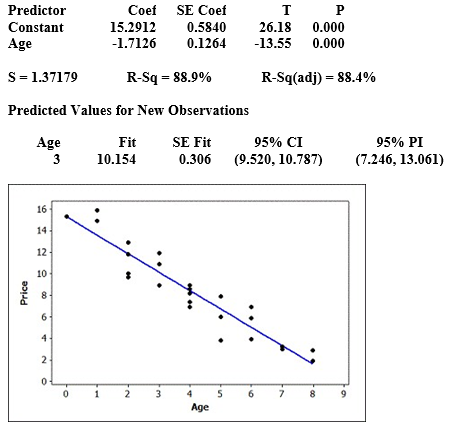
-Use the scatterplot to determine whether we should have any serious concerns about the conditions being met for using a linear model with these data.
Data were collected on the age (in years) and price (in thousands of dollars) of a random sample of 25 used Hyundai Elantras. A scatterplot of the data (with regression line) and computer output from a regression analysis are provided.
Use three decimal places when reporting the results from any calculations, unless otherwise specified.
The regression equation is Price = 15.3 - 1.71 Age
-Use the scatterplot to determine whether we should have any serious concerns about the conditions being met for using a linear model with these data.
Question
Use the following to answer the questions below:
Data were collected on the age (in years) and price (in thousands of dollars) of a random sample of 25 used Hyundai Elantras. A scatterplot of the data (with regression line) and computer output from a regression analysis are provided.
Use three decimal places when reporting the results from any calculations, unless otherwise specified.
The regression equation is Price = 15.3 - 1.71 Age
-What is the estimated slope in this regression model? Interpret the slope in context.
A) The estimated slope is -1.71.
For each additional year of age, the predicted price of the car (used Hyundai Elantra) decreases by $1,710.
B) The estimated slope is -1.71.
For each additional year of age, the predicted price of the car (used Hyundai Elantra) decreases by $1.71.
C) The estimated slope is 15.3.
The cost of a new used Hyundai Elantra is approximately $15,300.
D) The estimated slope is 15.3.
For each additional year of age, the predicted price of the car (used Hyundai Elantra) decreases by $1530.
Question
Use the following to answer the questions below:
Data were collected on the age (in years) and price (in thousands of dollars) of a random sample of 25 used Hyundai Elantras. A scatterplot of the data (with regression line) and computer output from a regression analysis are provided.
Use three decimal places when reporting the results from any calculations, unless otherwise specified.
The regression equation is Price = 15.3 - 1.71 Age
-Use the equation of the least squares line to predict the price of a used Hyundai Elantra that is 6 years old.
A) $5,040
B) $13,540
C) $6,750
D) $7,750
Question
Use the following to answer the questions below:
Data were collected on the age (in years) and price (in thousands of dollars) of a random sample of 25 used Hyundai Elantras. A scatterplot of the data (with regression line) and computer output from a regression analysis are provided.
Use three decimal places when reporting the results from any calculations, unless otherwise specified.
The regression equation is Price = 15.3 - 1.71 Age
-What are the degrees of freedom for constructing a confidence interval for, or performing a test about, the population slope?
A) 25
B) 24
C) 23
D) 22
Question
Use the following to answer the questions below:
Data were collected on the age (in years) and price (in thousands of dollars) of a random sample of 25 used Hyundai Elantras. A scatterplot of the data (with regression line) and computer output from a regression analysis are provided.
Use three decimal places when reporting the results from any calculations, unless otherwise specified.
The regression equation is Price = 15.3 - 1.71 Age
-Use the computer output to test the slope to determine whether age is an effective predictor of price. Use = 0.05.
A) There is very strong evidence that age is an effective predictor of price.
B) There is not enough evidence to conclude that age is an effective predictor of price.
Question
Use the following to answer the questions below:
Data were collected on the age (in years) and price (in thousands of dollars) of a random sample of 25 used Hyundai Elantras. A scatterplot of the data (with regression line) and computer output from a regression analysis are provided.
Use three decimal places when reporting the results from any calculations, unless otherwise specified.
The regression equation is Price = 15.3 - 1.71 Age
-Construct and interpret a 90% confidence interval for the population slope.
Question
Use the following to answer the questions below:
Data were collected on the age (in years) and price (in thousands of dollars) of a random sample of 25 used Hyundai Elantras. A scatterplot of the data (with regression line) and computer output from a regression analysis are provided.
Use three decimal places when reporting the results from any calculations, unless otherwise specified.
The regression equation is Price = 15.3 - 1.71 Age
-What is the for this model? Interpret it in context.
Data were collected on the age (in years) and price (in thousands of dollars) of a random sample of 25 used Hyundai Elantras. A scatterplot of the data (with regression line) and computer output from a regression analysis are provided.
Use three decimal places when reporting the results from any calculations, unless otherwise specified.
The regression equation is Price = 15.3 - 1.71 Age
-What is the
for this model? Interpret it in context. Question
Use the following to answer the questions below:
Data were collected on the age (in years) and price (in thousands of dollars) of a random sample of 25 used Hyundai Elantras. A scatterplot of the data (with regression line) and computer output from a regression analysis are provided.
Use three decimal places when reporting the results from any calculations, unless otherwise specified.
The regression equation is Price = 15.3 - 1.71 Age
-Based on the available information, what is the correlation between age and price (in thousands of dollars) of used Hyundai Elantras?
A) 0.943
B) -0.943
C) 9.43
D) -9.43
Question
Use the following to answer the questions below:
Data were collected on the age (in years) and price (in thousands of dollars) of a random sample of 25 used Hyundai Elantras. A scatterplot of the data (with regression line) and computer output from a regression analysis are provided.
Use three decimal places when reporting the results from any calculations, unless otherwise specified.
The regression equation is Price = 15.3 - 1.71 Age
-Use the computer output to provide and interpret a 95% interval for the mean price of all 3-year-old used Hyundai Elantras.
Question
Use the following to answer the questions below:
Data were collected on the age (in years) and price (in thousands of dollars) of a random sample of 25 used Hyundai Elantras. A scatterplot of the data (with regression line) and computer output from a regression analysis are provided.
Use three decimal places when reporting the results from any calculations, unless otherwise specified.
The regression equation is Price = 15.3 - 1.71 Age
-Use the computer output to provide and interpret a 95% interval for the price of a 3-year-old used Hyundai Elantra.
Question
Use the following to answer the questions below:
Data were collected on the mileage (in thousands of miles) and price (in thousands of dollars) of a random sample of used Hyundai Elantras. A scatterplot of the data (with regression line), some summary statistics, and partial computer output from a regression analysis are provided.
Use three decimal places when reporting the results from any calculations, unless otherwise specified.
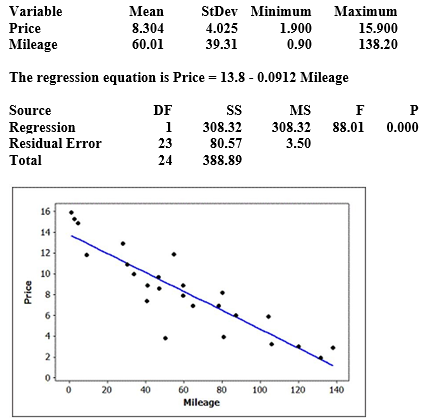
-Use the scatterplot to determine whether we should have any strong concerns about the conditions being met for using a linear model with these data.
Data were collected on the mileage (in thousands of miles) and price (in thousands of dollars) of a random sample of used Hyundai Elantras. A scatterplot of the data (with regression line), some summary statistics, and partial computer output from a regression analysis are provided.
Use three decimal places when reporting the results from any calculations, unless otherwise specified.
-Use the scatterplot to determine whether we should have any strong concerns about the conditions being met for using a linear model with these data.
Question
Use the following to answer the questions below:
Data were collected on the mileage (in thousands of miles) and price (in thousands of dollars) of a random sample of used Hyundai Elantras. A scatterplot of the data (with regression line), some summary statistics, and partial computer output from a regression analysis are provided.
Use three decimal places when reporting the results from any calculations, unless otherwise specified.
-Use the equation of the least squares line to predict the price of a used Hyundai Elantra with 50,000 miles.
A) 9,240
B) $6,900
C) $12,888
D) $13,344
Question
Use the following to answer the questions below:
Data were collected on the mileage (in thousands of miles) and price (in thousands of dollars) of a random sample of used Hyundai Elantras. A scatterplot of the data (with regression line), some summary statistics, and partial computer output from a regression analysis are provided.
Use three decimal places when reporting the results from any calculations, unless otherwise specified.
-Use the provided output to compute
.
A) 0.793
B) 0.672
C) 0.891
D) 0.736
Question
Use the following to answer the questions below:
Data were collected on the mileage (in thousands of miles) and price (in thousands of dollars) of a random sample of used Hyundai Elantras. A scatterplot of the data (with regression line), some summary statistics, and partial computer output from a regression analysis are provided.
Use three decimal places when reporting the results from any calculations, unless otherwise specified.
-Use the information in the ANOVA table to determine the number of cars in the sample.
A) 25
B) 24
C) 23
D) 22
Question
Use the following to answer the questions below:
Data were collected on the mileage (in thousands of miles) and price (in thousands of dollars) of a random sample of used Hyundai Elantras. A scatterplot of the data (with regression line), some summary statistics, and partial computer output from a regression analysis are provided.
Use three decimal places when reporting the results from any calculations, unless otherwise specified.
-Is the linear model effective at predicting the price of used Hyundai Elantras? Use the information from the computer output and α = 0.05. Include all details of the test.
Question
Use the following to answer the questions below:
Data were collected on the mileage (in thousands of miles) and price (in thousands of dollars) of a random sample of used Hyundai Elantras. A scatterplot of the data (with regression line), some summary statistics, and partial computer output from a regression analysis are provided.
Use three decimal places when reporting the results from any calculations, unless otherwise specified.
-Use the provided computer output to compute the standard deviation of the error term.
A) 1.872
B) 3.504
C) 1.832
D) 3.357
Question
Use the following to answer the questions below:
Data were collected on the mileage (in thousands of miles) and price (in thousands of dollars) of a random sample of used Hyundai Elantras. A scatterplot of the data (with regression line), some summary statistics, and partial computer output from a regression analysis are provided.
Use three decimal places when reporting the results from any calculations, unless otherwise specified.
-Use the provided output to construct and interpret a 95% interval for the mean price of all used Hyundai Elantras with 50,000 miles.
Question
Use the following to answer the questions below:
Data were collected on the mileage (in thousands of miles) and price (in thousands of dollars) of a random sample of used Hyundai Elantras. A scatterplot of the data (with regression line), some summary statistics, and partial computer output from a regression analysis are provided.
Use three decimal places when reporting the results from any calculations, unless otherwise specified.
-Use the provided output to construct and interpret a 95% interval for the price of a single used Hyundai Elantra with 50,000 miles.
Question
Use the following to answer the questions below:
Data were collected on the mileage (in thousands of miles) and price (in thousands of dollars) of a random sample of used Hyundai Elantras. A scatterplot of the data (with regression line), some summary statistics, and partial computer output from a regression analysis are provided.
Use three decimal places when reporting the results from any calculations, unless otherwise specified.
-Use the following computer output to identify and interpret a 95% interval for the mean price of all used Hyundai Elantras with 30,000 miles.
Predicted Values for New Observations

A) We are 95% sure that the mean price of all used Hyundai Elantras with 30,000 miles is between $10,058 and $12,022.
B) We are 95% sure that the price of a single used Hyundai Elantra with 30,000 miles is between $7046 and $15,034.
C) We are 95% sure that the price of a single used Hyundai Elantras with 30,000 miles is between $10,058 and $12,022.
D) We are 95% sure that the mean price of all used Hyundai Elantras with 30,000 miles is between $7046 and $15,034.
Data were collected on the mileage (in thousands of miles) and price (in thousands of dollars) of a random sample of used Hyundai Elantras. A scatterplot of the data (with regression line), some summary statistics, and partial computer output from a regression analysis are provided.
Use three decimal places when reporting the results from any calculations, unless otherwise specified.
-Use the following computer output to identify and interpret a 95% interval for the mean price of all used Hyundai Elantras with 30,000 miles.
Predicted Values for New Observations
A) We are 95% sure that the mean price of all used Hyundai Elantras with 30,000 miles is between $10,058 and $12,022.
B) We are 95% sure that the price of a single used Hyundai Elantra with 30,000 miles is between $7046 and $15,034.
C) We are 95% sure that the price of a single used Hyundai Elantras with 30,000 miles is between $10,058 and $12,022.
D) We are 95% sure that the mean price of all used Hyundai Elantras with 30,000 miles is between $7046 and $15,034.
Question
Use the following to answer the questions below:
Data were collected on the mileage (in thousands of miles) and price (in thousands of dollars) of a random sample of used Hyundai Elantras. A scatterplot of the data (with regression line), some summary statistics, and partial computer output from a regression analysis are provided.
Use three decimal places when reporting the results from any calculations, unless otherwise specified.
-Use the following computer output to identify and interpret a 95% interval for the price of a single used Hyundai Elantra with 70,000 miles.
A) We are 95% sure that the price of a single used Hyundai Elantra with 70,000 miles is between $3,440 and $11,347.
B) We are 95% sure that the mean price of all used Hyundai Elantras with 70,000 miles is between $3,440 and $11,347.
C) We are 95% sure that the price of a single used Hyundai Elantra with 70,000 miles is between $6,593 and $8,193.
D) We are 95% sure that the mean price of all used Hyundai Elantras with 70,000 miles is between $6,593 and $8,193.
Question
Use the following to answer the questions below:
Data were collected on the mileage (in thousands of miles) and price (in thousands of dollars) of a random sample of used Hyundai Elantras. A scatterplot of the data (with regression line), some summary statistics, and partial computer output from a regression analysis are provided.
Use three decimal places when reporting the results from any calculations, unless otherwise specified.
-Use the information in the computer output to compute the standard error of the slope, SE. Round your answer to four decimal places.
A) 0.0097
B) 0.0099
C) 0.0101
D) 0.0103
Question
Use the following to answer the questions below:
Data were collected on the mileage (in thousands of miles) and price (in thousands of dollars) of a random sample of used Hyundai Elantras. A scatterplot of the data (with regression line), some summary statistics, and partial computer output from a regression analysis are provided.
Use three decimal places when reporting the results from any calculations, unless otherwise specified.
-Compute the t test statistic for the slope.
A) -9.402
B) -9.212
C) -9.030
D) -8.854
Question
Use the following to answer the questions below:
Fast food restaurants are required to publish nutrition information about the foods they serve. Nutrition information about a random sample of 15 McDonald's lunch/dinner menu items (excluding sides and drinks) was obtained from their website. We wish to use the total fat content (in grams) to better understand the number of calories in the lunch/dinner menu items at McDonald's. Computer output from a regression analysis and a scatterplot (with regression line) of the data are provided.
Use two decimal places when reporting the results from any calculations, unless otherwise specified.
The regression equation is Calories = 137.1 + 15.06 Total Fat (g)
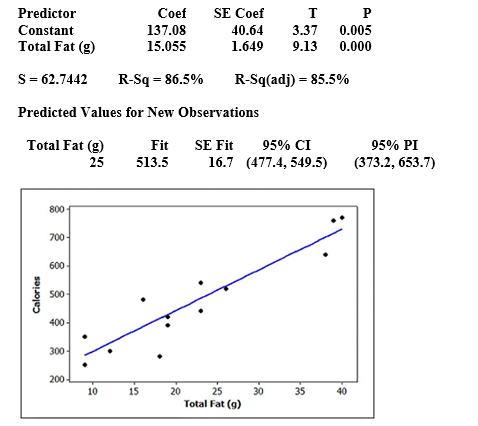
-Using the scatterplot, should we should have any major concerns about the conditions being met for using a linear model with these data?
Fast food restaurants are required to publish nutrition information about the foods they serve. Nutrition information about a random sample of 15 McDonald's lunch/dinner menu items (excluding sides and drinks) was obtained from their website. We wish to use the total fat content (in grams) to better understand the number of calories in the lunch/dinner menu items at McDonald's. Computer output from a regression analysis and a scatterplot (with regression line) of the data are provided.
Use two decimal places when reporting the results from any calculations, unless otherwise specified.
The regression equation is Calories = 137.1 + 15.06 Total Fat (g)
-Using the scatterplot, should we should have any major concerns about the conditions being met for using a linear model with these data?
Question
Use the following to answer the questions below:
Fast food restaurants are required to publish nutrition information about the foods they serve. Nutrition information about a random sample of 15 McDonald's lunch/dinner menu items (excluding sides and drinks) was obtained from their website. We wish to use the total fat content (in grams) to better understand the number of calories in the lunch/dinner menu items at McDonald's. Computer output from a regression analysis and a scatterplot (with regression line) of the data are provided.
Use two decimal places when reporting the results from any calculations, unless otherwise specified.
The regression equation is Calories = 137.1 + 15.06 Total Fat (g)
-Use the equation of the least squares line to predict the number of calories in a menu item with 20 grams of fat.
A) 438.30 calories
B) 334.44 calories
C) 289.80 calories
D) 410.60 calories
Question
Use the following to answer the questions below:
Fast food restaurants are required to publish nutrition information about the foods they serve. Nutrition information about a random sample of 15 McDonald's lunch/dinner menu items (excluding sides and drinks) was obtained from their website. We wish to use the total fat content (in grams) to better understand the number of calories in the lunch/dinner menu items at McDonald's. Computer output from a regression analysis and a scatterplot (with regression line) of the data are provided.
Use two decimal places when reporting the results from any calculations, unless otherwise specified.
The regression equation is Calories = 137.1 + 15.06 Total Fat (g)
-What is the estimated slope in this regression model?
A) 15.06
B) 16.7
C) -15.06
D) -16.7
Question
Use the following to answer the questions below:
Fast food restaurants are required to publish nutrition information about the foods they serve. Nutrition information about a random sample of 15 McDonald's lunch/dinner menu items (excluding sides and drinks) was obtained from their website. We wish to use the total fat content (in grams) to better understand the number of calories in the lunch/dinner menu items at McDonald's. Computer output from a regression analysis and a scatterplot (with regression line) of the data are provided.
Use two decimal places when reporting the results from any calculations, unless otherwise specified.
The regression equation is Calories = 137.1 + 15.06 Total Fat (g)
-What are the degrees of freedom for constructing a confidence interval for, or performing a test about, the population slope?
A) 15
B) 14
C) 13
D) 12
Question
Use the following to answer the questions below:
Fast food restaurants are required to publish nutrition information about the foods they serve. Nutrition information about a random sample of 15 McDonald's lunch/dinner menu items (excluding sides and drinks) was obtained from their website. We wish to use the total fat content (in grams) to better understand the number of calories in the lunch/dinner menu items at McDonald's. Computer output from a regression analysis and a scatterplot (with regression line) of the data are provided.
Use two decimal places when reporting the results from any calculations, unless otherwise specified.
The regression equation is Calories = 137.1 + 15.06 Total Fat (g)
-Use the computer output, and α = 0.05, to test the slope to determine whether total fat content (g) is an effective predictor of the number of calories. Include all details of the test.
Question
Use the following to answer the questions below:
Fast food restaurants are required to publish nutrition information about the foods they serve. Nutrition information about a random sample of 15 McDonald's lunch/dinner menu items (excluding sides and drinks) was obtained from their website. We wish to use the total fat content (in grams) to better understand the number of calories in the lunch/dinner menu items at McDonald's. Computer output from a regression analysis and a scatterplot (with regression line) of the data are provided.
Use two decimal places when reporting the results from any calculations, unless otherwise specified.
The regression equation is Calories = 137.1 + 15.06 Total Fat (g)
-Construct and interpret a 99% confidence interval for the population slope.
Question
Use the following to answer the questions below:
Fast food restaurants are required to publish nutrition information about the foods they serve. Nutrition information about a random sample of 15 McDonald's lunch/dinner menu items (excluding sides and drinks) was obtained from their website. We wish to use the total fat content (in grams) to better understand the number of calories in the lunch/dinner menu items at McDonald's. Computer output from a regression analysis and a scatterplot (with regression line) of the data are provided.
Use two decimal places when reporting the results from any calculations, unless otherwise specified.
The regression equation is Calories = 137.1 + 15.06 Total Fat (g)
-What is the for this model? Interpret it in context.
A) = 86.5%
86)5% of the variability in the number of calories for lunch/dinner menu items in this sample is explained by the total fat content (g).
B) = 86.5%
86)5% of the variability in the the total fat content in this sample is explained by the number of calories.
C) = 85.5% 85.5% of the variability in the number of calories for lunch/dinner menu items in this sample is explained by the total fat content (g).
D) = 85.5% 85.5% of the variability in the the total fat content in this sample is explained by the number of calories.
Fast food restaurants are required to publish nutrition information about the foods they serve. Nutrition information about a random sample of 15 McDonald's lunch/dinner menu items (excluding sides and drinks) was obtained from their website. We wish to use the total fat content (in grams) to better understand the number of calories in the lunch/dinner menu items at McDonald's. Computer output from a regression analysis and a scatterplot (with regression line) of the data are provided.
Use two decimal places when reporting the results from any calculations, unless otherwise specified.
The regression equation is Calories = 137.1 + 15.06 Total Fat (g)
-What is the
for this model? Interpret it in context.A)
= 86.5%86)5% of the variability in the number of calories for lunch/dinner menu items in this sample is explained by the total fat content (g).
B)
= 86.5%86)5% of the variability in the the total fat content in this sample is explained by the number of calories.
C)
= 85.5% 85.5% of the variability in the number of calories for lunch/dinner menu items in this sample is explained by the total fat content (g).D)
= 85.5% 85.5% of the variability in the the total fat content in this sample is explained by the number of calories. Question
Use the following to answer the questions below:
Fast food restaurants are required to publish nutrition information about the foods they serve. Nutrition information about a random sample of 15 McDonald's lunch/dinner menu items (excluding sides and drinks) was obtained from their website. We wish to use the total fat content (in grams) to better understand the number of calories in the lunch/dinner menu items at McDonald's. Computer output from a regression analysis and a scatterplot (with regression line) of the data are provided.
Use two decimal places when reporting the results from any calculations, unless otherwise specified.
The regression equation is Calories = 137.1 + 15.06 Total Fat (g)
-Based on the available information, what is the correlation between total fat content (g) and number of calories for McDonald's lunch/dinner menu items in this sample?
A) 0.93
B) -0.93
C) 9.3
D) -9.3

Unlock Deck
Sign up to unlock the cards in this deck!
Unlock Deck
Unlock Deck
1/123
Play
Full screen (f)
Deck 9: Inference for Regression
1
Use the following to answer the questions below:
Computer output from a regression analysis is provided.
The regression equation is Y = 72.9 - 0.519 X
-What is the sample slope for this model?
A) 72.909
B) 2.037
C) -0.5195
D) 0.1946
Computer output from a regression analysis is provided.
The regression equation is Y = 72.9 - 0.519 X
-What is the sample slope for this model?
A) 72.909
B) 2.037
C) -0.5195
D) 0.1946
-0.5195
2
Use the following to answer the questions below:
Computer output from a regression analysis is provided.
The regression equation is Y = 72.9 - 0.519 X
-What is the sample intercept for this model?
A) 72.909
B) 2.037
C) -0.5195
D) 0.1946
Computer output from a regression analysis is provided.
The regression equation is Y = 72.9 - 0.519 X
-What is the sample intercept for this model?
A) 72.909
B) 2.037
C) -0.5195
D) 0.1946
72.909
3
Use the following to answer the questions below:
Computer output from a regression analysis is provided.
The regression equation is Y = 72.9 - 0.519 X
-What is the standard error of the sample slope?
A) 72.909
B) 2.037
C) -0.519
D) 0.1946
Computer output from a regression analysis is provided.
The regression equation is Y = 72.9 - 0.519 X
-What is the standard error of the sample slope?
A) 72.909
B) 2.037
C) -0.519
D) 0.1946
0.1946
4
Use the following to answer the questions below:
Computer output from a regression analysis is provided.
The regression equation is Y = 72.9 - 0.519 X
-What is the p-value for testing if the slope in the population is different from zero?
A) 0.5195
B) 0.1946
C) p < 0.001
D) 0.008
Computer output from a regression analysis is provided.
The regression equation is Y = 72.9 - 0.519 X
-What is the p-value for testing if the slope in the population is different from zero?
A) 0.5195
B) 0.1946
C) p < 0.001
D) 0.008
Unlock Deck
Unlock for access to all 123 flashcards in this deck.
Unlock Deck
k this deck
5
Use the following to answer the questions below:
Computer output from a regression analysis is provided.
The regression equation is Y = 72.9 - 0.519 X
-The sample size in this situation is n = 157. What are the degrees of freedom for constructing a confidence interval for, or performing a test about, the population slope?
A) 157
B) 156
C) 155
D) 153
Unlock Deck
Unlock for access to all 123 flashcards in this deck.
Unlock Deck
k this deck
6
Use the following to answer the questions below:
Computer output from a regression analysis is provided.
The regression equation is Y = 72.9 - 0.519 X
-The sample size in this situation is n = 157. Construct a 95% confidence interval for the population slope. Round the margin of error to four decimal places.
A) -0.9038 to -0.1352
B) -0.9009 to -0.1381
C) -0.8976 to -0.1414
D) -0.9138 to -0.1252
Unlock Deck
Unlock for access to all 123 flashcards in this deck.
Unlock Deck
k this deck
7
Use the following to answer the questions below:
Computer output from a regression analysis is provided.
The regression equation is Y = 72.9 - 0.519 X
-Use the p-value for testing if the slope in the population is different from zero (and a 5% significance level) to make a clear conclusion about the effectiveness of the model.
A) p-value = 0.008 There is very strong evidence that the population slope differs from zero, and thus is an effective model for predicting this response variable.
B) p-value = 0.008 There is not enough evidence that the population slope differs from zero, and thus this is not an effective model for predicting this response variable.
Unlock Deck
Unlock for access to all 123 flashcards in this deck.
Unlock Deck
k this deck
8
Use the following to answer the questions below:
Computer output from a regression analysis is provided.
-What is the sample slope for this model?
A) 1.6370
B) 0.5453
C) 7.2960
D) 14.5444
Computer output from a regression analysis is provided.
-What is the sample slope for this model?
A) 1.6370
B) 0.5453
C) 7.2960
D) 14.5444
Unlock Deck
Unlock for access to all 123 flashcards in this deck.
Unlock Deck
k this deck
9
Use the following to answer the questions below:
Computer output from a regression analysis is provided.
-What is the sample intercept for this model?
A) 1.6370
B) 0.5453
C) 7.2960
D) 14.5444
Computer output from a regression analysis is provided.
-What is the sample intercept for this model?
A) 1.6370
B) 0.5453
C) 7.2960
D) 14.5444
Unlock Deck
Unlock for access to all 123 flashcards in this deck.
Unlock Deck
k this deck
10
Use the following to answer the questions below:
Computer output from a regression analysis is provided.
-What is the standard error of the sample slope?
A) 1.6370
B) 0.5453
C) 7.2960
D) 14.5444
Computer output from a regression analysis is provided.
-What is the standard error of the sample slope?
A) 1.6370
B) 0.5453
C) 7.2960
D) 14.5444
Unlock Deck
Unlock for access to all 123 flashcards in this deck.
Unlock Deck
k this deck
11
Use the following to answer the questions below:
Computer output from a regression analysis is provided.
-What is the p-value for testing if the slope in the population is different from zero?
A) 0.502
B) 0.622
C) 0.5453
D) 0.00765
Computer output from a regression analysis is provided.
-What is the p-value for testing if the slope in the population is different from zero?
A) 0.502
B) 0.622
C) 0.5453
D) 0.00765
Unlock Deck
Unlock for access to all 123 flashcards in this deck.
Unlock Deck
k this deck
12
Use the following to answer the questions below:
Computer output from a regression analysis is provided.
-The sample size in this situation is n = 20. What are the degrees of freedom for constructing a confidence interval, or performing a test about, the population slope?
A) 17
B) 18
C) 19
D) 20
Computer output from a regression analysis is provided.
-The sample size in this situation is n = 20. What are the degrees of freedom for constructing a confidence interval, or performing a test about, the population slope?
A) 17
B) 18
C) 19
D) 20
Unlock Deck
Unlock for access to all 123 flashcards in this deck.
Unlock Deck
k this deck
13
Use the following to answer the questions below:
Computer output from a regression analysis is provided.
-The sample size in this situation is n = 20. Construct a 95% confidence interval for the population slope. Round the margin of error to three decimal places.
A) 0.491 to 2.783
B) 0.568 to 2.706
C) 0.578 to 2.697
D) 0.5327 to 2.741
Computer output from a regression analysis is provided.
-The sample size in this situation is n = 20. Construct a 95% confidence interval for the population slope. Round the margin of error to three decimal places.
A) 0.491 to 2.783
B) 0.568 to 2.706
C) 0.578 to 2.697
D) 0.5327 to 2.741
Unlock Deck
Unlock for access to all 123 flashcards in this deck.
Unlock Deck
k this deck
14
Use the following to answer the questions below:
Computer output from a regression analysis is provided.
-Use the p-value for testing if the slope in the population is different from zero (and a 5% significance level) to make a clear conclusion about the effectiveness of the model.
A) p-value = 0.00765
There is very strong evidence that the population slope differs from zero, and thus is an effective model for predicting this response variable.
B) p-value = 0.00765
There is not enough evidence that the population slope differs from zero, and thus is not an effective model for predicting this response variable.
Unlock Deck
Unlock for access to all 123 flashcards in this deck.
Unlock Deck
k this deck
15
The website for the Quantitative Environmental Learning Project (funded by the National Science Foundation) describes data they collected on the lengths and widths of Puget Sound Butter Clams. A scatterplot of the data (with the regression line) is provided.
Use the scatterplot to check each of the conditions for using a linear model with this data. Is using a linear model appropriate for these data?
Use the scatterplot to check each of the conditions for using a linear model with this data. Is using a linear model appropriate for these data?
Unlock Deck
Unlock for access to all 123 flashcards in this deck.
Unlock Deck
k this deck
16
In a random sample of 41 students, the correlation between Math SAT score and college GPA is 0.289. Is there a significant linear association between Math SAT score and college GPA? Use α = 0.05. Include all details of the test. Round the test statistic to two decimal places.
Unlock Deck
Unlock for access to all 123 flashcards in this deck.
Unlock Deck
k this deck
17
In a random sample of 41 students, the correlation between Verbal SAT score and college GPA is 0.574. Is there evidence of a positive correlation between Verbal SAT score and college GPA? Use a 5% significance level. Include all details of the test. Round the test statistic to two decimal places.
Unlock Deck
Unlock for access to all 123 flashcards in this deck.
Unlock Deck
k this deck
18
In a random sample of 41 college students, the correlation between number of hours of television watched in a typical week and college GPA is -0.125. Is there evidence of a negative correlation between the amount of television watched and college GPA? Use a 5% significance level. Include all details of the test. Round the test statistic to three decimal places.
Unlock Deck
Unlock for access to all 123 flashcards in this deck.
Unlock Deck
k this deck
19
Use the following to answer the questions below:
In a regression analysis based on a sample of size n = 30, SSModel = 750 and SSTotal = 2,500.
-Use this information to fill in all values in an analysis of variance table as shown.
In a regression analysis based on a sample of size n = 30, SSModel = 750 and SSTotal = 2,500.
-Use this information to fill in all values in an analysis of variance table as shown.
Unlock Deck
Unlock for access to all 123 flashcards in this deck.
Unlock Deck
k this deck
20
Use the following to answer the questions below:
In a regression analysis based on a sample of size n = 30, SSModel = 750 and SSTotal = 2,500.
-Compute .
A) 30%
B) 83%
C) 1.2%
D) 5.5%
In a regression analysis based on a sample of size n = 30, SSModel = 750 and SSTotal = 2,500.
-Compute
.A) 30%
B) 83%
C) 1.2%
D) 5.5%
Unlock Deck
Unlock for access to all 123 flashcards in this deck.
Unlock Deck
k this deck
21
Use the following to answer the questions below:
In a regression analysis based on a sample of size n = 30, SSModel = 750 and SSTotal = 2,500.
-Compute the standard deviation of the error term. Use two decimal places in your answer.
A) 7.91
B) 6.25
C) 1.50
D) 7.64
In a regression analysis based on a sample of size n = 30, SSModel = 750 and SSTotal = 2,500.
-Compute the standard deviation of the error term. Use two decimal places in your answer.
A) 7.91
B) 6.25
C) 1.50
D) 7.64
Unlock Deck
Unlock for access to all 123 flashcards in this deck.
Unlock Deck
k this deck
22
Use the following to answer the questions below:
In a regression analysis with n = 25, SSE = 1,800 and SSTotal = 2,000.
-Use this information to fill in all values in an analysis of variance table as shown. Round decimal answers to three decimal places.
In a regression analysis with n = 25, SSE = 1,800 and SSTotal = 2,000.
-Use this information to fill in all values in an analysis of variance table as shown. Round decimal answers to three decimal places.
Unlock Deck
Unlock for access to all 123 flashcards in this deck.
Unlock Deck
k this deck
23
Use the following to answer the questions below:
In a regression analysis with n = 25, SSE = 1,800 and SSTotal = 2,000.
-Compute .
A) 10%
B) 0.10%
C) 11%
D) 0.11%
In a regression analysis with n = 25, SSE = 1,800 and SSTotal = 2,000.
-Compute
.A) 10%
B) 0.10%
C) 11%
D) 0.11%
Unlock Deck
Unlock for access to all 123 flashcards in this deck.
Unlock Deck
k this deck
24
Use the following to answer the questions below:
In a regression analysis with n = 25, SSE = 1,800 and SSTotal = 2,000.
-Compute the standard deviation of the error term. Use two decimal places in your answer.
A) 8.85
B) 8.49
C) 1.70
D) 1.84
In a regression analysis with n = 25, SSE = 1,800 and SSTotal = 2,000.
-Compute the standard deviation of the error term. Use two decimal places in your answer.
A) 8.85
B) 8.49
C) 1.70
D) 1.84
Unlock Deck
Unlock for access to all 123 flashcards in this deck.
Unlock Deck
k this deck
25
Use the following to answer the questions below:
Students in a small statistics course wanted to investigate if forearm length (in cm) was useful for predicting foot length (in cm). The data they collected are displayed in the provided scatterplot (with regression), and the computer output from the analysis is provided.
Use three decimal places when reporting the results from any calculations, unless otherwise specified.
?
The regression equation is Foot (cm) = 9.22 + 0.574 Forearm (cm)
-Consider the scatterplot. Should we have any significant concerns about the conditions being met for using a linear model with these data?
Unlock Deck
Unlock for access to all 123 flashcards in this deck.
Unlock Deck
k this deck
26
Use the following to answer the questions below:
Students in a small statistics course wanted to investigate if forearm length (in cm) was useful for predicting foot length (in cm). The data they collected are displayed in the provided scatterplot (with regression), and the computer output from the analysis is provided.
Use three decimal places when reporting the results from any calculations, unless otherwise specified.
?
The regression equation is Foot (cm) = 9.22 + 0.574 Forearm (cm)
-Use the fitted model to predict the foot length for someone whose arm is 30 cm long. Report your answer with two decimal places.
A) 26.44 cm
B) 25.89 cm
C) 26.12 cm
D) 25.73 cm
Unlock Deck
Unlock for access to all 123 flashcards in this deck.
Unlock Deck
k this deck
27
Use the following to answer the questions below:
Students in a small statistics course wanted to investigate if forearm length (in cm) was useful for predicting foot length (in cm). The data they collected are displayed in the provided scatterplot (with regression), and the computer output from the analysis is provided.
Use three decimal places when reporting the results from any calculations, unless otherwise specified.
?
The regression equation is Foot (cm) = 9.22 + 0.574 Forearm (cm)
-What is the estimated slope in this regression model?
A) 0.574
B) 9.22
C) 0.5735
D) 9.216
Unlock Deck
Unlock for access to all 123 flashcards in this deck.
Unlock Deck
k this deck
28
Use the following to answer the questions below:
Students in a small statistics course wanted to investigate if forearm length (in cm) was useful for predicting foot length (in cm). The data they collected are displayed in the provided scatterplot (with regression), and the computer output from the analysis is provided.
Use three decimal places when reporting the results from any calculations, unless otherwise specified.
?
The regression equation is Foot (cm) = 9.22 + 0.574 Forearm (cm)
-What is the test statistic for a test of the slope? What is the p-value? What is the conclusion of the test, in context?
A) t = 3.63; p-value = 0.004
There is strong evidence that forearm length is a useful predictor of foot length.
B) t = 2.04; p-value = 0.066
There is not enough evidence to conclude that forearm length is a useful predictor of foot length.
C) t = 3.63; p-value = 0.004
There is not enough evidence to conclude that forearm length is a useful predictor of foot length.
D) t = 2.04; p-value = 0.066
There is strong evidence that forearm length is a useful predictor of foot length.
Unlock Deck
Unlock for access to all 123 flashcards in this deck.
Unlock Deck
k this deck
29
Use the following to answer the questions below:
Students in a small statistics course wanted to investigate if forearm length (in cm) was useful for predicting foot length (in cm). The data they collected are displayed in the provided scatterplot (with regression), and the computer output from the analysis is provided.
Use three decimal places when reporting the results from any calculations, unless otherwise specified.
?
The regression equation is Foot (cm) = 9.22 + 0.574 Forearm (cm)
-Use the ANOVA table to determine the overall sample size.
A) 13
B) 12
C) 11
D) 10
Unlock Deck
Unlock for access to all 123 flashcards in this deck.
Unlock Deck
k this deck
30
Use the following to answer the questions below:
Students in a small statistics course wanted to investigate if forearm length (in cm) was useful for predicting foot length (in cm). The data they collected are displayed in the provided scatterplot (with regression), and the computer output from the analysis is provided.
Use three decimal places when reporting the results from any calculations, unless otherwise specified.
?
The regression equation is Foot (cm) = 9.22 + 0.574 Forearm (cm)
-Construct a 90% confidence interval for the population slope.
A) 0.291 to 0.857
B) 0.265 to 0.883
C) 0.314 to 0.834
D) 0.277 to 0.871
Unlock Deck
Unlock for access to all 123 flashcards in this deck.
Unlock Deck
k this deck
31
Use the following to answer the questions below:
Students in a small statistics course wanted to investigate if forearm length (in cm) was useful for predicting foot length (in cm). The data they collected are displayed in the provided scatterplot (with regression), and the computer output from the analysis is provided.
Use three decimal places when reporting the results from any calculations, unless otherwise specified.
?
The regression equation is Foot (cm) = 9.22 + 0.574 Forearm (cm)
-Use the ANOVA table to compute and interpret
.
A) 0.546
About 55% of the variability in foot lengths in this sample is explained by the person's forearm length.
B) 0.298
About 30% of the variability in foot lengths in this sample is explained by the person's forearm length.
C) 0.454
About 45% of the variability in foot lengths in this sample is explained by the person's forearm length.
D) 0.206
About 21% of the variability in foot lengths in this sample is explained by the person's forearm length.
Unlock Deck
Unlock for access to all 123 flashcards in this deck.
Unlock Deck
k this deck
32
Use the following to answer the questions below:
Students in a small statistics course wanted to investigate if forearm length (in cm) was useful for predicting foot length (in cm). The data they collected are displayed in the provided scatterplot (with regression), and the computer output from the analysis is provided.
Use three decimal places when reporting the results from any calculations, unless otherwise specified.
The regression equation is Foot (cm) = 9.22 + 0.574 Forearm (cm)
-The correlation between foot length and forearm length is 0.7389. Compute and interpret for this regression model.
Students in a small statistics course wanted to investigate if forearm length (in cm) was useful for predicting foot length (in cm). The data they collected are displayed in the provided scatterplot (with regression), and the computer output from the analysis is provided.
Use three decimal places when reporting the results from any calculations, unless otherwise specified.
The regression equation is Foot (cm) = 9.22 + 0.574 Forearm (cm)
-The correlation between foot length and forearm length is 0.7389. Compute and interpret
for this regression model. Unlock Deck
Unlock for access to all 123 flashcards in this deck.
Unlock Deck
k this deck
33
Use the following to answer the questions below:
Students in a small statistics course wanted to investigate if forearm length (in cm) was useful for predicting foot length (in cm). The data they collected are displayed in the provided scatterplot (with regression), and the computer output from the analysis is provided.
Use three decimal places when reporting the results from any calculations, unless otherwise specified.
?
The regression equation is Foot (cm) = 9.22 + 0.574 Forearm (cm)
-Use the ANOVA table to find the standard deviation of the error term. Round your answer to three decimal places.
Unlock Deck
Unlock for access to all 123 flashcards in this deck.
Unlock Deck
k this deck
34
Use the following to answer the questions below:
Students in a small statistics course wanted to investigate if forearm length (in cm) was useful for predicting foot length (in cm). The data they collected are displayed in the provided scatterplot (with regression), and the computer output from the analysis is provided.
Use three decimal places when reporting the results from any calculations, unless otherwise specified.
The regression equation is Foot (cm) = 9.22 + 0.574 Forearm (cm)
-Based on the output, provide and interpret a 95% confidence interval for the mean foot length for all individuals with a forearm that is 28 cm long.
Unlock Deck
Unlock for access to all 123 flashcards in this deck.
Unlock Deck
k this deck
35
Use the following to answer the questions below:
Students in a small statistics course wanted to investigate if forearm length (in cm) was useful for predicting foot length (in cm). The data they collected are displayed in the provided scatterplot (with regression), and the computer output from the analysis is provided.
Use three decimal places when reporting the results from any calculations, unless otherwise specified.
The regression equation is Foot (cm) = 9.22 + 0.574 Forearm (cm)
-Based on the output, provide and interpret a 95% prediction interval for the foot length of a specific individual with a forearm that is 28 cm long.
Unlock Deck
Unlock for access to all 123 flashcards in this deck.
Unlock Deck
k this deck
36
Use the following to answer the questions below:
Students in a small statistics course wanted to investigate if forearm length (in cm) was useful for predicting foot length (in cm). The data they collected are displayed in the provided scatterplot (with regression), and the computer output from the analysis is provided.
Use three decimal places when reporting the results from any calculations, unless otherwise specified.
The regression equation is Foot (cm) = 9.22 + 0.574 Forearm (cm)
-When conducting inference for the population slope, it is most common to test if the population slope is different from zero. However, there are other situations where a different test might be more interesting. For instance, it is often said that the length of the forearm is roughly the same as the length of the foot (see, for example, the movie Pretty Woman). What population slope is implied by this statement, and what would the hypotheses for testing the accuracy of this claim look like?
Unlock Deck
Unlock for access to all 123 flashcards in this deck.
Unlock Deck
k this deck
37
Use the following to answer the questions below:
Data were collected on GPA and number of Facebook friends for students in a small statistics class. Some summary statistics, partial output from the regression analysis, and a scatterplot of the data (with regression line) are provided. Assume that students in this class are typical of all students at the university.
Use three decimal places when reporting the results from any calculations, unless otherwise specified.
-Use the scatterplot to determine whether we should have any strong concerns about the conditions being met for using a linear model with these data.
Unlock Deck
Unlock for access to all 123 flashcards in this deck.
Unlock Deck
k this deck
38
Use the following to answer the questions below:
Data were collected on GPA and number of Facebook friends for students in a small statistics class. Some summary statistics, partial output from the regression analysis, and a scatterplot of the data (with regression line) are provided. Assume that students in this class are typical of all students at the university.
Use three decimal places when reporting the results from any calculations, unless otherwise specified.
-Use the equation of the least squares line to predict the GPA for someone with 800 Facebook friends.
A) 3.095
B) 3.830
C) 3.153
D) 3.024
Unlock Deck
Unlock for access to all 123 flashcards in this deck.
Unlock Deck
k this deck
39
Use the following to answer the questions below:
Data were collected on GPA and number of Facebook friends for students in a small statistics class. Some summary statistics, partial output from the regression analysis, and a scatterplot of the data (with regression line) are provided. Assume that students in this class are typical of all students at the university.
Use three decimal places when reporting the results from any calculations, unless otherwise specified.
-Use the information in the ANOVA table to determine the number of students included in the dataset.
A) 31
B) 30
C) 29
D) 28
Unlock Deck
Unlock for access to all 123 flashcards in this deck.
Unlock Deck
k this deck
40
Use the following to answer the questions below:
Data were collected on GPA and number of Facebook friends for students in a small statistics class. Some summary statistics, partial output from the regression analysis, and a scatterplot of the data (with regression line) are provided. Assume that students in this class are typical of all students at the university.
Use three decimal places when reporting the results from any calculations, unless otherwise specified.
-Use the information in the ANOVA table to compute and interpret .
A) = 0.470
About 47% of the variability in GPA for students in this sample is explained by number of Facebook friends.
B) = 0.686
About 69% of the variability in GPA for students in this sample is explained by number of Facebook friends.
C) = 0.470
About 53% of the variability in GPA for students in this sample is explained by number of Facebook friends.
D) = 0.686
About 31% of the variability in GPA for students in this sample is explained by number of Facebook friends.
Data were collected on GPA and number of Facebook friends for students in a small statistics class. Some summary statistics, partial output from the regression analysis, and a scatterplot of the data (with regression line) are provided. Assume that students in this class are typical of all students at the university.
Use three decimal places when reporting the results from any calculations, unless otherwise specified.
-Use the information in the ANOVA table to compute and interpret
.A)
= 0.470About 47% of the variability in GPA for students in this sample is explained by number of Facebook friends.
B)
= 0.686About 69% of the variability in GPA for students in this sample is explained by number of Facebook friends.
C)
= 0.470About 53% of the variability in GPA for students in this sample is explained by number of Facebook friends.
D)
= 0.686About 31% of the variability in GPA for students in this sample is explained by number of Facebook friends.
Unlock Deck
Unlock for access to all 123 flashcards in this deck.
Unlock Deck
k this deck
41
Use the following to answer the questions below:
Data were collected on GPA and number of Facebook friends for students in a small statistics class. Some summary statistics, partial output from the regression analysis, and a scatterplot of the data (with regression line) are provided. Assume that students in this class are typical of all students at the university.
Use three decimal places when reporting the results from any calculations, unless otherwise specified.
-Is the linear model effective at predicting GPA? Use the information from the computer output and α = 0.05. Include all details of the test.
Unlock Deck
Unlock for access to all 123 flashcards in this deck.
Unlock Deck
k this deck
42
Use the following to answer the questions below:
Data were collected on GPA and number of Facebook friends for students in a small statistics class. Some summary statistics, partial output from the regression analysis, and a scatterplot of the data (with regression line) are provided. Assume that students in this class are typical of all students at the university.
Use three decimal places when reporting the results from any calculations, unless otherwise specified.
-Use the information in the computer output to compute the standard deviation of the error term.
A) 0.305
B) 0.093
C) 0.412
D) 0.317
Unlock Deck
Unlock for access to all 123 flashcards in this deck.
Unlock Deck
k this deck
43
Use the following to answer the questions below:
Data were collected on GPA and number of Facebook friends for students in a small statistics class. Some summary statistics, partial output from the regression analysis, and a scatterplot of the data (with regression line) are provided. Assume that students in this class are typical of all students at the university.
Use three decimal places when reporting the results from any calculations, unless otherwise specified.
-Use the provided output to construct a 90% confidence interval for the mean GPA of all students with 800 Facebook friends.
A) 2.993 to 3.197
B) 2.760 to 3.430
C) 3.035 to 3.155
D) 2.916 to 3.274
Unlock Deck
Unlock for access to all 123 flashcards in this deck.
Unlock Deck
k this deck
44
Use the following to answer the questions below:
Data were collected on GPA and number of Facebook friends for students in a small statistics class. Some summary statistics, partial output from the regression analysis, and a scatterplot of the data (with regression line) are provided. Assume that students in this class are typical of all students at the university.
Use three decimal places when reporting the results from any calculations, unless otherwise specified.
-Use the provided output to construct a 90% prediction interval for the GPA of a student with 800 Facebook friends.
A) 2.566 to 3.624
B) 1.361 to 4.829
C) 2.784 to 3.406
D) 2.224 to 3.966
Unlock Deck
Unlock for access to all 123 flashcards in this deck.
Unlock Deck
k this deck
45
Use the following to answer the questions below:
Data were collected on GPA and number of Facebook friends for students in a small statistics class. Some summary statistics, partial output from the regression analysis, and a scatterplot of the data (with regression line) are provided. Assume that students in this class are typical of all students at the university.
Use three decimal places when reporting the results from any calculations, unless otherwise specified.
-Use the following output to identify and interpret a 95% interval for the mean GPA for all students with 500 Facebook friends.
Predicted Values for New Observations
A) CI: (3.2378, 3.5036)
We are 95% sure that the mean GPA for all students with 500 Facebook friends is between 3.2378 and 3.5036.
B) PI: (2.7315, 4.0089)
We are 95% sure that the GPA of a student with 500 Facebook friends is between 2.7315 and 4.0089.
Unlock Deck
Unlock for access to all 123 flashcards in this deck.
Unlock Deck
k this deck
46
Use the following to answer the questions below:
Data were collected on GPA and number of Facebook friends for students in a small statistics class. Some summary statistics, partial output from the regression analysis, and a scatterplot of the data (with regression line) are provided. Assume that students in this class are typical of all students at the university.
Use three decimal places when reporting the results from any calculations, unless otherwise specified.
-Use the following output to identify and interpret a 95% interval for the GPA of a single student with 500 Facebook friends.
Predicted Values for New Observations
A) PI: (2.7315, 4.0089)
We are 95% sure that the GPA of a student with 500 Facebook friends is between 2.7315 and 4.0089.
B) CI: (3.2378, 3.5036)
We are 95% sure that the mean GPA for all students with 500 Facebook friends is between 3.2378 and 3.5036.
Unlock Deck
Unlock for access to all 123 flashcards in this deck.
Unlock Deck
k this deck
47
Use the following to answer the questions below:
Data were collected on GPA and number of Facebook friends for students in a small statistics class. Some summary statistics, partial output from the regression analysis, and a scatterplot of the data (with regression line) are provided. Assume that students in this class are typical of all students at the university.
Use three decimal places when reporting the results from any calculations, unless otherwise specified.
-The correlation between GPA and number of Facebook friends is -0.686. Use the correlation and α = 0.05 to test for a linear association between GPA and number of Facebook friends. Include all details of the test.
Unlock Deck
Unlock for access to all 123 flashcards in this deck.
Unlock Deck
k this deck
48
Use the following to answer the questions below:
Data were collected on GPA and number of Facebook friends for students in a small statistics class. Some summary statistics, partial output from the regression analysis, and a scatterplot of the data (with regression line) are provided. Assume that students in this class are typical of all students at the university.
Use three decimal places when reporting the results from any calculations, unless otherwise specified.
-The correlation between GPA and number of Facebook friends is -0.686. Use the correlation and α = 0.05 to test for a negative linear association between GPA and number of Facebook friends. Include all details of the test.
Unlock Deck
Unlock for access to all 123 flashcards in this deck.
Unlock Deck
k this deck
49
Use the following to answer the questions below:
Data were collected on GPA and number of Facebook friends for students in a small statistics class. Some summary statistics, partial output from the regression analysis, and a scatterplot of the data (with regression line) are provided. Assume that students in this class are typical of all students at the university.
Use three decimal places when reporting the results from any calculations, unless otherwise specified.
-Use the information in the computer output to compute the standard error of the slope, SE. Round the answer to six decimal places.
A) 0.000184
B) 0.000183
C) 0.000992
D) 0.000993
Unlock Deck
Unlock for access to all 123 flashcards in this deck.
Unlock Deck
k this deck
50
Use the following to answer the questions below:
Data were collected on GPA and number of Facebook friends for students in a small statistics class. Some summary statistics, partial output from the regression analysis, and a scatterplot of the data (with regression line) are provided. Assume that students in this class are typical of all students at the university.
Use three decimal places when reporting the results from any calculations, unless otherwise specified.
-Compute the t test statistic for the slope.
A) -4.989
B) -5.022
C) -5.465
D) - 5.479
Unlock Deck
Unlock for access to all 123 flashcards in this deck.
Unlock Deck
k this deck
51
Use the following to answer the questions below:
Data were collected on the age (in years) and price (in thousands of dollars) of a random sample of 25 used Hyundai Elantras. A scatterplot of the data (with regression line) and computer output from a regression analysis are provided.
Use three decimal places when reporting the results from any calculations, unless otherwise specified.
The regression equation is Price = 15.3 - 1.71 Age
-Use the scatterplot to determine whether we should have any serious concerns about the conditions being met for using a linear model with these data.
Unlock Deck
Unlock for access to all 123 flashcards in this deck.
Unlock Deck
k this deck
52
Use the following to answer the questions below:
Data were collected on the age (in years) and price (in thousands of dollars) of a random sample of 25 used Hyundai Elantras. A scatterplot of the data (with regression line) and computer output from a regression analysis are provided.
Use three decimal places when reporting the results from any calculations, unless otherwise specified.
The regression equation is Price = 15.3 - 1.71 Age
-What is the estimated slope in this regression model? Interpret the slope in context.
A) The estimated slope is -1.71.
For each additional year of age, the predicted price of the car (used Hyundai Elantra) decreases by $1,710.
B) The estimated slope is -1.71.
For each additional year of age, the predicted price of the car (used Hyundai Elantra) decreases by $1.71.
C) The estimated slope is 15.3.
The cost of a new used Hyundai Elantra is approximately $15,300.
D) The estimated slope is 15.3.
For each additional year of age, the predicted price of the car (used Hyundai Elantra) decreases by $1530.
Unlock Deck
Unlock for access to all 123 flashcards in this deck.
Unlock Deck
k this deck
53
Use the following to answer the questions below:
Data were collected on the age (in years) and price (in thousands of dollars) of a random sample of 25 used Hyundai Elantras. A scatterplot of the data (with regression line) and computer output from a regression analysis are provided.
Use three decimal places when reporting the results from any calculations, unless otherwise specified.
The regression equation is Price = 15.3 - 1.71 Age
-Use the equation of the least squares line to predict the price of a used Hyundai Elantra that is 6 years old.
A) $5,040
B) $13,540
C) $6,750
D) $7,750
Unlock Deck
Unlock for access to all 123 flashcards in this deck.
Unlock Deck
k this deck
54
Use the following to answer the questions below:
Data were collected on the age (in years) and price (in thousands of dollars) of a random sample of 25 used Hyundai Elantras. A scatterplot of the data (with regression line) and computer output from a regression analysis are provided.
Use three decimal places when reporting the results from any calculations, unless otherwise specified.
The regression equation is Price = 15.3 - 1.71 Age
-What are the degrees of freedom for constructing a confidence interval for, or performing a test about, the population slope?
A) 25
B) 24
C) 23
D) 22
Unlock Deck
Unlock for access to all 123 flashcards in this deck.
Unlock Deck
k this deck
55
Use the following to answer the questions below:
Data were collected on the age (in years) and price (in thousands of dollars) of a random sample of 25 used Hyundai Elantras. A scatterplot of the data (with regression line) and computer output from a regression analysis are provided.
Use three decimal places when reporting the results from any calculations, unless otherwise specified.
The regression equation is Price = 15.3 - 1.71 Age
-Use the computer output to test the slope to determine whether age is an effective predictor of price. Use = 0.05.
A) There is very strong evidence that age is an effective predictor of price.
B) There is not enough evidence to conclude that age is an effective predictor of price.
Unlock Deck
Unlock for access to all 123 flashcards in this deck.
Unlock Deck
k this deck
56
Use the following to answer the questions below:
Data were collected on the age (in years) and price (in thousands of dollars) of a random sample of 25 used Hyundai Elantras. A scatterplot of the data (with regression line) and computer output from a regression analysis are provided.
Use three decimal places when reporting the results from any calculations, unless otherwise specified.
The regression equation is Price = 15.3 - 1.71 Age
-Construct and interpret a 90% confidence interval for the population slope.
Unlock Deck
Unlock for access to all 123 flashcards in this deck.
Unlock Deck
k this deck
57
Use the following to answer the questions below:
Data were collected on the age (in years) and price (in thousands of dollars) of a random sample of 25 used Hyundai Elantras. A scatterplot of the data (with regression line) and computer output from a regression analysis are provided.
Use three decimal places when reporting the results from any calculations, unless otherwise specified.
The regression equation is Price = 15.3 - 1.71 Age
-What is the for this model? Interpret it in context.
Data were collected on the age (in years) and price (in thousands of dollars) of a random sample of 25 used Hyundai Elantras. A scatterplot of the data (with regression line) and computer output from a regression analysis are provided.
Use three decimal places when reporting the results from any calculations, unless otherwise specified.
The regression equation is Price = 15.3 - 1.71 Age
-What is the
for this model? Interpret it in context. Unlock Deck
Unlock for access to all 123 flashcards in this deck.
Unlock Deck
k this deck
58
Use the following to answer the questions below:
Data were collected on the age (in years) and price (in thousands of dollars) of a random sample of 25 used Hyundai Elantras. A scatterplot of the data (with regression line) and computer output from a regression analysis are provided.
Use three decimal places when reporting the results from any calculations, unless otherwise specified.
The regression equation is Price = 15.3 - 1.71 Age
-Based on the available information, what is the correlation between age and price (in thousands of dollars) of used Hyundai Elantras?
A) 0.943
B) -0.943
C) 9.43
D) -9.43
Unlock Deck
Unlock for access to all 123 flashcards in this deck.
Unlock Deck
k this deck
59
Use the following to answer the questions below:
Data were collected on the age (in years) and price (in thousands of dollars) of a random sample of 25 used Hyundai Elantras. A scatterplot of the data (with regression line) and computer output from a regression analysis are provided.
Use three decimal places when reporting the results from any calculations, unless otherwise specified.
The regression equation is Price = 15.3 - 1.71 Age
-Use the computer output to provide and interpret a 95% interval for the mean price of all 3-year-old used Hyundai Elantras.
Unlock Deck
Unlock for access to all 123 flashcards in this deck.
Unlock Deck
k this deck
60
Use the following to answer the questions below:
Data were collected on the age (in years) and price (in thousands of dollars) of a random sample of 25 used Hyundai Elantras. A scatterplot of the data (with regression line) and computer output from a regression analysis are provided.
Use three decimal places when reporting the results from any calculations, unless otherwise specified.
The regression equation is Price = 15.3 - 1.71 Age
-Use the computer output to provide and interpret a 95% interval for the price of a 3-year-old used Hyundai Elantra.
Unlock Deck
Unlock for access to all 123 flashcards in this deck.
Unlock Deck
k this deck
61
Use the following to answer the questions below:
Data were collected on the mileage (in thousands of miles) and price (in thousands of dollars) of a random sample of used Hyundai Elantras. A scatterplot of the data (with regression line), some summary statistics, and partial computer output from a regression analysis are provided.
Use three decimal places when reporting the results from any calculations, unless otherwise specified.
-Use the scatterplot to determine whether we should have any strong concerns about the conditions being met for using a linear model with these data.
Unlock Deck
Unlock for access to all 123 flashcards in this deck.
Unlock Deck
k this deck
62
Use the following to answer the questions below:
Data were collected on the mileage (in thousands of miles) and price (in thousands of dollars) of a random sample of used Hyundai Elantras. A scatterplot of the data (with regression line), some summary statistics, and partial computer output from a regression analysis are provided.
Use three decimal places when reporting the results from any calculations, unless otherwise specified.
-Use the equation of the least squares line to predict the price of a used Hyundai Elantra with 50,000 miles.
A) 9,240
B) $6,900
C) $12,888
D) $13,344
Unlock Deck
Unlock for access to all 123 flashcards in this deck.
Unlock Deck
k this deck
63
Use the following to answer the questions below:
Data were collected on the mileage (in thousands of miles) and price (in thousands of dollars) of a random sample of used Hyundai Elantras. A scatterplot of the data (with regression line), some summary statistics, and partial computer output from a regression analysis are provided.
Use three decimal places when reporting the results from any calculations, unless otherwise specified.
-Use the provided output to compute
.
A) 0.793
B) 0.672
C) 0.891
D) 0.736
Unlock Deck
Unlock for access to all 123 flashcards in this deck.
Unlock Deck
k this deck
64
Use the following to answer the questions below:
Data were collected on the mileage (in thousands of miles) and price (in thousands of dollars) of a random sample of used Hyundai Elantras. A scatterplot of the data (with regression line), some summary statistics, and partial computer output from a regression analysis are provided.
Use three decimal places when reporting the results from any calculations, unless otherwise specified.
-Use the information in the ANOVA table to determine the number of cars in the sample.
A) 25
B) 24
C) 23
D) 22
Unlock Deck
Unlock for access to all 123 flashcards in this deck.
Unlock Deck
k this deck
65
Use the following to answer the questions below:
Data were collected on the mileage (in thousands of miles) and price (in thousands of dollars) of a random sample of used Hyundai Elantras. A scatterplot of the data (with regression line), some summary statistics, and partial computer output from a regression analysis are provided.
Use three decimal places when reporting the results from any calculations, unless otherwise specified.
-Is the linear model effective at predicting the price of used Hyundai Elantras? Use the information from the computer output and α = 0.05. Include all details of the test.
Unlock Deck
Unlock for access to all 123 flashcards in this deck.
Unlock Deck
k this deck
66
Use the following to answer the questions below:
Data were collected on the mileage (in thousands of miles) and price (in thousands of dollars) of a random sample of used Hyundai Elantras. A scatterplot of the data (with regression line), some summary statistics, and partial computer output from a regression analysis are provided.
Use three decimal places when reporting the results from any calculations, unless otherwise specified.
-Use the provided computer output to compute the standard deviation of the error term.
A) 1.872
B) 3.504
C) 1.832
D) 3.357
Unlock Deck
Unlock for access to all 123 flashcards in this deck.
Unlock Deck
k this deck
67
Use the following to answer the questions below:
Data were collected on the mileage (in thousands of miles) and price (in thousands of dollars) of a random sample of used Hyundai Elantras. A scatterplot of the data (with regression line), some summary statistics, and partial computer output from a regression analysis are provided.
Use three decimal places when reporting the results from any calculations, unless otherwise specified.
-Use the provided output to construct and interpret a 95% interval for the mean price of all used Hyundai Elantras with 50,000 miles.
Unlock Deck
Unlock for access to all 123 flashcards in this deck.
Unlock Deck
k this deck
68
Use the following to answer the questions below:
Data were collected on the mileage (in thousands of miles) and price (in thousands of dollars) of a random sample of used Hyundai Elantras. A scatterplot of the data (with regression line), some summary statistics, and partial computer output from a regression analysis are provided.
Use three decimal places when reporting the results from any calculations, unless otherwise specified.
-Use the provided output to construct and interpret a 95% interval for the price of a single used Hyundai Elantra with 50,000 miles.
Unlock Deck
Unlock for access to all 123 flashcards in this deck.
Unlock Deck
k this deck
69
Use the following to answer the questions below:
Data were collected on the mileage (in thousands of miles) and price (in thousands of dollars) of a random sample of used Hyundai Elantras. A scatterplot of the data (with regression line), some summary statistics, and partial computer output from a regression analysis are provided.
Use three decimal places when reporting the results from any calculations, unless otherwise specified.
-Use the following computer output to identify and interpret a 95% interval for the mean price of all used Hyundai Elantras with 30,000 miles.
Predicted Values for New Observations
A) We are 95% sure that the mean price of all used Hyundai Elantras with 30,000 miles is between $10,058 and $12,022.
B) We are 95% sure that the price of a single used Hyundai Elantra with 30,000 miles is between $7046 and $15,034.
C) We are 95% sure that the price of a single used Hyundai Elantras with 30,000 miles is between $10,058 and $12,022.
D) We are 95% sure that the mean price of all used Hyundai Elantras with 30,000 miles is between $7046 and $15,034.
Unlock Deck
Unlock for access to all 123 flashcards in this deck.
Unlock Deck
k this deck
70
Use the following to answer the questions below:
Data were collected on the mileage (in thousands of miles) and price (in thousands of dollars) of a random sample of used Hyundai Elantras. A scatterplot of the data (with regression line), some summary statistics, and partial computer output from a regression analysis are provided.
Use three decimal places when reporting the results from any calculations, unless otherwise specified.
-Use the following computer output to identify and interpret a 95% interval for the price of a single used Hyundai Elantra with 70,000 miles.
A) We are 95% sure that the price of a single used Hyundai Elantra with 70,000 miles is between $3,440 and $11,347.
B) We are 95% sure that the mean price of all used Hyundai Elantras with 70,000 miles is between $3,440 and $11,347.
C) We are 95% sure that the price of a single used Hyundai Elantra with 70,000 miles is between $6,593 and $8,193.
D) We are 95% sure that the mean price of all used Hyundai Elantras with 70,000 miles is between $6,593 and $8,193.
Unlock Deck
Unlock for access to all 123 flashcards in this deck.
Unlock Deck
k this deck
71
Use the following to answer the questions below:
Data were collected on the mileage (in thousands of miles) and price (in thousands of dollars) of a random sample of used Hyundai Elantras. A scatterplot of the data (with regression line), some summary statistics, and partial computer output from a regression analysis are provided.
Use three decimal places when reporting the results from any calculations, unless otherwise specified.
-Use the information in the computer output to compute the standard error of the slope, SE. Round your answer to four decimal places.
A) 0.0097
B) 0.0099
C) 0.0101
D) 0.0103
Unlock Deck
Unlock for access to all 123 flashcards in this deck.
Unlock Deck
k this deck
72
Use the following to answer the questions below:
Data were collected on the mileage (in thousands of miles) and price (in thousands of dollars) of a random sample of used Hyundai Elantras. A scatterplot of the data (with regression line), some summary statistics, and partial computer output from a regression analysis are provided.
Use three decimal places when reporting the results from any calculations, unless otherwise specified.
-Compute the t test statistic for the slope.
A) -9.402
B) -9.212
C) -9.030
D) -8.854
Unlock Deck
Unlock for access to all 123 flashcards in this deck.
Unlock Deck
k this deck
73
Use the following to answer the questions below:
Fast food restaurants are required to publish nutrition information about the foods they serve. Nutrition information about a random sample of 15 McDonald's lunch/dinner menu items (excluding sides and drinks) was obtained from their website. We wish to use the total fat content (in grams) to better understand the number of calories in the lunch/dinner menu items at McDonald's. Computer output from a regression analysis and a scatterplot (with regression line) of the data are provided.
Use two decimal places when reporting the results from any calculations, unless otherwise specified.
The regression equation is Calories = 137.1 + 15.06 Total Fat (g)
-Using the scatterplot, should we should have any major concerns about the conditions being met for using a linear model with these data?
Unlock Deck
Unlock for access to all 123 flashcards in this deck.
Unlock Deck
k this deck
74
Use the following to answer the questions below:
Fast food restaurants are required to publish nutrition information about the foods they serve. Nutrition information about a random sample of 15 McDonald's lunch/dinner menu items (excluding sides and drinks) was obtained from their website. We wish to use the total fat content (in grams) to better understand the number of calories in the lunch/dinner menu items at McDonald's. Computer output from a regression analysis and a scatterplot (with regression line) of the data are provided.
Use two decimal places when reporting the results from any calculations, unless otherwise specified.
The regression equation is Calories = 137.1 + 15.06 Total Fat (g)
-Use the equation of the least squares line to predict the number of calories in a menu item with 20 grams of fat.
A) 438.30 calories
B) 334.44 calories
C) 289.80 calories
D) 410.60 calories
Unlock Deck
Unlock for access to all 123 flashcards in this deck.
Unlock Deck
k this deck
75
Use the following to answer the questions below:
Fast food restaurants are required to publish nutrition information about the foods they serve. Nutrition information about a random sample of 15 McDonald's lunch/dinner menu items (excluding sides and drinks) was obtained from their website. We wish to use the total fat content (in grams) to better understand the number of calories in the lunch/dinner menu items at McDonald's. Computer output from a regression analysis and a scatterplot (with regression line) of the data are provided.
Use two decimal places when reporting the results from any calculations, unless otherwise specified.
The regression equation is Calories = 137.1 + 15.06 Total Fat (g)
-What is the estimated slope in this regression model?
A) 15.06
B) 16.7
C) -15.06
D) -16.7
Unlock Deck
Unlock for access to all 123 flashcards in this deck.
Unlock Deck
k this deck
76
Use the following to answer the questions below:
Fast food restaurants are required to publish nutrition information about the foods they serve. Nutrition information about a random sample of 15 McDonald's lunch/dinner menu items (excluding sides and drinks) was obtained from their website. We wish to use the total fat content (in grams) to better understand the number of calories in the lunch/dinner menu items at McDonald's. Computer output from a regression analysis and a scatterplot (with regression line) of the data are provided.
Use two decimal places when reporting the results from any calculations, unless otherwise specified.
The regression equation is Calories = 137.1 + 15.06 Total Fat (g)
-What are the degrees of freedom for constructing a confidence interval for, or performing a test about, the population slope?
A) 15
B) 14
C) 13
D) 12
Unlock Deck
Unlock for access to all 123 flashcards in this deck.
Unlock Deck
k this deck
77
Use the following to answer the questions below:
Fast food restaurants are required to publish nutrition information about the foods they serve. Nutrition information about a random sample of 15 McDonald's lunch/dinner menu items (excluding sides and drinks) was obtained from their website. We wish to use the total fat content (in grams) to better understand the number of calories in the lunch/dinner menu items at McDonald's. Computer output from a regression analysis and a scatterplot (with regression line) of the data are provided.
Use two decimal places when reporting the results from any calculations, unless otherwise specified.
The regression equation is Calories = 137.1 + 15.06 Total Fat (g)
-Use the computer output, and α = 0.05, to test the slope to determine whether total fat content (g) is an effective predictor of the number of calories. Include all details of the test.
Unlock Deck
Unlock for access to all 123 flashcards in this deck.
Unlock Deck
k this deck
78
Use the following to answer the questions below:
Fast food restaurants are required to publish nutrition information about the foods they serve. Nutrition information about a random sample of 15 McDonald's lunch/dinner menu items (excluding sides and drinks) was obtained from their website. We wish to use the total fat content (in grams) to better understand the number of calories in the lunch/dinner menu items at McDonald's. Computer output from a regression analysis and a scatterplot (with regression line) of the data are provided.
Use two decimal places when reporting the results from any calculations, unless otherwise specified.
The regression equation is Calories = 137.1 + 15.06 Total Fat (g)
-Construct and interpret a 99% confidence interval for the population slope.
Unlock Deck
Unlock for access to all 123 flashcards in this deck.
Unlock Deck
k this deck
79
Use the following to answer the questions below:
Fast food restaurants are required to publish nutrition information about the foods they serve. Nutrition information about a random sample of 15 McDonald's lunch/dinner menu items (excluding sides and drinks) was obtained from their website. We wish to use the total fat content (in grams) to better understand the number of calories in the lunch/dinner menu items at McDonald's. Computer output from a regression analysis and a scatterplot (with regression line) of the data are provided.
Use two decimal places when reporting the results from any calculations, unless otherwise specified.
The regression equation is Calories = 137.1 + 15.06 Total Fat (g)
-What is the for this model? Interpret it in context.
A) = 86.5%
86)5% of the variability in the number of calories for lunch/dinner menu items in this sample is explained by the total fat content (g).
B) = 86.5%
86)5% of the variability in the the total fat content in this sample is explained by the number of calories.
C) = 85.5% 85.5% of the variability in the number of calories for lunch/dinner menu items in this sample is explained by the total fat content (g).
D) = 85.5% 85.5% of the variability in the the total fat content in this sample is explained by the number of calories.
Fast food restaurants are required to publish nutrition information about the foods they serve. Nutrition information about a random sample of 15 McDonald's lunch/dinner menu items (excluding sides and drinks) was obtained from their website. We wish to use the total fat content (in grams) to better understand the number of calories in the lunch/dinner menu items at McDonald's. Computer output from a regression analysis and a scatterplot (with regression line) of the data are provided.
Use two decimal places when reporting the results from any calculations, unless otherwise specified.
The regression equation is Calories = 137.1 + 15.06 Total Fat (g)
-What is the
for this model? Interpret it in context.A)
= 86.5%86)5% of the variability in the number of calories for lunch/dinner menu items in this sample is explained by the total fat content (g).
B)
= 86.5%86)5% of the variability in the the total fat content in this sample is explained by the number of calories.
C)
= 85.5% 85.5% of the variability in the number of calories for lunch/dinner menu items in this sample is explained by the total fat content (g).D)
= 85.5% 85.5% of the variability in the the total fat content in this sample is explained by the number of calories. Unlock Deck
Unlock for access to all 123 flashcards in this deck.
Unlock Deck
k this deck
80
Use the following to answer the questions below:
Fast food restaurants are required to publish nutrition information about the foods they serve. Nutrition information about a random sample of 15 McDonald's lunch/dinner menu items (excluding sides and drinks) was obtained from their website. We wish to use the total fat content (in grams) to better understand the number of calories in the lunch/dinner menu items at McDonald's. Computer output from a regression analysis and a scatterplot (with regression line) of the data are provided.
Use two decimal places when reporting the results from any calculations, unless otherwise specified.
The regression equation is Calories = 137.1 + 15.06 Total Fat (g)
-Based on the available information, what is the correlation between total fat content (g) and number of calories for McDonald's lunch/dinner menu items in this sample?
A) 0.93
B) -0.93
C) 9.3
D) -9.3
Unlock Deck
Unlock for access to all 123 flashcards in this deck.
Unlock Deck
k this deck
Unlock Deck
Unlock for access to all 123 flashcards in this deck.


