Deck 8: Anova to Compare Means
Full screen (f)
Question
Use the following to answer the questions below:
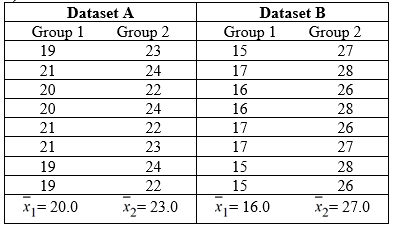
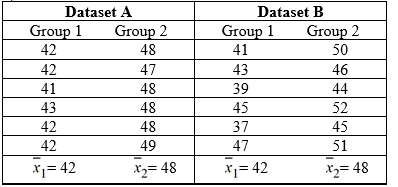
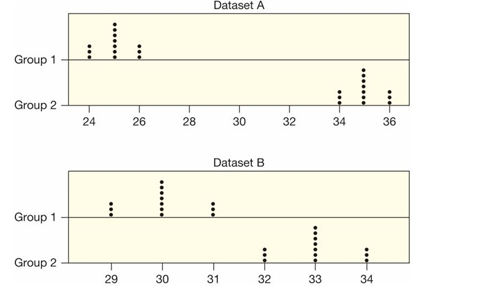
Two sets of sample data, A and B, are given. Without doing any calculations, indicate in which set of sample data, A or B, there is likely to be stronger evidence of a difference in the population means.
-
A) Dataset A
B) Dataset B
Two sets of sample data, A and B, are given. Without doing any calculations, indicate in which set of sample data, A or B, there is likely to be stronger evidence of a difference in the population means.
-
A) Dataset A
B) Dataset B
Question
Use the following to answer the questions below:
Two sets of sample data, A and B, are given. Without doing any calculations, indicate in which set of sample data, A or B, there is likely to be stronger evidence of a difference in the population means.
-
A) Dataset A
B) Dataset B
Two sets of sample data, A and B, are given. Without doing any calculations, indicate in which set of sample data, A or B, there is likely to be stronger evidence of a difference in the population means.
-
A) Dataset A
B) Dataset B
Question
Question
Use the following to answer the questions below:
Two sets of sample data, A and B, are given. Without doing any calculations, indicate in which set of sample data, A or B, there is likely to be stronger evidence of a difference in the population means.
-Some computer output from an analysis of variance is provided.
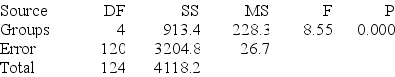
How many groups are there?
A) 3
B) 4
C) 5
D) 6
Two sets of sample data, A and B, are given. Without doing any calculations, indicate in which set of sample data, A or B, there is likely to be stronger evidence of a difference in the population means.
-Some computer output from an analysis of variance is provided.
How many groups are there?
A) 3
B) 4
C) 5
D) 6
Question
Use the following to answer the questions below:
Two sets of sample data, A and B, are given. Without doing any calculations, indicate in which set of sample data, A or B, there is likely to be stronger evidence of a difference in the population means.
-Some computer output from an analysis of variance is provided.

What is the overall sample size?
A) 125
B) 124
C) 123
D) 121
Two sets of sample data, A and B, are given. Without doing any calculations, indicate in which set of sample data, A or B, there is likely to be stronger evidence of a difference in the population means.
-Some computer output from an analysis of variance is provided.
What is the overall sample size?
A) 125
B) 124
C) 123
D) 121
Question
Use the following to answer the questions below:
Two sets of sample data, A and B, are given. Without doing any calculations, indicate in which set of sample data, A or B, there is likely to be stronger evidence of a difference in the population means.
-A scientist performing analysis of variance has the following null hypothesis:
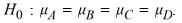
What is the appropriate alternative hypothesis for his analysis?
A) :
: 


 .
.
B) :
:  >
>  >
>  >
>  .
.
C) :
:  <
<  <
<  <
<  .
.
D) : At least one
Two sets of sample data, A and B, are given. Without doing any calculations, indicate in which set of sample data, A or B, there is likely to be stronger evidence of a difference in the population means.
-A scientist performing analysis of variance has the following null hypothesis:
What is the appropriate alternative hypothesis for his analysis?
A)
: .B)
: > > > .C)
: < < < .D)
: At least one Question
Question
Use the following to answer the questions below:
The sample sizes for the groups in a dataset and an outline of an analysis of variance table with partial information are provided. Fill in the missing parts of the table. Round decimal answers to two decimal places.
-Three groups with = 10,
= 10,  = 10, and
  = 10.
= 10.
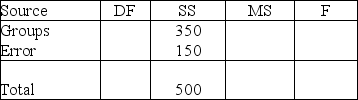
The sample sizes for the groups in a dataset and an outline of an analysis of variance table with partial information are provided. Fill in the missing parts of the table. Round decimal answers to two decimal places.
-Three groups with
= 10, = 10, and = 10. Question
Use the following to answer the questions below:
The sample sizes for the groups in a dataset and an outline of an analysis of variance table with partial information are provided. Fill in the missing parts of the table. Round decimal answers to two decimal places.
-Four groups with = 6,
= 6,  = 5,
= 5,  = 5, and
  = 4.
= 4.
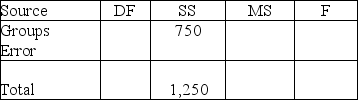
The sample sizes for the groups in a dataset and an outline of an analysis of variance table with partial information are provided. Fill in the missing parts of the table. Round decimal answers to two decimal places.
-Four groups with
= 6, = 5, = 5, and = 4. Question
Use the following to answer the questions below:
The sample sizes for the groups in a dataset and an outline of an analysis of variance table with partial information are provided. Fill in the missing parts of the table. Round decimal answers to two decimal places.
-Three groups with = 8,
= 8,  = 7, and
  = 5.
= 5.
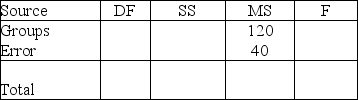
The sample sizes for the groups in a dataset and an outline of an analysis of variance table with partial information are provided. Fill in the missing parts of the table. Round decimal answers to two decimal places.
-Three groups with
= 8, = 7, and = 5. Question
Use the following to answer the questions below:
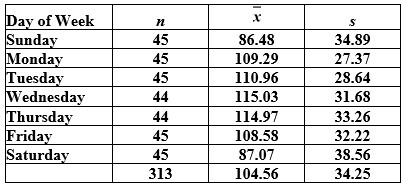
A small university is concerned with monitoring its electricity usage in its Student Center. Specifically, its officials want to know if the amount of electricity used differs by day of the week. They collected data for nearly a year, and the relevant summary statistics are provided. Note that electricity usage is measured in kilowatt hours.
?
-State the appropriate null and alternative hypotheses for this test.
A)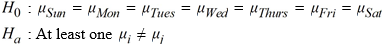
B)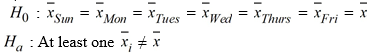
C)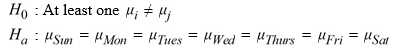
D)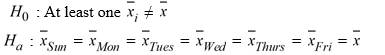
Question
Use the following to answer the questions below:
A small university is concerned with monitoring its electricity usage in its Student Center. Specifically, its officials want to know if the amount of electricity used differs by day of the week. They collected data for nearly a year, and the relevant summary statistics are provided. Note that electricity usage is measured in kilowatt hours.
?
-Are the conditions for using ANOVA reasonably satisfied?
Question
Use the following to answer the questions below:
A small university is concerned with monitoring its electricity usage in its Student Center. Specifically, its officials want to know if the amount of electricity used differs by day of the week. They collected data for nearly a year, and the relevant summary statistics are provided. Note that electricity usage is measured in kilowatt hours.
?
-Complete the ANOVA table below for doing this test using the template started below. Use two decimal places in the F statistic.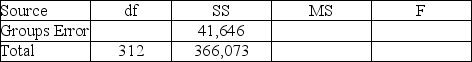
A)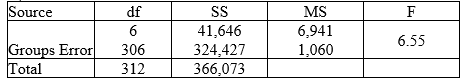
B)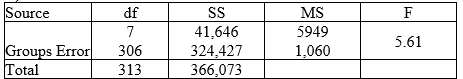
C)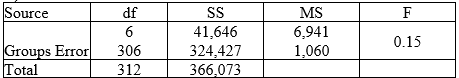
D)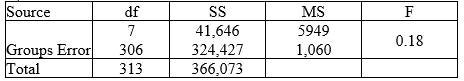
Question
Use the following to answer the questions below:
A small university is concerned with monitoring its electricity usage in its Student Center. Specifically, its officials want to know if the amount of electricity used differs by day of the week. They collected data for nearly a year, and the relevant summary statistics are provided. Note that electricity usage is measured in kilowatt hours.
?
-Use the F-distribution to find the p-value for the test. Using = 0.05, does the mean electricity usage differ significantly by day of the week? Make a conclusion in context.
A) There is very strong evidence that mean electricity usage differs significantly by day of the week (i.e., some days of the week use more electricity than others).
B) There is not enough evidence to conclude that mean electricity usage differs significantly by day of the week (i.e., some days of the week use more electricity than others).
Question
Use the following to answer the questions below:
A small university is concerned with monitoring its electricity usage in its Student Center. Specifically, its officials want to know if the amount of electricity used differs by day of the week. They collected data for nearly a year, and the relevant summary statistics are provided. Note that electricity usage is measured in kilowatt hours.
?
-Using the results from the ANOVA analysis, at an = 0.05 level of confidence, what is the conclusion of the test, in context?
A) There is very strong evidence that mean electricity usage differs significantly by day of the week (i.e., some days of the week use more electricity than others).
B) There is not enough evidence to conclude that mean electricity usage differs significantly by day of the week (i.e., some days of the week use more electricity than others).
Question
Use the following to answer the questions below:
A small university is concerned with monitoring its electricity usage in its Student Center. Specifically, its officials want to know if the amount of electricity used differs by day of the week. They collected data for nearly a year, and the relevant summary statistics are provided. Note that electricity usage is measured in kilowatt hours.
?
-Use the data and ANOVA results to construct a 95% confidence interval for the difference in mean electricity use between Saturdays and Sundays. Round the margin of error to two decimal places. Does your interval suggest a significant difference in mean electricity use for these two days?
A) -12.92 to 14.10
There is no evidence that electricity use differs significantly on Saturdays and Sundays.
B) -12.92 to 14.10
There is strong evidence that electricity use differs significantly on Saturdays and Sundays.
C) -11.09 to 12.27
There is no evidence that electricity use differs significantly on Saturdays and Sundays.
D) -11.09 to 12/27
There is strong evidence that electricity use differs significantly on Saturdays and Sundays.
Question
Use the following to answer the questions below:
A small university is concerned with monitoring its electricity usage in its Student Center. Specifically, its officials want to know if the amount of electricity used differs by day of the week. They collected data for nearly a year, and the relevant summary statistics are provided. Note that electricity usage is measured in kilowatt hours.
-Based on the ANOVA results, test at the 5% level whether the data provide evidence of a difference in mean electricity use on Sundays and Mondays. Use three decimal places in the test statistic.
Question
Use the following to answer the questions below:
A small university is concerned with monitoring its electricity usage in its Student Center. Specifically, its officials want to know if the amount of electricity used differs by day of the week. They collected data for nearly a year, and the relevant summary statistics are provided. Note that electricity usage is measured in kilowatt hours.
?
-Computer output provides the following grouping information:
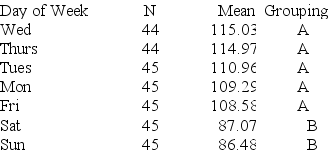
Means that do not share a letter are significantly different.
Use the output to make a statement about how electricity usage differs significantly by day of the week.
A) Significantly less electricity is used on weekends than on weekdays.
B) There is not enough evidence to conclude that electricity usage on weekends is different than electricity usage on weekdays.
A small university is concerned with monitoring its electricity usage in its Student Center. Specifically, its officials want to know if the amount of electricity used differs by day of the week. They collected data for nearly a year, and the relevant summary statistics are provided. Note that electricity usage is measured in kilowatt hours.
?
-Computer output provides the following grouping information:
Means that do not share a letter are significantly different.
Use the output to make a statement about how electricity usage differs significantly by day of the week.
A) Significantly less electricity is used on weekends than on weekdays.
B) There is not enough evidence to conclude that electricity usage on weekends is different than electricity usage on weekdays.
Question
Use the following to answer the questions below:
Penalties in ice hockey occur when a player breaks one of the rules of the game. In most cases, when a penalty occurs, the offending player is placed in the penalty box (the length of time spent in the penalty box depends on the severity of the penalty), and the team has to play with fewer people on the ice, which can result in an advantage for the opposing team. The number of penalties per game for several randomly selected games are displayed for three college men's ice hockey teams.
?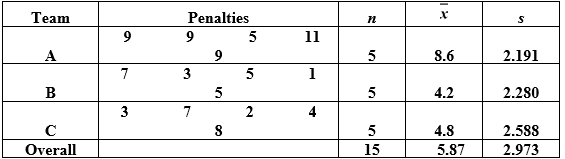
-Use the summary information to compute the three sums of squares needed for using ANOVA to test for a difference in mean number of penalties among these three teams. Round each to two decimal places.
A) SSG = 56.93
SSE = 66.79
SSTotal = 123.74
B) SSG = 40.28
SSE = 83.46
SSTotal = 123.74
C) SSG = 65.79
SSE = 66.79
SSTotal = 132.58
D) SSG = 49.12
SSE = 83.46
SSTotal = 132.58
Question
Use the following to answer the questions below:
Penalties in ice hockey occur when a player breaks one of the rules of the game. In most cases, when a penalty occurs, the offending player is placed in the penalty box (the length of time spent in the penalty box depends on the severity of the penalty), and the team has to play with fewer people on the ice, which can result in an advantage for the opposing team. The number of penalties per game for several randomly selected games are displayed for three college men's ice hockey teams.
-Construct the ANOVA table and test, at the 5% significance level, for a difference in mean number of penalties among these three hockey teams. Use two decimal places when rounding decimal values. Include the details of your test.
Question
Use the following to answer the questions below:
Penalties in ice hockey occur when a player breaks one of the rules of the game. In most cases, when a penalty occurs, the offending player is placed in the penalty box (the length of time spent in the penalty box depends on the severity of the penalty), and the team has to play with fewer people on the ice, which can result in an advantage for the opposing team. The number of penalties per game for several randomly selected games are displayed for three college men's ice hockey teams.
?
-ANOVA output gives a p-value of 0.025 for the difference in mean number of penalties among the three teams. Using = 0.05, what is the conclusion of the test in context?
A) There is evidence of a significance difference in mean number of penalties among the three teams.
B) There is not enough evidence to conclude that there is a significance difference in mean number of penalties among the three teams.
Question
Use the following to answer the questions below:
Penalties in ice hockey occur when a player breaks one of the rules of the game. In most cases, when a penalty occurs, the offending player is placed in the penalty box (the length of time spent in the penalty box depends on the severity of the penalty), and the team has to play with fewer people on the ice, which can result in an advantage for the opposing team. The number of penalties per game for several randomly selected games are displayed for three college men's ice hockey teams.
-Use the summary information and results from the ANOVA to construct 95% confidence intervals for the differences in each pair of means:
(a) Team A and Team B
(b) Team A and Team C
(c) Team B and Team C
In each case, round the margin of error to two decimal places. Based on your work, which teams have significantly different means? Briefly justify your answer.
Question
Use the following to answer the questions below:
Penalties in ice hockey occur when a player breaks one of the rules of the game. In most cases, when a penalty occurs, the offending player is placed in the penalty box (the length of time spent in the penalty box depends on the severity of the penalty), and the team has to play with fewer people on the ice, which can result in an advantage for the opposing team. The number of penalties per game for several randomly selected games are displayed for three college men's ice hockey teams.
?
-Computer output provides the following information about the pairwise differences:
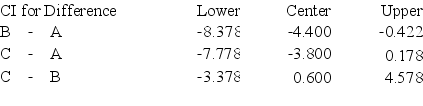
Based on this output, which teams have significantly different means?
A) Teams A and B
B) Teams A and B; Teams A and C
C) Teams A and C
D) All three teams have significantly different means
Penalties in ice hockey occur when a player breaks one of the rules of the game. In most cases, when a penalty occurs, the offending player is placed in the penalty box (the length of time spent in the penalty box depends on the severity of the penalty), and the team has to play with fewer people on the ice, which can result in an advantage for the opposing team. The number of penalties per game for several randomly selected games are displayed for three college men's ice hockey teams.
?
-Computer output provides the following information about the pairwise differences:
Based on this output, which teams have significantly different means?
A) Teams A and B
B) Teams A and B; Teams A and C
C) Teams A and C
D) All three teams have significantly different means
Question
Use the following to answer the questions below:
Penalties in ice hockey occur when a player breaks one of the rules of the game. In most cases, when a penalty occurs, the offending player is placed in the penalty box (the length of time spent in the penalty box depends on the severity of the penalty), and the team has to play with fewer people on the ice, which can result in an advantage for the opposing team. The number of penalties per game for several randomly selected games are displayed for three college men's ice hockey teams.
?
-Computer output provides the following grouping information:
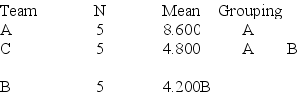
Means that do not share a letter are significantly different.
Based on this output, which teams have significantly different means?
A) Teams A and B
B) Teams A and B; Teams A and C
C) Teams A and C
D) All three teams have significantly different means
Penalties in ice hockey occur when a player breaks one of the rules of the game. In most cases, when a penalty occurs, the offending player is placed in the penalty box (the length of time spent in the penalty box depends on the severity of the penalty), and the team has to play with fewer people on the ice, which can result in an advantage for the opposing team. The number of penalties per game for several randomly selected games are displayed for three college men's ice hockey teams.
?
-Computer output provides the following grouping information:
Means that do not share a letter are significantly different.
Based on this output, which teams have significantly different means?
A) Teams A and B
B) Teams A and B; Teams A and C
C) Teams A and C
D) All three teams have significantly different means
Question
Use the following to answer the questions below:
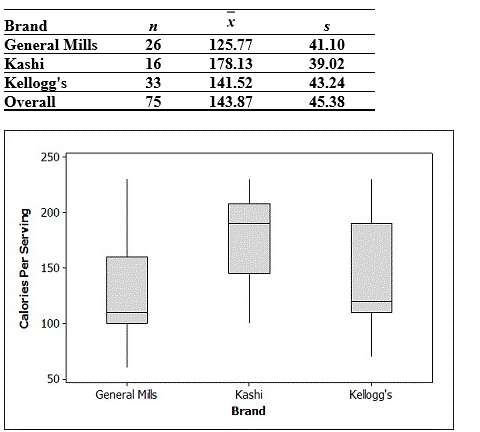
Breakfast is often considered to be the most important meal of the day. Data on the number of calories per serving for randomly selected cereals from three different brands (General Mills, Kellogg's, and Kashi) are summarized in the provided plot and table.
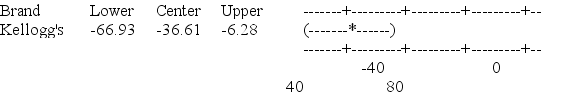
-State the appropriate null and alternative hypotheses for testing if the mean calories per serving differs among the three brands.
A)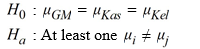
B)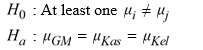
C)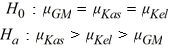
D)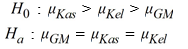
Breakfast is often considered to be the most important meal of the day. Data on the number of calories per serving for randomly selected cereals from three different brands (General Mills, Kellogg's, and Kashi) are summarized in the provided plot and table.
-State the appropriate null and alternative hypotheses for testing if the mean calories per serving differs among the three brands.
A)
B)
C)
D)
Question
Use the following to answer the questions below:
Breakfast is often considered to be the most important meal of the day. Data on the number of calories per serving for randomly selected cereals from three different brands (General Mills, Kellogg's, and Kashi) are summarized in the provided plot and table.
-Are the conditions for using ANOVA reasonably satisfied?
Question
Use the following to answer the questions below:
Breakfast is often considered to be the most important meal of the day. Data on the number of calories per serving for randomly selected cereals from three different brands (General Mills, Kellogg's, and Kashi) are summarized in the provided plot and table.
-Computer analysis gives a p-value of 0.001. Using = 0.05, what is the conclusion of the test, in context?
A) There is very strong evidence that the mean calories per serving is not the same for all three brands.
B) There is not enough evidence to conclude that the mean calories per serving is not the same for all three brands.
Question
Use the following to answer the questions below:
Breakfast is often considered to be the most important meal of the day. Data on the number of calories per serving for randomly selected cereals from three different brands (General Mills, Kellogg's, and Kashi) are summarized in the provided plot and table.
-Use the summary information and the fact that the sums of squares for groups is SSG = 27,476 and for error is SSTotal = 152,379 to complete an ANOVA table and find the F-statistic. Round decimal answers to two decimal places.
Question
Use the following to answer the questions below:
Breakfast is often considered to be the most important meal of the day. Data on the number of calories per serving for randomly selected cereals from three different brands (General Mills, Kellogg's, and Kashi) are summarized in the provided plot and table.
-Use the summary information and the fact that the sums of squares for groups is SSG = 27,476 and for error is SSTotal = 152,379 to complete an ANOVA table and find the F-statistic. Use the F-distribution to find the p-value and state the conclusion of the test in context (using ).
).
A) p-value = 0.00078
There is very strong evidence that the mean calories per serving differs significantly among the three brands.
B) p-value = 0.00078
There is not enough evidence to conclude that the mean calories per serving differs significantly among the three brands.
C) p-value = 0.078
There is very strong evidence that the mean calories per serving differs significantly among the three brands.
D) p-value = 0.078
There is not enough evidence to conclude that the mean calories per serving differs significantly among the three brands.
Breakfast is often considered to be the most important meal of the day. Data on the number of calories per serving for randomly selected cereals from three different brands (General Mills, Kellogg's, and Kashi) are summarized in the provided plot and table.
-Use the summary information and the fact that the sums of squares for groups is SSG = 27,476 and for error is SSTotal = 152,379 to complete an ANOVA table and find the F-statistic. Use the F-distribution to find the p-value and state the conclusion of the test in context (using
).A) p-value = 0.00078
There is very strong evidence that the mean calories per serving differs significantly among the three brands.
B) p-value = 0.00078
There is not enough evidence to conclude that the mean calories per serving differs significantly among the three brands.
C) p-value = 0.078
There is very strong evidence that the mean calories per serving differs significantly among the three brands.
D) p-value = 0.078
There is not enough evidence to conclude that the mean calories per serving differs significantly among the three brands.
Question
Use the following to answer the questions below:
Breakfast is often considered to be the most important meal of the day. Data on the number of calories per serving for randomly selected cereals from three different brands (General Mills, Kellogg's, and Kashi) are summarized in the provided plot and table.
-Computer output from Minitab is provides the following information about the pairwise differences: Brand = General Mills subtracted from:
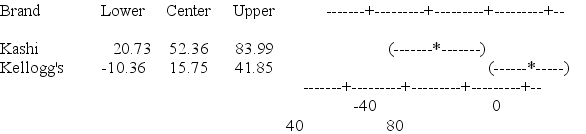
Brand = Kashi subtracted from:
Based on this output, which brands have significantly different means?
A) Kashi and General Mills have significantly different means.
Kashi and Kellogg's have significantly different means.
Kellogg's and General Mills are not significantly different.
B) Kashi and General Mills have significantly different means.
Kashi and Kellogg's are not significantly different.
Kellogg's and General Mills are not significantly different.
C) Kashi and General Mills are not significantly different.
Kashi and Kellogg's are not significantly different.
Kellogg's and General Mills are not significantly different.
D) Kashi and General Mills are not significantly different.
Kashi and Kellogg's have significantly different means.
Kellogg's and General Mills have significantly different means.
Breakfast is often considered to be the most important meal of the day. Data on the number of calories per serving for randomly selected cereals from three different brands (General Mills, Kellogg's, and Kashi) are summarized in the provided plot and table.
-Computer output from Minitab is provides the following information about the pairwise differences: Brand = General Mills subtracted from:
Brand = Kashi subtracted from:
Based on this output, which brands have significantly different means?
A) Kashi and General Mills have significantly different means.
Kashi and Kellogg's have significantly different means.
Kellogg's and General Mills are not significantly different.
B) Kashi and General Mills have significantly different means.
Kashi and Kellogg's are not significantly different.
Kellogg's and General Mills are not significantly different.
C) Kashi and General Mills are not significantly different.
Kashi and Kellogg's are not significantly different.
Kellogg's and General Mills are not significantly different.
D) Kashi and General Mills are not significantly different.
Kashi and Kellogg's have significantly different means.
Kellogg's and General Mills have significantly different means.
Question
Use the following to answer the questions below:
Breakfast is often considered to be the most important meal of the day. Data on the number of calories per serving for randomly selected cereals from three different brands (General Mills, Kellogg's, and Kashi) are summarized in the provided plot and table.
-Computer output provides the following grouping information:

Means that do not share a letter are significantly different.
Based on this output, which brands have significantly different means? Briefly justify your answer.
Breakfast is often considered to be the most important meal of the day. Data on the number of calories per serving for randomly selected cereals from three different brands (General Mills, Kellogg's, and Kashi) are summarized in the provided plot and table.
-Computer output provides the following grouping information:
Means that do not share a letter are significantly different.
Based on this output, which brands have significantly different means? Briefly justify your answer.
Question
Use the following to answer the questions below:
Breakfast is often considered to be the most important meal of the day. Data on the number of calories per serving for randomly selected cereals from three different brands (General Mills, Kellogg's, and Kashi) are summarized in the provided plot and table.
-Use the summary information and the fact that the sums of squares for groups is SSG = 27,476 and for error is SSTotal = 152,379 to test for significant differences (using
 ) in each pair of means:
(a) General Mills and Kashi
(b) General Mills and Kellogg's
(c) Kashi and Kellogg's
In each case, round the test statistic to three decimal places. Based on your work, which brands have significantly different means? Briefly justify your answer.
Breakfast is often considered to be the most important meal of the day. Data on the number of calories per serving for randomly selected cereals from three different brands (General Mills, Kellogg's, and Kashi) are summarized in the provided plot and table.
-Use the summary information and the fact that the sums of squares for groups is SSG = 27,476 and for error is SSTotal = 152,379 to test for significant differences (using
) in each pair of means:(a) General Mills and Kashi
(b) General Mills and Kellogg's
(c) Kashi and Kellogg's
In each case, round the test statistic to three decimal places. Based on your work, which brands have significantly different means? Briefly justify your answer.
Question
Use the following to answer the questions below:
Breakfast is often considered to be the most important meal of the day. Data on the amount of sugar (g) per serving for randomly selected cereals from three different brands (General Mills, Kellogg's, and Kashi) are summarized in the provided plot and table.
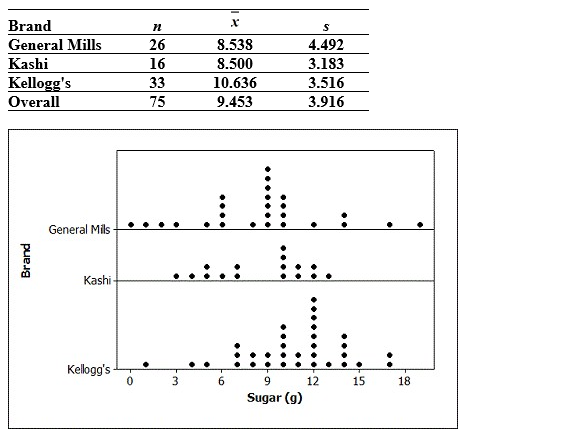
-Are the conditions for using ANOVA reasonably satisfied?
Breakfast is often considered to be the most important meal of the day. Data on the amount of sugar (g) per serving for randomly selected cereals from three different brands (General Mills, Kellogg's, and Kashi) are summarized in the provided plot and table.
-Are the conditions for using ANOVA reasonably satisfied?
Question
Use the following to answer the questions below:
Breakfast is often considered to be the most important meal of the day. Data on the amount of sugar (g) per serving for randomly selected cereals from three different brands (General Mills, Kellogg's, and Kashi) are summarized in the provided plot and table.
-Computer output from the analysis gives a p-value of 0.066. Test, at the 5% level, if there is evidence that the average amount of sugar per serving differs significantly among the three brands.
A) There is no evidence that the average amount of sugar per serving differs significantly among the three brands.
B) The average amount of sugar per serving differs significantly between Kellogg's and Kashi.
C) Kellogg's average amount of sugar per serving id significantly greater than both Kashi and General Mills.
D) The average amount of sugar per serving differs significantly among the three brands.
Question
Use the following to answer the questions below:
Breakfast is often considered to be the most important meal of the day. Data on the amount of sugar (g) per serving for randomly selected cereals from three different brands (General Mills, Kellogg's, and Kashi) are summarized in the provided plot and table.
-Use the summary information to compute the three sums of squares needed for using ANOVA to test for a difference in the mean amount of calories per serving among the three brands. Round each to two decimal places.
Question
Use the following to answer the questions below:
Breakfast is often considered to be the most important meal of the day. Data on the amount of sugar (g) per serving for randomly selected cereals from three different brands (General Mills, Kellogg's, and Kashi) are summarized in the provided plot and table.
-Construct the ANOVA table and test, at the 5% significance level, for a difference in mean amount of sugar among the three brands. Use two decimal places in all decimal values. Is there enough evidence to conclude that the average amount of sugar per serving differs significantly among the three brands.
Question
Use the following to answer the questions below:
Breakfast is often considered to be the most important meal of the day. Data on the amount of sugar (g) per serving for randomly selected cereals from three different brands (General Mills, Kellogg's, and Kashi) are summarized in the provided plot and table.
-Should you conduct inference after the ANOVA to investigate differences among the pairs of means in this situation? Briefly explain why or why not.
Question
Use the following to answer the questions below:
An environmental studies student working on an independent research project was investigating metal contamination in the St. Lawrence River. The metals can accumulate in organisms that live in the river (known as bioaccumulation). He collected samples of Quagga mussels at three sites in the St. Lawrence River and measured the concentration of copper (in micrograms per gram, ?g/g or mcg/g) in the mussels. His data are summarized in the provided table and plot. He wants to know if there are any significant differences in mean copper concentration among the three sites.
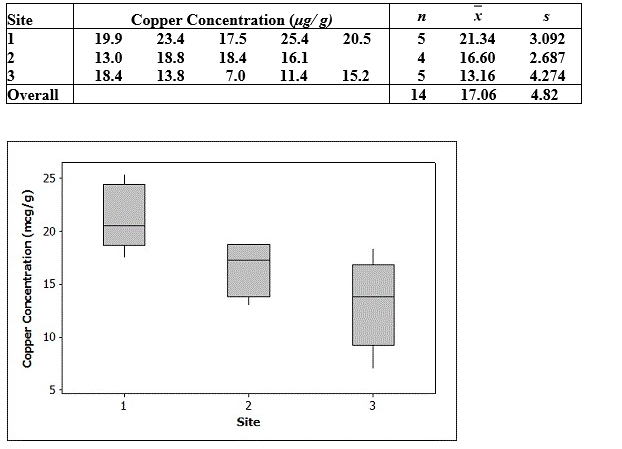
-Are the conditions for using ANOVA reasonably satisfied?
An environmental studies student working on an independent research project was investigating metal contamination in the St. Lawrence River. The metals can accumulate in organisms that live in the river (known as bioaccumulation). He collected samples of Quagga mussels at three sites in the St. Lawrence River and measured the concentration of copper (in micrograms per gram, ?g/g or mcg/g) in the mussels. His data are summarized in the provided table and plot. He wants to know if there are any significant differences in mean copper concentration among the three sites.
-Are the conditions for using ANOVA reasonably satisfied?
Question
Use the following to answer the questions below:
An environmental studies student working on an independent research project was investigating metal contamination in the St. Lawrence River. The metals can accumulate in organisms that live in the river (known as bioaccumulation). He collected samples of Quagga mussels at three sites in the St. Lawrence River and measured the concentration of copper (in micrograms per gram, μg/g or mcg/g) in the mussels. His data are summarized in the provided table and plot. He wants to know if there are any significant differences in mean copper concentration among the three sites.
-Use the summary information to compute the three sums of squares needed for using ANOVA to test for a difference in mean copper concentration among the three sites. Round each to two decimal places.
Question
Use the following to answer the questions below:
An environmental studies student working on an independent research project was investigating metal contamination in the St. Lawrence River. The metals can accumulate in organisms that live in the river (known as bioaccumulation). He collected samples of Quagga mussels at three sites in the St. Lawrence River and measured the concentration of copper (in micrograms per gram, μg/g or mcg/g) in the mussels. His data are summarized in the provided table and plot. He wants to know if there are any significant differences in mean copper concentration among the three sites.
-Construct the ANOVA table and test, using α = 0.05, for a difference in mean copper concentration among the three sites. Round decimal values to two decimal places. Include all details of the test.
Question
Use the following to answer the questions below:
An environmental studies student working on an independent research project was investigating metal contamination in the St. Lawrence River. The metals can accumulate in organisms that live in the river (known as bioaccumulation). He collected samples of Quagga mussels at three sites in the St. Lawrence River and measured the concentration of copper (in micrograms per gram, μg/g or mcg/g) in the mussels. His data are summarized in the provided table and plot. He wants to know if there are any significant differences in mean copper concentration among the three sites.
-Computer output from the analysis gives a p-value of 0.011. Test, using α = 0.05, for a difference in mean copper concentration among the three sites. Include all details of the test.
Question
Use the following to answer the questions below:
An environmental studies student working on an independent research project was investigating metal contamination in the St. Lawrence River. The metals can accumulate in organisms that live in the river (known as bioaccumulation). He collected samples of Quagga mussels at three sites in the St. Lawrence River and measured the concentration of copper (in micrograms per gram, μg/g or mcg/g) in the mussels. His data are summarized in the provided table and plot. He wants to know if there are any significant differences in mean copper concentration among the three sites.
-Use the summary information and results from the ANOVA to construct 95% confidence intervals for the differences in each pair of means:
(a) Site 1 and Site 2
(b) Site 1 and Site 3
(c) Site 2 and Site 3
In each case, round the margin of error to two decimal places. Based on your work, which sites have significantly different means? Briefly justify your answer.
Question
Use the following to answer the questions below:
An environmental studies student working on an independent research project was investigating metal contamination in the St. Lawrence River. The metals can accumulate in organisms that live in the river (known as bioaccumulation). He collected samples of Quagga mussels at three sites in the St. Lawrence River and measured the concentration of copper (in micrograms per gram, ?g/g or mcg/g) in the mussels. His data are summarized in the provided table and plot. He wants to know if there are any significant differences in mean copper concentration among the three sites.
-Computer output from the analysis provides the following information about the pairwise differences:
Site = 1 subtracted from:
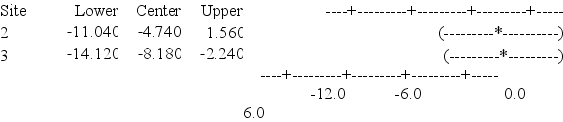
Site = 2 subtracted from:
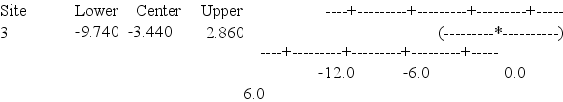
Based on this output, which sites have significantly different means?
A) Only Sites 1 and 3 have significantly different means.
B) Only Sites 1 and 2 have significantly different means.
C) Only Sites 2 and 3 have significantly different means.
D) None of the sites have significantly different means.
An environmental studies student working on an independent research project was investigating metal contamination in the St. Lawrence River. The metals can accumulate in organisms that live in the river (known as bioaccumulation). He collected samples of Quagga mussels at three sites in the St. Lawrence River and measured the concentration of copper (in micrograms per gram, ?g/g or mcg/g) in the mussels. His data are summarized in the provided table and plot. He wants to know if there are any significant differences in mean copper concentration among the three sites.
-Computer output from the analysis provides the following information about the pairwise differences:
Site = 1 subtracted from:
Site = 2 subtracted from:
Based on this output, which sites have significantly different means?
A) Only Sites 1 and 3 have significantly different means.
B) Only Sites 1 and 2 have significantly different means.
C) Only Sites 2 and 3 have significantly different means.
D) None of the sites have significantly different means.
Question
Use the following to answer the questions below:
An environmental studies student working on an independent research project was investigating metal contamination in the St. Lawrence River. The metals can accumulate in organisms that live in the river (known as bioaccumulation). He collected samples of Quagga mussels at three sites in the St. Lawrence River and measured the concentration of copper (in micrograms per gram, ?g/g or mcg/g) in the mussels. His data are summarized in the provided table and plot. He wants to know if there are any significant differences in mean copper concentration among the three sites.
-Computer output from the analysis provides the following grouping information: ?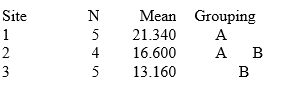
Means that do not share a letter are significantly different.
Based on this output, which sites have significantly different means? Briefly justify your answer.
A) Only Sites 1 and 3 have significantly different means.
B) Only Sites 1 and 2 have significantly different means.
C) Only Sites 2 and 3 have significantly different means.
D) None of the sites have significantly different means.
Question
Use the following to answer the questions below:
Summary statistics from a dataset and the corresponding computer analysis of variance output are provided.
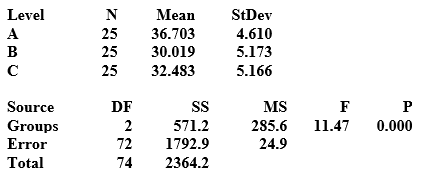
-What is the pooled standard deviation?
A) 24.9
B) 4.99
C) 16.90
D) 42.34
Summary statistics from a dataset and the corresponding computer analysis of variance output are provided.
-What is the pooled standard deviation?
A) 24.9
B) 4.99
C) 16.90
D) 42.34
Question
Use the following to answer the questions below:
Summary statistics from a dataset and the corresponding computer analysis of variance output are provided.
-What degrees of freedom are used in doing inferences for these means and differences in means after ANOVA?
A) 2
B) 3
C) 72
D) 74
Summary statistics from a dataset and the corresponding computer analysis of variance output are provided.
-What degrees of freedom are used in doing inferences for these means and differences in means after ANOVA?
A) 2
B) 3
C) 72
D) 74
Question
Use the following to answer the questions below:
Summary statistics from a dataset and the corresponding computer analysis of variance output are provided.
-Find a 90% confidence interval for the mean of population A. Round the margin of error to three decimal places.
A) 35.040 to 38.366
B) 35.061 to 38.345
C) 34.747 to 38.660
D) 34.937 to 38.470
Summary statistics from a dataset and the corresponding computer analysis of variance output are provided.
-Find a 90% confidence interval for the mean of population A. Round the margin of error to three decimal places.
A) 35.040 to 38.366
B) 35.061 to 38.345
C) 34.747 to 38.660
D) 34.937 to 38.470
Question
Use the following to answer the questions below:
Summary statistics from a dataset and the corresponding computer analysis of variance output are provided.
-Find a 95% confidence interval for the difference in the means of Populations A and B. Round the margin of error to three decimal places.
A) 4.333 to 9.035
B) 4.362 to 9.006
C) 3.918 to 9.405
D) 4.191 to 9.177
Question
Use the following to answer the questions below:
Summary statistics from a dataset and the corresponding computer analysis of variance output are provided.
-Test for a difference in population means between groups A and C. Use α = 0.05 and show all details of the test. Round the test statistic to two decimal places.
Summary statistics from a dataset and the corresponding computer analysis of variance output are provided.
-Test for a difference in population means between groups A and C. Use α = 0.05 and show all details of the test. Round the test statistic to two decimal places.

Unlock Deck
Sign up to unlock the cards in this deck!
Unlock Deck
Unlock Deck
1/53
Play
Full screen (f)
Deck 8: Anova to Compare Means
1
Use the following to answer the questions below:
Two sets of sample data, A and B, are given. Without doing any calculations, indicate in which set of sample data, A or B, there is likely to be stronger evidence of a difference in the population means.
-
A) Dataset A
B) Dataset B
Two sets of sample data, A and B, are given. Without doing any calculations, indicate in which set of sample data, A or B, there is likely to be stronger evidence of a difference in the population means.
-
A) Dataset A
B) Dataset B
Dataset A
2
Use the following to answer the questions below:
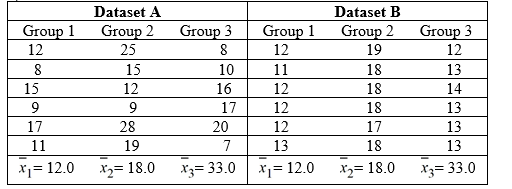
Two sets of sample data, A and B, are given. Without doing any calculations, indicate in which set of sample data, A or B, there is likely to be stronger evidence of a difference in the population means.
-
A) Dataset A
B) Dataset B
Two sets of sample data, A and B, are given. Without doing any calculations, indicate in which set of sample data, A or B, there is likely to be stronger evidence of a difference in the population means.
-
A) Dataset A
B) Dataset B
Dataset B
3
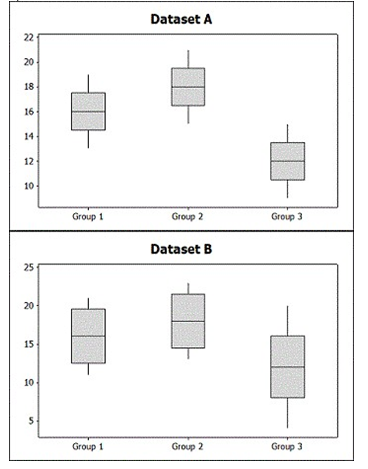
Use the following to answer the questions below:
Two sets of sample data, A and B, are given. Without doing any calculations, indicate in which set of sample data, A or B, there is likely to be stronger evidence of a difference in the population means.
-
A) Dataset A
B) Dataset B
Two sets of sample data, A and B, are given. Without doing any calculations, indicate in which set of sample data, A or B, there is likely to be stronger evidence of a difference in the population means.
-
A) Dataset A
B) Dataset B
Dataset A
4
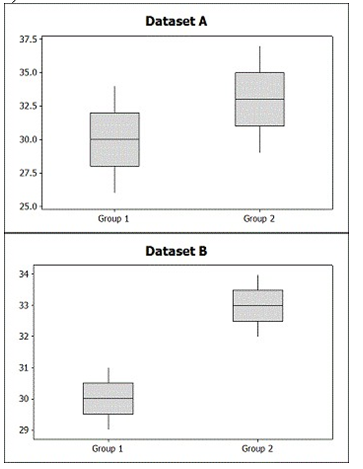
Use the following to answer the questions below:
Two sets of sample data, A and B, are given. Without doing any calculations, indicate in which set of sample data, A or B, there is likely to be stronger evidence of a difference in the population means.
-
A) Dataset A
B) Dataset B
Two sets of sample data, A and B, are given. Without doing any calculations, indicate in which set of sample data, A or B, there is likely to be stronger evidence of a difference in the population means.
-
A) Dataset A
B) Dataset B
Unlock Deck
Unlock for access to all 53 flashcards in this deck.
Unlock Deck
k this deck
5
Use the following to answer the questions below:
Two sets of sample data, A and B, are given. Without doing any calculations, indicate in which set of sample data, A or B, there is likely to be stronger evidence of a difference in the population means.
-
A) Dataset A
B) Dataset B
Two sets of sample data, A and B, are given. Without doing any calculations, indicate in which set of sample data, A or B, there is likely to be stronger evidence of a difference in the population means.
-
A) Dataset A
B) Dataset B
Unlock Deck
Unlock for access to all 53 flashcards in this deck.
Unlock Deck
k this deck
6
Use the following to answer the questions below:
Two sets of sample data, A and B, are given. Without doing any calculations, indicate in which set of sample data, A or B, there is likely to be stronger evidence of a difference in the population means.
-
A) Dataset A
B) Dataset B
Two sets of sample data, A and B, are given. Without doing any calculations, indicate in which set of sample data, A or B, there is likely to be stronger evidence of a difference in the population means.
-
A) Dataset A
B) Dataset B
Unlock Deck
Unlock for access to all 53 flashcards in this deck.
Unlock Deck
k this deck
7
Use the following to answer the questions below:
Two sets of sample data, A and B, are given. Without doing any calculations, indicate in which set of sample data, A or B, there is likely to be stronger evidence of a difference in the population means.
-Analysis of variance is used to test for significant differences among
A) means.
B) variances.
C) standard deviations.
D) proportions.
Unlock Deck
Unlock for access to all 53 flashcards in this deck.
Unlock Deck
k this deck
8
Use the following to answer the questions below:
Two sets of sample data, A and B, are given. Without doing any calculations, indicate in which set of sample data, A or B, there is likely to be stronger evidence of a difference in the population means.
-Some computer output from an analysis of variance is provided.
How many groups are there?
A) 3
B) 4
C) 5
D) 6
Unlock Deck
Unlock for access to all 53 flashcards in this deck.
Unlock Deck
k this deck
9
Use the following to answer the questions below:
Two sets of sample data, A and B, are given. Without doing any calculations, indicate in which set of sample data, A or B, there is likely to be stronger evidence of a difference in the population means.
-Some computer output from an analysis of variance is provided.
What is the overall sample size?
A) 125
B) 124
C) 123
D) 121
Unlock Deck
Unlock for access to all 53 flashcards in this deck.
Unlock Deck
k this deck
10
Use the following to answer the questions below:
Two sets of sample data, A and B, are given. Without doing any calculations, indicate in which set of sample data, A or B, there is likely to be stronger evidence of a difference in the population means.
-A scientist performing analysis of variance has the following null hypothesis:
What is the appropriate alternative hypothesis for his analysis?
A) : .
B) : > > > .
C) : < < < .
D) : At least one
Two sets of sample data, A and B, are given. Without doing any calculations, indicate in which set of sample data, A or B, there is likely to be stronger evidence of a difference in the population means.
-A scientist performing analysis of variance has the following null hypothesis:
What is the appropriate alternative hypothesis for his analysis?
A)
: .B)
: > > > .C)
: < < < .D)
: At least one Unlock Deck
Unlock for access to all 53 flashcards in this deck.
Unlock Deck
k this deck
11
Use the following to answer the questions below:
Two sets of sample data, A and B, are given. Without doing any calculations, indicate in which set of sample data, A or B, there is likely to be stronger evidence of a difference in the population means.
-SSE = SSTotal + SSG
Two sets of sample data, A and B, are given. Without doing any calculations, indicate in which set of sample data, A or B, there is likely to be stronger evidence of a difference in the population means.
-SSE = SSTotal + SSG
Unlock Deck
Unlock for access to all 53 flashcards in this deck.
Unlock Deck
k this deck
12
Use the following to answer the questions below:
The sample sizes for the groups in a dataset and an outline of an analysis of variance table with partial information are provided. Fill in the missing parts of the table. Round decimal answers to two decimal places.
-Three groups with = 10, = 10, and = 10.
The sample sizes for the groups in a dataset and an outline of an analysis of variance table with partial information are provided. Fill in the missing parts of the table. Round decimal answers to two decimal places.
-Three groups with
= 10, = 10, and = 10. Unlock Deck
Unlock for access to all 53 flashcards in this deck.
Unlock Deck
k this deck
13
Use the following to answer the questions below:
The sample sizes for the groups in a dataset and an outline of an analysis of variance table with partial information are provided. Fill in the missing parts of the table. Round decimal answers to two decimal places.
-Four groups with = 6, = 5, = 5, and = 4.
The sample sizes for the groups in a dataset and an outline of an analysis of variance table with partial information are provided. Fill in the missing parts of the table. Round decimal answers to two decimal places.
-Four groups with
= 6, = 5, = 5, and = 4. Unlock Deck
Unlock for access to all 53 flashcards in this deck.
Unlock Deck
k this deck
14
Use the following to answer the questions below:
The sample sizes for the groups in a dataset and an outline of an analysis of variance table with partial information are provided. Fill in the missing parts of the table. Round decimal answers to two decimal places.
-Three groups with = 8, = 7, and = 5.
The sample sizes for the groups in a dataset and an outline of an analysis of variance table with partial information are provided. Fill in the missing parts of the table. Round decimal answers to two decimal places.
-Three groups with
= 8, = 7, and = 5. Unlock Deck
Unlock for access to all 53 flashcards in this deck.
Unlock Deck
k this deck
15
Use the following to answer the questions below:
A small university is concerned with monitoring its electricity usage in its Student Center. Specifically, its officials want to know if the amount of electricity used differs by day of the week. They collected data for nearly a year, and the relevant summary statistics are provided. Note that electricity usage is measured in kilowatt hours.
?
-State the appropriate null and alternative hypotheses for this test.
A)
B)
C)
D)
Unlock Deck
Unlock for access to all 53 flashcards in this deck.
Unlock Deck
k this deck
16
Use the following to answer the questions below:
A small university is concerned with monitoring its electricity usage in its Student Center. Specifically, its officials want to know if the amount of electricity used differs by day of the week. They collected data for nearly a year, and the relevant summary statistics are provided. Note that electricity usage is measured in kilowatt hours.
?
-Are the conditions for using ANOVA reasonably satisfied?
Unlock Deck
Unlock for access to all 53 flashcards in this deck.
Unlock Deck
k this deck
17
Use the following to answer the questions below:
A small university is concerned with monitoring its electricity usage in its Student Center. Specifically, its officials want to know if the amount of electricity used differs by day of the week. They collected data for nearly a year, and the relevant summary statistics are provided. Note that electricity usage is measured in kilowatt hours.
?
-Complete the ANOVA table below for doing this test using the template started below. Use two decimal places in the F statistic.
A)
B)
C)
D)
Unlock Deck
Unlock for access to all 53 flashcards in this deck.
Unlock Deck
k this deck
18
Use the following to answer the questions below:
A small university is concerned with monitoring its electricity usage in its Student Center. Specifically, its officials want to know if the amount of electricity used differs by day of the week. They collected data for nearly a year, and the relevant summary statistics are provided. Note that electricity usage is measured in kilowatt hours.
?
-Use the F-distribution to find the p-value for the test. Using = 0.05, does the mean electricity usage differ significantly by day of the week? Make a conclusion in context.
A) There is very strong evidence that mean electricity usage differs significantly by day of the week (i.e., some days of the week use more electricity than others).
B) There is not enough evidence to conclude that mean electricity usage differs significantly by day of the week (i.e., some days of the week use more electricity than others).
Unlock Deck
Unlock for access to all 53 flashcards in this deck.
Unlock Deck
k this deck
19
Use the following to answer the questions below:
A small university is concerned with monitoring its electricity usage in its Student Center. Specifically, its officials want to know if the amount of electricity used differs by day of the week. They collected data for nearly a year, and the relevant summary statistics are provided. Note that electricity usage is measured in kilowatt hours.
?
-Using the results from the ANOVA analysis, at an = 0.05 level of confidence, what is the conclusion of the test, in context?
A) There is very strong evidence that mean electricity usage differs significantly by day of the week (i.e., some days of the week use more electricity than others).
B) There is not enough evidence to conclude that mean electricity usage differs significantly by day of the week (i.e., some days of the week use more electricity than others).
Unlock Deck
Unlock for access to all 53 flashcards in this deck.
Unlock Deck
k this deck
20
Use the following to answer the questions below:
A small university is concerned with monitoring its electricity usage in its Student Center. Specifically, its officials want to know if the amount of electricity used differs by day of the week. They collected data for nearly a year, and the relevant summary statistics are provided. Note that electricity usage is measured in kilowatt hours.
?
-Use the data and ANOVA results to construct a 95% confidence interval for the difference in mean electricity use between Saturdays and Sundays. Round the margin of error to two decimal places. Does your interval suggest a significant difference in mean electricity use for these two days?
A) -12.92 to 14.10
There is no evidence that electricity use differs significantly on Saturdays and Sundays.
B) -12.92 to 14.10
There is strong evidence that electricity use differs significantly on Saturdays and Sundays.
C) -11.09 to 12.27
There is no evidence that electricity use differs significantly on Saturdays and Sundays.
D) -11.09 to 12/27
There is strong evidence that electricity use differs significantly on Saturdays and Sundays.
Unlock Deck
Unlock for access to all 53 flashcards in this deck.
Unlock Deck
k this deck
21
Use the following to answer the questions below:
A small university is concerned with monitoring its electricity usage in its Student Center. Specifically, its officials want to know if the amount of electricity used differs by day of the week. They collected data for nearly a year, and the relevant summary statistics are provided. Note that electricity usage is measured in kilowatt hours.
-Based on the ANOVA results, test at the 5% level whether the data provide evidence of a difference in mean electricity use on Sundays and Mondays. Use three decimal places in the test statistic.
Unlock Deck
Unlock for access to all 53 flashcards in this deck.
Unlock Deck
k this deck
22
Use the following to answer the questions below:
A small university is concerned with monitoring its electricity usage in its Student Center. Specifically, its officials want to know if the amount of electricity used differs by day of the week. They collected data for nearly a year, and the relevant summary statistics are provided. Note that electricity usage is measured in kilowatt hours.
?
-Computer output provides the following grouping information:
Means that do not share a letter are significantly different.
Use the output to make a statement about how electricity usage differs significantly by day of the week.
A) Significantly less electricity is used on weekends than on weekdays.
B) There is not enough evidence to conclude that electricity usage on weekends is different than electricity usage on weekdays.
Unlock Deck
Unlock for access to all 53 flashcards in this deck.
Unlock Deck
k this deck
23
Use the following to answer the questions below:
Penalties in ice hockey occur when a player breaks one of the rules of the game. In most cases, when a penalty occurs, the offending player is placed in the penalty box (the length of time spent in the penalty box depends on the severity of the penalty), and the team has to play with fewer people on the ice, which can result in an advantage for the opposing team. The number of penalties per game for several randomly selected games are displayed for three college men's ice hockey teams.
?
-Use the summary information to compute the three sums of squares needed for using ANOVA to test for a difference in mean number of penalties among these three teams. Round each to two decimal places.
A) SSG = 56.93
SSE = 66.79
SSTotal = 123.74
B) SSG = 40.28
SSE = 83.46
SSTotal = 123.74
C) SSG = 65.79
SSE = 66.79
SSTotal = 132.58
D) SSG = 49.12
SSE = 83.46
SSTotal = 132.58
Unlock Deck
Unlock for access to all 53 flashcards in this deck.
Unlock Deck
k this deck
24
Use the following to answer the questions below:
Penalties in ice hockey occur when a player breaks one of the rules of the game. In most cases, when a penalty occurs, the offending player is placed in the penalty box (the length of time spent in the penalty box depends on the severity of the penalty), and the team has to play with fewer people on the ice, which can result in an advantage for the opposing team. The number of penalties per game for several randomly selected games are displayed for three college men's ice hockey teams.
-Construct the ANOVA table and test, at the 5% significance level, for a difference in mean number of penalties among these three hockey teams. Use two decimal places when rounding decimal values. Include the details of your test.
Unlock Deck
Unlock for access to all 53 flashcards in this deck.
Unlock Deck
k this deck
25
Use the following to answer the questions below:
Penalties in ice hockey occur when a player breaks one of the rules of the game. In most cases, when a penalty occurs, the offending player is placed in the penalty box (the length of time spent in the penalty box depends on the severity of the penalty), and the team has to play with fewer people on the ice, which can result in an advantage for the opposing team. The number of penalties per game for several randomly selected games are displayed for three college men's ice hockey teams.
?
-ANOVA output gives a p-value of 0.025 for the difference in mean number of penalties among the three teams. Using = 0.05, what is the conclusion of the test in context?
A) There is evidence of a significance difference in mean number of penalties among the three teams.
B) There is not enough evidence to conclude that there is a significance difference in mean number of penalties among the three teams.
Unlock Deck
Unlock for access to all 53 flashcards in this deck.
Unlock Deck
k this deck
26
Use the following to answer the questions below:
Penalties in ice hockey occur when a player breaks one of the rules of the game. In most cases, when a penalty occurs, the offending player is placed in the penalty box (the length of time spent in the penalty box depends on the severity of the penalty), and the team has to play with fewer people on the ice, which can result in an advantage for the opposing team. The number of penalties per game for several randomly selected games are displayed for three college men's ice hockey teams.
-Use the summary information and results from the ANOVA to construct 95% confidence intervals for the differences in each pair of means:
(a) Team A and Team B
(b) Team A and Team C
(c) Team B and Team C
In each case, round the margin of error to two decimal places. Based on your work, which teams have significantly different means? Briefly justify your answer.
Unlock Deck
Unlock for access to all 53 flashcards in this deck.
Unlock Deck
k this deck
27
Use the following to answer the questions below:
Penalties in ice hockey occur when a player breaks one of the rules of the game. In most cases, when a penalty occurs, the offending player is placed in the penalty box (the length of time spent in the penalty box depends on the severity of the penalty), and the team has to play with fewer people on the ice, which can result in an advantage for the opposing team. The number of penalties per game for several randomly selected games are displayed for three college men's ice hockey teams.
?
-Computer output provides the following information about the pairwise differences:
Based on this output, which teams have significantly different means?
A) Teams A and B
B) Teams A and B; Teams A and C
C) Teams A and C
D) All three teams have significantly different means
Unlock Deck
Unlock for access to all 53 flashcards in this deck.
Unlock Deck
k this deck
28
Use the following to answer the questions below:
Penalties in ice hockey occur when a player breaks one of the rules of the game. In most cases, when a penalty occurs, the offending player is placed in the penalty box (the length of time spent in the penalty box depends on the severity of the penalty), and the team has to play with fewer people on the ice, which can result in an advantage for the opposing team. The number of penalties per game for several randomly selected games are displayed for three college men's ice hockey teams.
?
-Computer output provides the following grouping information:
Means that do not share a letter are significantly different.
Based on this output, which teams have significantly different means?
A) Teams A and B
B) Teams A and B; Teams A and C
C) Teams A and C
D) All three teams have significantly different means
Unlock Deck
Unlock for access to all 53 flashcards in this deck.
Unlock Deck
k this deck
29
Use the following to answer the questions below:
Breakfast is often considered to be the most important meal of the day. Data on the number of calories per serving for randomly selected cereals from three different brands (General Mills, Kellogg's, and Kashi) are summarized in the provided plot and table.
-State the appropriate null and alternative hypotheses for testing if the mean calories per serving differs among the three brands.
A)
B)
C)
D)
Unlock Deck
Unlock for access to all 53 flashcards in this deck.
Unlock Deck
k this deck
30
Use the following to answer the questions below:
Breakfast is often considered to be the most important meal of the day. Data on the number of calories per serving for randomly selected cereals from three different brands (General Mills, Kellogg's, and Kashi) are summarized in the provided plot and table.
-Are the conditions for using ANOVA reasonably satisfied?
Unlock Deck
Unlock for access to all 53 flashcards in this deck.
Unlock Deck
k this deck
31
Use the following to answer the questions below:
Breakfast is often considered to be the most important meal of the day. Data on the number of calories per serving for randomly selected cereals from three different brands (General Mills, Kellogg's, and Kashi) are summarized in the provided plot and table.
-Computer analysis gives a p-value of 0.001. Using = 0.05, what is the conclusion of the test, in context?
A) There is very strong evidence that the mean calories per serving is not the same for all three brands.
B) There is not enough evidence to conclude that the mean calories per serving is not the same for all three brands.
Unlock Deck
Unlock for access to all 53 flashcards in this deck.
Unlock Deck
k this deck
32
Use the following to answer the questions below:
Breakfast is often considered to be the most important meal of the day. Data on the number of calories per serving for randomly selected cereals from three different brands (General Mills, Kellogg's, and Kashi) are summarized in the provided plot and table.
-Use the summary information and the fact that the sums of squares for groups is SSG = 27,476 and for error is SSTotal = 152,379 to complete an ANOVA table and find the F-statistic. Round decimal answers to two decimal places.
Unlock Deck
Unlock for access to all 53 flashcards in this deck.
Unlock Deck
k this deck
33
Use the following to answer the questions below:
Breakfast is often considered to be the most important meal of the day. Data on the number of calories per serving for randomly selected cereals from three different brands (General Mills, Kellogg's, and Kashi) are summarized in the provided plot and table.
-Use the summary information and the fact that the sums of squares for groups is SSG = 27,476 and for error is SSTotal = 152,379 to complete an ANOVA table and find the F-statistic. Use the F-distribution to find the p-value and state the conclusion of the test in context (using ).
A) p-value = 0.00078
There is very strong evidence that the mean calories per serving differs significantly among the three brands.
B) p-value = 0.00078
There is not enough evidence to conclude that the mean calories per serving differs significantly among the three brands.
C) p-value = 0.078
There is very strong evidence that the mean calories per serving differs significantly among the three brands.
D) p-value = 0.078
There is not enough evidence to conclude that the mean calories per serving differs significantly among the three brands.
Breakfast is often considered to be the most important meal of the day. Data on the number of calories per serving for randomly selected cereals from three different brands (General Mills, Kellogg's, and Kashi) are summarized in the provided plot and table.
-Use the summary information and the fact that the sums of squares for groups is SSG = 27,476 and for error is SSTotal = 152,379 to complete an ANOVA table and find the F-statistic. Use the F-distribution to find the p-value and state the conclusion of the test in context (using
).A) p-value = 0.00078
There is very strong evidence that the mean calories per serving differs significantly among the three brands.
B) p-value = 0.00078
There is not enough evidence to conclude that the mean calories per serving differs significantly among the three brands.
C) p-value = 0.078
There is very strong evidence that the mean calories per serving differs significantly among the three brands.
D) p-value = 0.078
There is not enough evidence to conclude that the mean calories per serving differs significantly among the three brands.
Unlock Deck
Unlock for access to all 53 flashcards in this deck.
Unlock Deck
k this deck
34
Use the following to answer the questions below:
Breakfast is often considered to be the most important meal of the day. Data on the number of calories per serving for randomly selected cereals from three different brands (General Mills, Kellogg's, and Kashi) are summarized in the provided plot and table.
-Computer output from Minitab is provides the following information about the pairwise differences: Brand = General Mills subtracted from:
Brand = Kashi subtracted from:
Based on this output, which brands have significantly different means?
A) Kashi and General Mills have significantly different means.
Kashi and Kellogg's have significantly different means.
Kellogg's and General Mills are not significantly different.
B) Kashi and General Mills have significantly different means.
Kashi and Kellogg's are not significantly different.
Kellogg's and General Mills are not significantly different.
C) Kashi and General Mills are not significantly different.
Kashi and Kellogg's are not significantly different.
Kellogg's and General Mills are not significantly different.
D) Kashi and General Mills are not significantly different.
Kashi and Kellogg's have significantly different means.
Kellogg's and General Mills have significantly different means.
Unlock Deck
Unlock for access to all 53 flashcards in this deck.
Unlock Deck
k this deck
35
Use the following to answer the questions below:
Breakfast is often considered to be the most important meal of the day. Data on the number of calories per serving for randomly selected cereals from three different brands (General Mills, Kellogg's, and Kashi) are summarized in the provided plot and table.
-Computer output provides the following grouping information:
Means that do not share a letter are significantly different.
Based on this output, which brands have significantly different means? Briefly justify your answer.
Unlock Deck
Unlock for access to all 53 flashcards in this deck.
Unlock Deck
k this deck
36
Use the following to answer the questions below:
Breakfast is often considered to be the most important meal of the day. Data on the number of calories per serving for randomly selected cereals from three different brands (General Mills, Kellogg's, and Kashi) are summarized in the provided plot and table.
-Use the summary information and the fact that the sums of squares for groups is SSG = 27,476 and for error is SSTotal = 152,379 to test for significant differences (using
) in each pair of means:
(a) General Mills and Kashi
(b) General Mills and Kellogg's
(c) Kashi and Kellogg's
In each case, round the test statistic to three decimal places. Based on your work, which brands have significantly different means? Briefly justify your answer.
Breakfast is often considered to be the most important meal of the day. Data on the number of calories per serving for randomly selected cereals from three different brands (General Mills, Kellogg's, and Kashi) are summarized in the provided plot and table.
-Use the summary information and the fact that the sums of squares for groups is SSG = 27,476 and for error is SSTotal = 152,379 to test for significant differences (using
) in each pair of means:(a) General Mills and Kashi
(b) General Mills and Kellogg's
(c) Kashi and Kellogg's
In each case, round the test statistic to three decimal places. Based on your work, which brands have significantly different means? Briefly justify your answer.
Unlock Deck
Unlock for access to all 53 flashcards in this deck.
Unlock Deck
k this deck
37
Use the following to answer the questions below:
Breakfast is often considered to be the most important meal of the day. Data on the amount of sugar (g) per serving for randomly selected cereals from three different brands (General Mills, Kellogg's, and Kashi) are summarized in the provided plot and table.
-Are the conditions for using ANOVA reasonably satisfied?
Unlock Deck
Unlock for access to all 53 flashcards in this deck.
Unlock Deck
k this deck
38
Use the following to answer the questions below:
Breakfast is often considered to be the most important meal of the day. Data on the amount of sugar (g) per serving for randomly selected cereals from three different brands (General Mills, Kellogg's, and Kashi) are summarized in the provided plot and table.
-Computer output from the analysis gives a p-value of 0.066. Test, at the 5% level, if there is evidence that the average amount of sugar per serving differs significantly among the three brands.
A) There is no evidence that the average amount of sugar per serving differs significantly among the three brands.
B) The average amount of sugar per serving differs significantly between Kellogg's and Kashi.
C) Kellogg's average amount of sugar per serving id significantly greater than both Kashi and General Mills.
D) The average amount of sugar per serving differs significantly among the three brands.
Unlock Deck
Unlock for access to all 53 flashcards in this deck.
Unlock Deck
k this deck
39
Use the following to answer the questions below:
Breakfast is often considered to be the most important meal of the day. Data on the amount of sugar (g) per serving for randomly selected cereals from three different brands (General Mills, Kellogg's, and Kashi) are summarized in the provided plot and table.
-Use the summary information to compute the three sums of squares needed for using ANOVA to test for a difference in the mean amount of calories per serving among the three brands. Round each to two decimal places.
Unlock Deck
Unlock for access to all 53 flashcards in this deck.
Unlock Deck
k this deck
40
Use the following to answer the questions below:
Breakfast is often considered to be the most important meal of the day. Data on the amount of sugar (g) per serving for randomly selected cereals from three different brands (General Mills, Kellogg's, and Kashi) are summarized in the provided plot and table.
-Construct the ANOVA table and test, at the 5% significance level, for a difference in mean amount of sugar among the three brands. Use two decimal places in all decimal values. Is there enough evidence to conclude that the average amount of sugar per serving differs significantly among the three brands.
Unlock Deck
Unlock for access to all 53 flashcards in this deck.
Unlock Deck
k this deck
41
Use the following to answer the questions below:
Breakfast is often considered to be the most important meal of the day. Data on the amount of sugar (g) per serving for randomly selected cereals from three different brands (General Mills, Kellogg's, and Kashi) are summarized in the provided plot and table.
-Should you conduct inference after the ANOVA to investigate differences among the pairs of means in this situation? Briefly explain why or why not.
Unlock Deck
Unlock for access to all 53 flashcards in this deck.
Unlock Deck
k this deck
42
Use the following to answer the questions below:
An environmental studies student working on an independent research project was investigating metal contamination in the St. Lawrence River. The metals can accumulate in organisms that live in the river (known as bioaccumulation). He collected samples of Quagga mussels at three sites in the St. Lawrence River and measured the concentration of copper (in micrograms per gram, ?g/g or mcg/g) in the mussels. His data are summarized in the provided table and plot. He wants to know if there are any significant differences in mean copper concentration among the three sites.
-Are the conditions for using ANOVA reasonably satisfied?
Unlock Deck
Unlock for access to all 53 flashcards in this deck.
Unlock Deck
k this deck
43
Use the following to answer the questions below:
An environmental studies student working on an independent research project was investigating metal contamination in the St. Lawrence River. The metals can accumulate in organisms that live in the river (known as bioaccumulation). He collected samples of Quagga mussels at three sites in the St. Lawrence River and measured the concentration of copper (in micrograms per gram, μg/g or mcg/g) in the mussels. His data are summarized in the provided table and plot. He wants to know if there are any significant differences in mean copper concentration among the three sites.
-Use the summary information to compute the three sums of squares needed for using ANOVA to test for a difference in mean copper concentration among the three sites. Round each to two decimal places.
Unlock Deck
Unlock for access to all 53 flashcards in this deck.
Unlock Deck
k this deck
44
Use the following to answer the questions below:
An environmental studies student working on an independent research project was investigating metal contamination in the St. Lawrence River. The metals can accumulate in organisms that live in the river (known as bioaccumulation). He collected samples of Quagga mussels at three sites in the St. Lawrence River and measured the concentration of copper (in micrograms per gram, μg/g or mcg/g) in the mussels. His data are summarized in the provided table and plot. He wants to know if there are any significant differences in mean copper concentration among the three sites.
-Construct the ANOVA table and test, using α = 0.05, for a difference in mean copper concentration among the three sites. Round decimal values to two decimal places. Include all details of the test.
Unlock Deck
Unlock for access to all 53 flashcards in this deck.
Unlock Deck
k this deck
45
Use the following to answer the questions below:
An environmental studies student working on an independent research project was investigating metal contamination in the St. Lawrence River. The metals can accumulate in organisms that live in the river (known as bioaccumulation). He collected samples of Quagga mussels at three sites in the St. Lawrence River and measured the concentration of copper (in micrograms per gram, μg/g or mcg/g) in the mussels. His data are summarized in the provided table and plot. He wants to know if there are any significant differences in mean copper concentration among the three sites.
-Computer output from the analysis gives a p-value of 0.011. Test, using α = 0.05, for a difference in mean copper concentration among the three sites. Include all details of the test.
Unlock Deck
Unlock for access to all 53 flashcards in this deck.
Unlock Deck
k this deck
46
Use the following to answer the questions below:
An environmental studies student working on an independent research project was investigating metal contamination in the St. Lawrence River. The metals can accumulate in organisms that live in the river (known as bioaccumulation). He collected samples of Quagga mussels at three sites in the St. Lawrence River and measured the concentration of copper (in micrograms per gram, μg/g or mcg/g) in the mussels. His data are summarized in the provided table and plot. He wants to know if there are any significant differences in mean copper concentration among the three sites.
-Use the summary information and results from the ANOVA to construct 95% confidence intervals for the differences in each pair of means:
(a) Site 1 and Site 2
(b) Site 1 and Site 3
(c) Site 2 and Site 3
In each case, round the margin of error to two decimal places. Based on your work, which sites have significantly different means? Briefly justify your answer.
Unlock Deck
Unlock for access to all 53 flashcards in this deck.
Unlock Deck
k this deck
47
Use the following to answer the questions below:
An environmental studies student working on an independent research project was investigating metal contamination in the St. Lawrence River. The metals can accumulate in organisms that live in the river (known as bioaccumulation). He collected samples of Quagga mussels at three sites in the St. Lawrence River and measured the concentration of copper (in micrograms per gram, ?g/g or mcg/g) in the mussels. His data are summarized in the provided table and plot. He wants to know if there are any significant differences in mean copper concentration among the three sites.
-Computer output from the analysis provides the following information about the pairwise differences:
Site = 1 subtracted from:
Site = 2 subtracted from:
Based on this output, which sites have significantly different means?
A) Only Sites 1 and 3 have significantly different means.
B) Only Sites 1 and 2 have significantly different means.
C) Only Sites 2 and 3 have significantly different means.
D) None of the sites have significantly different means.
Unlock Deck
Unlock for access to all 53 flashcards in this deck.
Unlock Deck
k this deck
48
Use the following to answer the questions below:
An environmental studies student working on an independent research project was investigating metal contamination in the St. Lawrence River. The metals can accumulate in organisms that live in the river (known as bioaccumulation). He collected samples of Quagga mussels at three sites in the St. Lawrence River and measured the concentration of copper (in micrograms per gram, ?g/g or mcg/g) in the mussels. His data are summarized in the provided table and plot. He wants to know if there are any significant differences in mean copper concentration among the three sites.
-Computer output from the analysis provides the following grouping information: ?
Means that do not share a letter are significantly different.
Based on this output, which sites have significantly different means? Briefly justify your answer.
A) Only Sites 1 and 3 have significantly different means.
B) Only Sites 1 and 2 have significantly different means.
C) Only Sites 2 and 3 have significantly different means.
D) None of the sites have significantly different means.
Unlock Deck
Unlock for access to all 53 flashcards in this deck.
Unlock Deck
k this deck
49
Use the following to answer the questions below:
Summary statistics from a dataset and the corresponding computer analysis of variance output are provided.
-What is the pooled standard deviation?
A) 24.9
B) 4.99
C) 16.90
D) 42.34
Summary statistics from a dataset and the corresponding computer analysis of variance output are provided.
-What is the pooled standard deviation?
A) 24.9
B) 4.99
C) 16.90
D) 42.34
Unlock Deck
Unlock for access to all 53 flashcards in this deck.
Unlock Deck
k this deck
50
Use the following to answer the questions below:
Summary statistics from a dataset and the corresponding computer analysis of variance output are provided.
-What degrees of freedom are used in doing inferences for these means and differences in means after ANOVA?
A) 2
B) 3
C) 72
D) 74
Summary statistics from a dataset and the corresponding computer analysis of variance output are provided.
-What degrees of freedom are used in doing inferences for these means and differences in means after ANOVA?
A) 2
B) 3
C) 72
D) 74
Unlock Deck
Unlock for access to all 53 flashcards in this deck.
Unlock Deck
k this deck
51
Use the following to answer the questions below:
Summary statistics from a dataset and the corresponding computer analysis of variance output are provided.
-Find a 90% confidence interval for the mean of population A. Round the margin of error to three decimal places.
A) 35.040 to 38.366
B) 35.061 to 38.345
C) 34.747 to 38.660
D) 34.937 to 38.470
Summary statistics from a dataset and the corresponding computer analysis of variance output are provided.
-Find a 90% confidence interval for the mean of population A. Round the margin of error to three decimal places.
A) 35.040 to 38.366
B) 35.061 to 38.345
C) 34.747 to 38.660
D) 34.937 to 38.470
Unlock Deck
Unlock for access to all 53 flashcards in this deck.
Unlock Deck
k this deck
52
Use the following to answer the questions below:
Summary statistics from a dataset and the corresponding computer analysis of variance output are provided.
-Find a 95% confidence interval for the difference in the means of Populations A and B. Round the margin of error to three decimal places.
A) 4.333 to 9.035
B) 4.362 to 9.006
C) 3.918 to 9.405
D) 4.191 to 9.177
Unlock Deck
Unlock for access to all 53 flashcards in this deck.
Unlock Deck
k this deck
53
Use the following to answer the questions below:
Summary statistics from a dataset and the corresponding computer analysis of variance output are provided.
-Test for a difference in population means between groups A and C. Use α = 0.05 and show all details of the test. Round the test statistic to two decimal places.
Summary statistics from a dataset and the corresponding computer analysis of variance output are provided.
-Test for a difference in population means between groups A and C. Use α = 0.05 and show all details of the test. Round the test statistic to two decimal places.
Unlock Deck
Unlock for access to all 53 flashcards in this deck.
Unlock Deck
k this deck
Unlock Deck
Unlock for access to all 53 flashcards in this deck.


