Deck 7: CHI-Square Tests for Categorical Variables
Full screen (f)
Question
Use the following to answer the questions below:
Are all colors equally likely for Milk Chocolate M&M's? Data collected from a bag of Milk Chocolate M&M's are provided.

-State the null and alternative hypotheses for testing if the colors are not all equally likely for Milk Chocolate M&M's.
Are all colors equally likely for Milk Chocolate M&M's? Data collected from a bag of Milk Chocolate M&M's are provided.
-State the null and alternative hypotheses for testing if the colors are not all equally likely for Milk Chocolate M&M's.
Question
Use the following to answer the questions below:
Are all colors equally likely for Milk Chocolate M&M's? Data collected from a bag of Milk Chocolate M&M's are provided.
-If all colors are equally likely, how many candies of each color (in a bag of 420 candies) would we expect to see?
Are all colors equally likely for Milk Chocolate M&M's? Data collected from a bag of Milk Chocolate M&M's are provided.
-If all colors are equally likely, how many candies of each color (in a bag of 420 candies) would we expect to see?
Question
Use the following to answer the questions below:
Are all colors equally likely for Milk Chocolate M&M's? Data collected from a bag of Milk Chocolate M&M's are provided.
-Is a chi-square test appropriate in this situation?
Are all colors equally likely for Milk Chocolate M&M's? Data collected from a bag of Milk Chocolate M&M's are provided.
-Is a chi-square test appropriate in this situation?
Question
Use the following to answer the questions below:
Are all colors equally likely for Milk Chocolate M&M's? Data collected from a bag of Milk Chocolate M&M's are provided.
-Calculate the chi-square test statistic. Report your answer with three decimal places.
Are all colors equally likely for Milk Chocolate M&M's? Data collected from a bag of Milk Chocolate M&M's are provided.
-Calculate the chi-square test statistic. Report your answer with three decimal places.
Question
Use the following to answer the questions below:
Are all colors equally likely for Milk Chocolate M&M's? Data collected from a bag of Milk Chocolate M&M's are provided.
-Report the p-value for your test. What conclusion can be made about the color distribution for Milk Chocolate M&M's? Use a 5% significance level.
Are all colors equally likely for Milk Chocolate M&M's? Data collected from a bag of Milk Chocolate M&M's are provided.
-Report the p-value for your test. What conclusion can be made about the color distribution for Milk Chocolate M&M's? Use a 5% significance level.
Question
Use the following to answer the questions below:
Are all colors equally likely for Milk Chocolate M&M's? Data collected from a bag of Milk Chocolate M&M's are provided.
-Which color contributes the most to the chi-square test statistic? For this color, is the observed count smaller or larger than the expected count?
Are all colors equally likely for Milk Chocolate M&M's? Data collected from a bag of Milk Chocolate M&M's are provided.
-Which color contributes the most to the chi-square test statistic? For this color, is the observed count smaller or larger than the expected count?
Question
Use the following to answer the questions below:
Are all colors equally likely for Milk Chocolate M&M's? Data collected from a bag of Milk Chocolate M&M's are provided.
-Are all colors equally likely for Dark Chocolate M&M's? Data collected from a bag of Dark Chocolate M&M's are provided.
 Test, at the 5% level, if this sample provides evidence that not all colors are equally likely for Dark Chocolate M&M's. Include all details of the test.
Are all colors equally likely for Milk Chocolate M&M's? Data collected from a bag of Milk Chocolate M&M's are provided.
-Are all colors equally likely for Dark Chocolate M&M's? Data collected from a bag of Dark Chocolate M&M's are provided.
Test, at the 5% level, if this sample provides evidence that not all colors are equally likely for Dark Chocolate M&M's. Include all details of the test. Question
Use the following to answer the questions below:
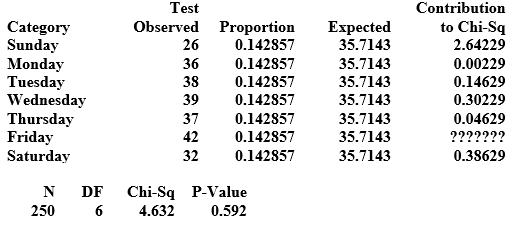
An insurance agent is interested in knowing if car crashes are more likely to occur on some days of the week than others. She selects a random sample of 250 insurance claims involving car crashes. Computer output from her chi-square test is provided.
-Is a chi-square test appropriate in this situation?
Question
Use the following to answer the questions below:
An insurance agent is interested in knowing if car crashes are more likely to occur on some days of the week than others. She selects a random sample of 250 insurance claims involving car crashes. Computer output from her chi-square test is provided.
-Test, at the 5% level, if there is evidence that car crashes are not equally like to occur on all days of the week. Include all details of the test.
Question
Use the following to answer the questions below:
An insurance agent is interested in knowing if car crashes are more likely to occur on some days of the week than others. She selects a random sample of 250 insurance claims involving car crashes. Computer output from her chi-square test is provided.
-The contribution for Friday is missing. Compute the contribution for Friday. Report your answer with three decimal places.
Question
Use the following to answer the questions below:
Observed counts from a sample are provided in the following table. The expected counts from a null hypothesis are given in parentheses.

-What is the - test statistic?
A) 3.941
B) 3.711
C) 4.315
D) 2.983
Observed counts from a sample are provided in the following table. The expected counts from a null hypothesis are given in parentheses.
-What is the
- test statistic?A) 3.941
B) 3.711
C) 4.315
D) 2.983
Question
Use the following to answer the questions below:
Observed counts from a sample are provided in the following table. The expected counts from a null hypothesis are given in parentheses.
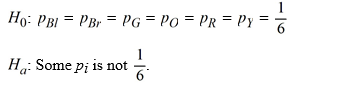
-Based on the expected counts, which of the following is most likely the null hypothesis?
A) :
:  =
=  =
=  =
= 
B) :
:  = 0.25,
  = 0.25,
  = 0.5
= 0.5
C) :
:  = 0.2,
  = 0.4,
  = 0.4
= 0.4
D)
Observed counts from a sample are provided in the following table. The expected counts from a null hypothesis are given in parentheses.
-Based on the expected counts, which of the following is most likely the null hypothesis?
A)
: = = = B)
: = 0.25, = 0.25, = 0.5C)
: = 0.2, = 0.4, = 0.4D)
Question
Use the following to answer the questions below:
In a survey conducted by the Gallup organization, 1,017 adults were asked "In general, how much trust and confidence do you have in the mass media - such as newspapers, TV, and radio - when it comes to reporting the news fully, accurately, and fairly?" The results are summarized in the provided table.
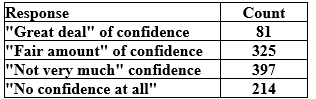
We are interested in testing whether or not the four responses are equally likely.
-Is a chi-square test appropriate in this situation?
In a survey conducted by the Gallup organization, 1,017 adults were asked "In general, how much trust and confidence do you have in the mass media - such as newspapers, TV, and radio - when it comes to reporting the news fully, accurately, and fairly?" The results are summarized in the provided table.
We are interested in testing whether or not the four responses are equally likely.
-Is a chi-square test appropriate in this situation?
Question
Use the following to answer the questions below:
In a survey conducted by the Gallup organization, 1,017 adults were asked "In general, how much trust and confidence do you have in the mass media - such as newspapers, TV, and radio - when it comes to reporting the news fully, accurately, and fairly?" The results are summarized in the provided table.
We are interested in testing whether or not the four responses are equally likely.
-Test, at the 5% level, if there is evidence that the four opinions are not all equally likely. Include all details of the test.
Question
Use the following to answer the questions below:
In a survey conducted by the Gallup organization, 1,017 adults were asked "In general, how much trust and confidence do you have in the mass media - such as newspapers, TV, and radio - when it comes to reporting the news fully, accurately, and fairly?" The results are summarized in the provided table.
We are interested in testing whether or not the four responses are equally likely.
-Which opinion has the largest contribution to the chi-square test statistic? For this age group, is the observed count smaller or larger than the expected count?
Question
Use the following to answer the questions below:
Upon request, the Mars Company (the maker of M&M's) will provide the color distribution for their candies. As of August 2009, they noted that
"Our color blends were selected by conducting consumer preference tests, which indicate the assortment of colors that pleased the greatest number of people and created the most attractive overall effect.
On average, our mix of colors for M&M'S CHOCOLATE CANDIES is:
M&M'S MILK CHOCOLATE: 24% cyan blue, 20% orange, 16% green, 14% bright yellow, 13% red, 13% brown."
Data collected from a bag of Milk Chocolate M&M's are provided.

We want to determine if this sample provides evidence that the color distribution has changed since August 2009.
-State the null and alternative hypotheses for testing if the color distribution for Milk Chocolate M&M's has changed since 2009.
Upon request, the Mars Company (the maker of M&M's) will provide the color distribution for their candies. As of August 2009, they noted that
"Our color blends were selected by conducting consumer preference tests, which indicate the assortment of colors that pleased the greatest number of people and created the most attractive overall effect.
On average, our mix of colors for M&M'S CHOCOLATE CANDIES is:
M&M'S MILK CHOCOLATE: 24% cyan blue, 20% orange, 16% green, 14% bright yellow, 13% red, 13% brown."
Data collected from a bag of Milk Chocolate M&M's are provided.
We want to determine if this sample provides evidence that the color distribution has changed since August 2009.
-State the null and alternative hypotheses for testing if the color distribution for Milk Chocolate M&M's has changed since 2009.
Question
Use the following to answer the questions below:
Upon request, the Mars Company (the maker of M&M's) will provide the color distribution for their candies. As of August 2009, they noted that
"Our color blends were selected by conducting consumer preference tests, which indicate the assortment of colors that pleased the greatest number of people and created the most attractive overall effect.
On average, our mix of colors for M&M'S CHOCOLATE CANDIES is:
M&M'S MILK CHOCOLATE: 24% cyan blue, 20% orange, 16% green, 14% bright yellow, 13% red, 13% brown."
Data collected from a bag of Milk Chocolate M&M's are provided.
We want to determine if this sample provides evidence that the color distribution has changed since August 2009.
-Find the expected counts for each color using the sample size (420 total candies) and null hypothesis.
Question
Use the following to answer the questions below:
Upon request, the Mars Company (the maker of M&M's) will provide the color distribution for their candies. As of August 2009, they noted that
"Our color blends were selected by conducting consumer preference tests, which indicate the assortment of colors that pleased the greatest number of people and created the most attractive overall effect.
On average, our mix of colors for M&M'S CHOCOLATE CANDIES is:
M&M'S MILK CHOCOLATE: 24% cyan blue, 20% orange, 16% green, 14% bright yellow, 13% red, 13% brown."
Data collected from a bag of Milk Chocolate M&M's are provided.
We want to determine if this sample provides evidence that the color distribution has changed since August 2009.
-Is a chi-square test appropriate in this situation?
Question
Use the following to answer the questions below:
Upon request, the Mars Company (the maker of M&M's) will provide the color distribution for their candies. As of August 2009, they noted that
"Our color blends were selected by conducting consumer preference tests, which indicate the assortment of colors that pleased the greatest number of people and created the most attractive overall effect.
On average, our mix of colors for M&M'S CHOCOLATE CANDIES is:
M&M'S MILK CHOCOLATE: 24% cyan blue, 20% orange, 16% green, 14% bright yellow, 13% red, 13% brown."
Data collected from a bag of Milk Chocolate M&M's are provided.
We want to determine if this sample provides evidence that the color distribution has changed since August 2009.
-Report the chi-square test statistic. Use three decimal places.
Question
Use the following to answer the questions below:
Upon request, the Mars Company (the maker of M&M's) will provide the color distribution for their candies. As of August 2009, they noted that
"Our color blends were selected by conducting consumer preference tests, which indicate the assortment of colors that pleased the greatest number of people and created the most attractive overall effect.
On average, our mix of colors for M&M'S CHOCOLATE CANDIES is:
M&M'S MILK CHOCOLATE: 24% cyan blue, 20% orange, 16% green, 14% bright yellow, 13% red, 13% brown."
Data collected from a bag of Milk Chocolate M&M's are provided.
We want to determine if this sample provides evidence that the color distribution has changed since August 2009.
-Report the p-value for your test. What conclusion can be made about the color distribution of Milk Chocolate M&M's? Use a 5% significance level.
A) p-value = 0.048
We have evidence that the color distribution of Milk Chocolate M&M's has changed since 2009.
B) p-value = 0.048
We have do not have evidence that the color distribution of Milk Chocolate M&M's has changed since 2009.
C) p-value = 0.052
We have evidence that the color distribution of Milk Chocolate M&M's has changed since 2009.
D) p-value = 0.052
We have do not have evidence that the color distribution of Milk Chocolate M&M's has changed since 2009.
Question
Use the following to answer the questions below:
Upon request, the Mars Company (the maker of M&M's) will provide the color distribution for their candies. As of August 2009, they noted that
"Our color blends were selected by conducting consumer preference tests, which indicate the assortment of colors that pleased the greatest number of people and created the most attractive overall effect.
On average, our mix of colors for M&M'S CHOCOLATE CANDIES is:
M&M'S MILK CHOCOLATE: 24% cyan blue, 20% orange, 16% green, 14% bright yellow, 13% red, 13% brown."
Data collected from a bag of Milk Chocolate M&M's are provided.
We want to determine if this sample provides evidence that the color distribution has changed since August 2009.
-Which color contributes the most to the chi-square test statistic? For that color, is the observed count larger or smaller than what we would expect under the null hypothesis?
Question
Use the following to answer the questions below:
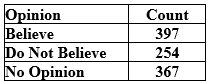
The Gallup organization surveyed a random sample of American adults about their belief in the theory of evolution. The responses are summarized in the provided table.
-Is a chi-square test appropriate for testing if all beliefs are not equally likely?
The Gallup organization surveyed a random sample of American adults about their belief in the theory of evolution. The responses are summarized in the provided table.
-Is a chi-square test appropriate for testing if all beliefs are not equally likely?
Question
Use the following to answer the questions below:
The Gallup organization surveyed a random sample of American adults about their belief in the theory of evolution. The responses are summarized in the provided table.
-Test, at the 5% level, if there is evidence that not all opinions are equally likely.
The Gallup organization surveyed a random sample of American adults about their belief in the theory of evolution. The responses are summarized in the provided table.
-Test, at the 5% level, if there is evidence that not all opinions are equally likely.
Question
Use the following to answer the questions below:
The Gallup organization surveyed a random sample of American adults about their belief in the theory of evolution. The responses are summarized in the provided table.
-Which opinion contributes the most to the chi-square test statistic? For that opinion, is the observed count larger or smaller than we would expect?
Question
Use the following to answer the questions below:
The Gallup organization surveyed a random sample of American adults about their belief in the theory of evolution. The responses are summarized in the provided table.
-In a survey, Gallup asked a random sample of U.S. adults if they would prefer to have a job outside the home, or if they would prefer to stay home to care for the family and home. The results are summarized below.
 Use the goodness-of-fit test to determine if there is evidence that the two choices are not equally likely. Use a 5% significance level.
The Gallup organization surveyed a random sample of American adults about their belief in the theory of evolution. The responses are summarized in the provided table.
-In a survey, Gallup asked a random sample of U.S. adults if they would prefer to have a job outside the home, or if they would prefer to stay home to care for the family and home. The results are summarized below.
Use the goodness-of-fit test to determine if there is evidence that the two choices are not equally likely. Use a 5% significance level. Question
Use the following to answer the questions below:
February 12, 2009 marked the 200th anniversary of Charles Darwin's birth. To celebrate, Gallup, a national polling organization, surveyed 1,018 Americans about their education level and their beliefs about the theory of evolution. The survey results are displayed in the provided two-way table. Note that the expected counts for most cells appear in parentheses.
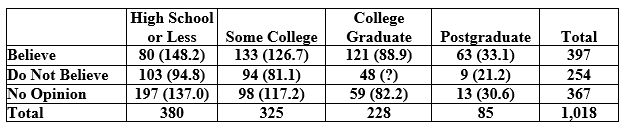
-Compute the expected cell count for the (College Graduate, Do Not Believe) cell. Report your answer with one decimal place.
February 12, 2009 marked the 200th anniversary of Charles Darwin's birth. To celebrate, Gallup, a national polling organization, surveyed 1,018 Americans about their education level and their beliefs about the theory of evolution. The survey results are displayed in the provided two-way table. Note that the expected counts for most cells appear in parentheses.
-Compute the expected cell count for the (College Graduate, Do Not Believe) cell. Report your answer with one decimal place.
Question
Use the following to answer the questions below:
February 12, 2009 marked the 200th anniversary of Charles Darwin's birth. To celebrate, Gallup, a national polling organization, surveyed 1,018 Americans about their education level and their beliefs about the theory of evolution. The survey results are displayed in the provided two-way table. Note that the expected counts for most cells appear in parentheses.
-Compute the contribution to the chi-square statistic for the (Postgraduate, Believe) cell. Report your answer to two decimal places.
Question
Use the following to answer the questions below:
February 12, 2009 marked the 200th anniversary of Charles Darwin's birth. To celebrate, Gallup, a national polling organization, surveyed 1,018 Americans about their education level and their beliefs about the theory of evolution. The survey results are displayed in the provided two-way table. Note that the expected counts for most cells appear in parentheses.
-What are the degrees of freedom for the test?
A) 6
B) 4
C) 3
D) 11
Question
Use the following to answer the questions below:
February 12, 2009 marked the 200th anniversary of Charles Darwin's birth. To celebrate, Gallup, a national polling organization, surveyed 1,018 Americans about their education level and their beliefs about the theory of evolution. The survey results are displayed in the provided two-way table. Note that the expected counts for most cells appear in parentheses.
-State the hypotheses for testing whether the data indicate that there is some association between education level and belief in evolution.
Question
Use the following to answer the questions below:
February 12, 2009 marked the 200th anniversary of Charles Darwin's birth. To celebrate, Gallup, a national polling organization, surveyed 1,018 Americans about their education level and their beliefs about the theory of evolution. The survey results are displayed in the provided two-way table. Note that the expected counts for most cells appear in parentheses.
-Is it appropriate to use a chi-square test to test for an association between education level and belief about evolution?
Question
Use the following to answer the questions below:
February 12, 2009 marked the 200th anniversary of Charles Darwin's birth. To celebrate, Gallup, a national polling organization, surveyed 1,018 Americans about their education level and their beliefs about the theory of evolution. The survey results are displayed in the provided two-way table. Note that the expected counts for most cells appear in parentheses.
-Using a 5% significance level and assuming the test statistic is = 127.451, compute the p-value and make an appropriate conclusion for this test. If there is a significant association between these two variables, describe how they are related.
February 12, 2009 marked the 200th anniversary of Charles Darwin's birth. To celebrate, Gallup, a national polling organization, surveyed 1,018 Americans about their education level and their beliefs about the theory of evolution. The survey results are displayed in the provided two-way table. Note that the expected counts for most cells appear in parentheses.
-Using a 5% significance level and assuming the test statistic is
= 127.451, compute the p-value and make an appropriate conclusion for this test. If there is a significant association between these two variables, describe how they are related. Question
Use the following to answer the questions below:
February 12, 2009 marked the 200th anniversary of Charles Darwin's birth. To celebrate, Gallup, a national polling organization, surveyed 1,018 Americans about their education level and their beliefs about the theory of evolution. The survey results are displayed in the provided two-way table. Note that the expected counts for most cells appear in parentheses.
-A study to investigate the dominant paw in cats was described in the scientific journal Animal Behaviour. The researchers used a random sample of 42 domestic cats. In this study, each cat was shown a treat (5 grams of tuna), and while the cat watched, the food was placed inside a jar. The opening of the jar was small enough that the cat could not stick its head inside to remove the treat. The researcher recorded the paw that was first used by the cat to try to retrieve the treat. This was repeated 100 times for each cat (over a span of several days). The paw used most often was deemed the dominant paw.
The researchers want to determine if there is a significant association between sex of the cat and dominant paw. Computer output from the analysis is provided. Is it appropriate to perform the chi-test to test for an association between sex and dominant paw in cats? If so, perform the test. If not, briefly explain why.
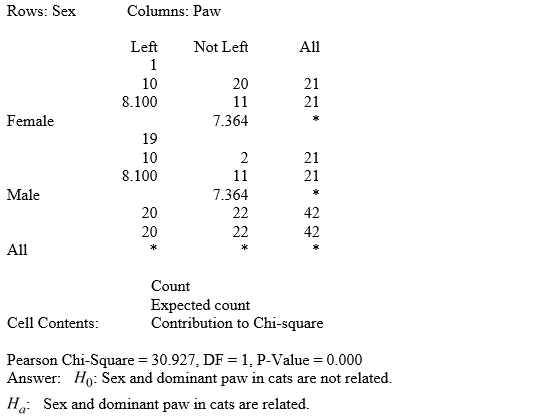
All expected cell counts are larger than 5, so it is appropriate to use the chi-square test.
Test Statistic: 30.927
Degrees of freedom: 1
p-value ≈ 0
There is very strong evidence that sex and the dominant paw in cats are related.
February 12, 2009 marked the 200th anniversary of Charles Darwin's birth. To celebrate, Gallup, a national polling organization, surveyed 1,018 Americans about their education level and their beliefs about the theory of evolution. The survey results are displayed in the provided two-way table. Note that the expected counts for most cells appear in parentheses.
-A study to investigate the dominant paw in cats was described in the scientific journal Animal Behaviour. The researchers used a random sample of 42 domestic cats. In this study, each cat was shown a treat (5 grams of tuna), and while the cat watched, the food was placed inside a jar. The opening of the jar was small enough that the cat could not stick its head inside to remove the treat. The researcher recorded the paw that was first used by the cat to try to retrieve the treat. This was repeated 100 times for each cat (over a span of several days). The paw used most often was deemed the dominant paw.
The researchers want to determine if there is a significant association between sex of the cat and dominant paw. Computer output from the analysis is provided. Is it appropriate to perform the chi-test to test for an association between sex and dominant paw in cats? If so, perform the test. If not, briefly explain why.
All expected cell counts are larger than 5, so it is appropriate to use the chi-square test.
Test Statistic: 30.927
Degrees of freedom: 1
p-value ≈ 0
There is very strong evidence that sex and the dominant paw in cats are related.
Question
Use the following to answer the questions below:
February 12, 2009 marked the 200th anniversary of Charles Darwin's birth. To celebrate, Gallup, a national polling organization, surveyed 1,018 Americans about their education level and their beliefs about the theory of evolution. The survey results are displayed in the provided two-way table. Note that the expected counts for most cells appear in parentheses.
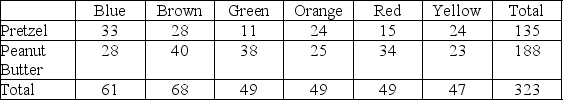
-M&M's, the popular candy-coated chocolate treats, come in a variety of flavors. One of the newest varieties is Pretzel, and another popular variety is Peanut Butter. Does the Mars Company (the maker of M&M's) use the same color distribution (frequency of colors) for all varieties, or does it depend on variety? Data collected on the two varieties are displayed in the provided two-way table. Test, at the 5% level, if the samples provide evidence of an association between color and variety. Include all of the details of the test.
February 12, 2009 marked the 200th anniversary of Charles Darwin's birth. To celebrate, Gallup, a national polling organization, surveyed 1,018 Americans about their education level and their beliefs about the theory of evolution. The survey results are displayed in the provided two-way table. Note that the expected counts for most cells appear in parentheses.
-M&M's, the popular candy-coated chocolate treats, come in a variety of flavors. One of the newest varieties is Pretzel, and another popular variety is Peanut Butter. Does the Mars Company (the maker of M&M's) use the same color distribution (frequency of colors) for all varieties, or does it depend on variety? Data collected on the two varieties are displayed in the provided two-way table. Test, at the 5% level, if the samples provide evidence of an association between color and variety. Include all of the details of the test.
Question
Use the following to answer the questions below:
M&M's, the popular candy-coated chocolate treats, come in a variety of flavors. Two popular varieties are Milk Chocolate (sometimes referred to as "Plain") and Peanut. Does the Mars Company (the maker of M&M's) use the same color distribution (frequency of colors) for all varieties, or does it depend on variety? Data were collected on the two varieties and computer output for a chi-square test of association is provided.
?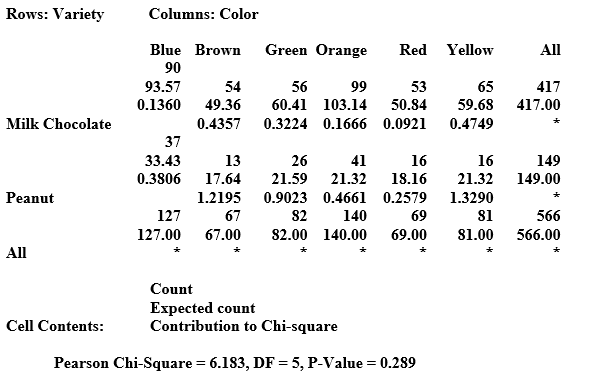
-Is it appropriate to use a chi-square test to test for an association between variety and color?
Question
Use the following to answer the questions below:
M&M's, the popular candy-coated chocolate treats, come in a variety of flavors. Two popular varieties are Milk Chocolate (sometimes referred to as "Plain") and Peanut. Does the Mars Company (the maker of M&M's) use the same color distribution (frequency of colors) for all varieties, or does it depend on variety? Data were collected on the two varieties and computer output for a chi-square test of association is provided.
-Test, at the 5% level, if there is a significant association between variety and color. Include all details of the test.
Question
Use the following to answer the questions below:
We have a random sample of 150 students (60 males and 90 females) that includes two variables: Smoke = "yes" or "no" and Gender = "female (F)" or "Male (M)." The two-way table below summarizes the results.
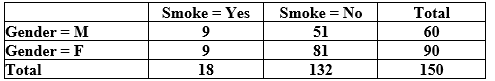
-Is it appropriate to use a chi-square test to test for an association between gender and smoking status?
We have a random sample of 150 students (60 males and 90 females) that includes two variables: Smoke = "yes" or "no" and Gender = "female (F)" or "Male (M)." The two-way table below summarizes the results.
-Is it appropriate to use a chi-square test to test for an association between gender and smoking status?
Question
Use the following to answer the questions below:
We have a random sample of 150 students (60 males and 90 females) that includes two variables: Smoke = "yes" or "no" and Gender = "female (F)" or "Male (M)." The two-way table below summarizes the results.
-Test, at the 10% level, if there is a significant association between gender and smoking status among students at this university. Include all of the details of the test.
Question
Use the following to answer the questions below:
A political science professor at a small university wants to know if political party affiliation is significantly associated with trust in the media. He randomly selects 66 Democrats, 63 Republicans, and 41 Independents. Computer output of his chi-square analysis is provided.
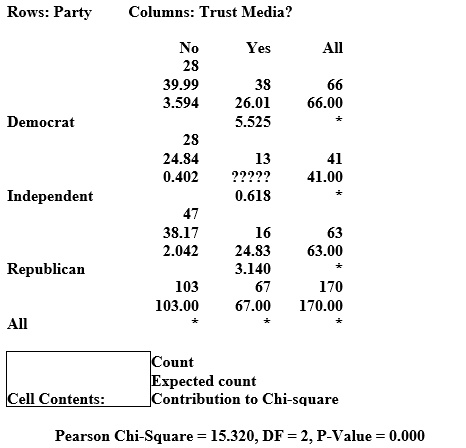
-The expected count for the (Independent, Yes) cell is missing. Compute the expected count for this cell. Report your answer with two decimal places.
A political science professor at a small university wants to know if political party affiliation is significantly associated with trust in the media. He randomly selects 66 Democrats, 63 Republicans, and 41 Independents. Computer output of his chi-square analysis is provided.
-The expected count for the (Independent, Yes) cell is missing. Compute the expected count for this cell. Report your answer with two decimal places.
Question
Use the following to answer the questions below:
A political science professor at a small university wants to know if political party affiliation is significantly associated with trust in the media. He randomly selects 66 Democrats, 63 Republicans, and 41 Independents. Computer output of his chi-square analysis is provided.
-Is it appropriate to use a chi-square test to test for an association between political party and trust in the media?
Question
Use the following to answer the questions below:
A political science professor at a small university wants to know if political party affiliation is significantly associated with trust in the media. He randomly selects 66 Democrats, 63 Republicans, and 41 Independents. Computer output of his chi-square analysis is provided.
-Test, at the 5% level, if there is a significant association between political party affiliation and trust in the media. Include all details of the test.
Question
Use the following to answer the questions below:
A political science professor at a small university wants to know if political party affiliation is significantly associated with trust in the media. He randomly selects 66 Democrats, 63 Republicans, and 41 Independents. Computer output of his chi-square analysis is provided.
-Which cell has the largest contribution to the chi-square statistic? For this cell, is the observed count larger or smaller than the expected count?
Question
Use the following to answer the questions below:
The Gallup organization recently conducted a survey of 1,015 randomly selected U.S. adults about "Black Friday" shopping. They asked the following question:
"As you know, the Friday after Thanksgiving is one of the biggest shopping days of the year.
Looking ahead, do you personally plan on shopping on the Friday after Thanksgiving, or not?"
Their results, broken down by sex, are summarized in the provided two-way table.
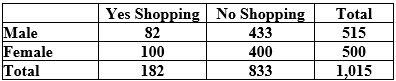
-Compute the expected cell counts for all cells. Report your counts to two decimal places.
The Gallup organization recently conducted a survey of 1,015 randomly selected U.S. adults about "Black Friday" shopping. They asked the following question:
"As you know, the Friday after Thanksgiving is one of the biggest shopping days of the year.
Looking ahead, do you personally plan on shopping on the Friday after Thanksgiving, or not?"
Their results, broken down by sex, are summarized in the provided two-way table.
-Compute the expected cell counts for all cells. Report your counts to two decimal places.
Question
Use the following to answer the questions below:
The Gallup organization recently conducted a survey of 1,015 randomly selected U.S. adults about "Black Friday" shopping. They asked the following question:
"As you know, the Friday after Thanksgiving is one of the biggest shopping days of the year.
Looking ahead, do you personally plan on shopping on the Friday after Thanksgiving, or not?"
Their results, broken down by sex, are summarized in the provided two-way table.
-Is it appropriate to use a chi-square test to test for an association between sex and plans to shop the Friday after Thanksgiving?
Question
Use the following to answer the questions below:
The Gallup organization recently conducted a survey of 1,015 randomly selected U.S. adults about "Black Friday" shopping. They asked the following question:
"As you know, the Friday after Thanksgiving is one of the biggest shopping days of the year.
Looking ahead, do you personally plan on shopping on the Friday after Thanksgiving, or not?"
Their results, broken down by sex, are summarized in the provided two-way table.
-Test, at the 1% level, if there is a significant association between sex and plans to shop the Friday after Thanksgiving. Include all details of your test.
Question
Use the following to answer the questions below:
The Gallup organization recently conducted a survey of 1,015 randomly selected U.S. adults about "Black Friday" shopping. They asked the following question:
"As you know, the Friday after Thanksgiving is one of the biggest shopping days of the year.
Looking ahead, do you personally plan on shopping on the Friday after Thanksgiving, or not?"
Their results, broken down by sex, are summarized in the provided two-way table.
-The Gallup organization asked a random sample of U.S. adults if they would prefer to have a job outside the home, or if they would prefer to stay home to care for the family and home. Of the 504 males they surveyed, 391 said that they would prefer to have a job outside of the home. Of the 473 females they surveyed, 254 said that they would prefer a job outside of the home.
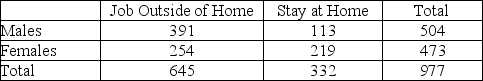
Test, at the 5% level, if there is evidence of an association between sex and preference to have a job outside of the home. Include all details of the test.
The Gallup organization recently conducted a survey of 1,015 randomly selected U.S. adults about "Black Friday" shopping. They asked the following question:
"As you know, the Friday after Thanksgiving is one of the biggest shopping days of the year.
Looking ahead, do you personally plan on shopping on the Friday after Thanksgiving, or not?"
Their results, broken down by sex, are summarized in the provided two-way table.
-The Gallup organization asked a random sample of U.S. adults if they would prefer to have a job outside the home, or if they would prefer to stay home to care for the family and home. Of the 504 males they surveyed, 391 said that they would prefer to have a job outside of the home. Of the 473 females they surveyed, 254 said that they would prefer a job outside of the home.
Test, at the 5% level, if there is evidence of an association between sex and preference to have a job outside of the home. Include all details of the test.

Unlock Deck
Sign up to unlock the cards in this deck!
Unlock Deck
Unlock Deck
1/45
Play
Full screen (f)
Deck 7: CHI-Square Tests for Categorical Variables
1
Use the following to answer the questions below:
Are all colors equally likely for Milk Chocolate M&M's? Data collected from a bag of Milk Chocolate M&M's are provided.
-State the null and alternative hypotheses for testing if the colors are not all equally likely for Milk Chocolate M&M's.
Are all colors equally likely for Milk Chocolate M&M's? Data collected from a bag of Milk Chocolate M&M's are provided.
-State the null and alternative hypotheses for testing if the colors are not all equally likely for Milk Chocolate M&M's.
2
Use the following to answer the questions below:
Are all colors equally likely for Milk Chocolate M&M's? Data collected from a bag of Milk Chocolate M&M's are provided.
-If all colors are equally likely, how many candies of each color (in a bag of 420 candies) would we expect to see?
Are all colors equally likely for Milk Chocolate M&M's? Data collected from a bag of Milk Chocolate M&M's are provided.
-If all colors are equally likely, how many candies of each color (in a bag of 420 candies) would we expect to see?
70
3
Use the following to answer the questions below:
Are all colors equally likely for Milk Chocolate M&M's? Data collected from a bag of Milk Chocolate M&M's are provided.
-Is a chi-square test appropriate in this situation?
Are all colors equally likely for Milk Chocolate M&M's? Data collected from a bag of Milk Chocolate M&M's are provided.
-Is a chi-square test appropriate in this situation?
True
4
Use the following to answer the questions below:
Are all colors equally likely for Milk Chocolate M&M's? Data collected from a bag of Milk Chocolate M&M's are provided.
-Calculate the chi-square test statistic. Report your answer with three decimal places.
Are all colors equally likely for Milk Chocolate M&M's? Data collected from a bag of Milk Chocolate M&M's are provided.
-Calculate the chi-square test statistic. Report your answer with three decimal places.
Unlock Deck
Unlock for access to all 45 flashcards in this deck.
Unlock Deck
k this deck
5
Use the following to answer the questions below:
Are all colors equally likely for Milk Chocolate M&M's? Data collected from a bag of Milk Chocolate M&M's are provided.
-Report the p-value for your test. What conclusion can be made about the color distribution for Milk Chocolate M&M's? Use a 5% significance level.
Are all colors equally likely for Milk Chocolate M&M's? Data collected from a bag of Milk Chocolate M&M's are provided.
-Report the p-value for your test. What conclusion can be made about the color distribution for Milk Chocolate M&M's? Use a 5% significance level.
Unlock Deck
Unlock for access to all 45 flashcards in this deck.
Unlock Deck
k this deck
6
Use the following to answer the questions below:
Are all colors equally likely for Milk Chocolate M&M's? Data collected from a bag of Milk Chocolate M&M's are provided.
-Which color contributes the most to the chi-square test statistic? For this color, is the observed count smaller or larger than the expected count?
Are all colors equally likely for Milk Chocolate M&M's? Data collected from a bag of Milk Chocolate M&M's are provided.
-Which color contributes the most to the chi-square test statistic? For this color, is the observed count smaller or larger than the expected count?
Unlock Deck
Unlock for access to all 45 flashcards in this deck.
Unlock Deck
k this deck
7
Use the following to answer the questions below:
Are all colors equally likely for Milk Chocolate M&M's? Data collected from a bag of Milk Chocolate M&M's are provided.
-Are all colors equally likely for Dark Chocolate M&M's? Data collected from a bag of Dark Chocolate M&M's are provided.
Test, at the 5% level, if this sample provides evidence that not all colors are equally likely for Dark Chocolate M&M's. Include all details of the test.
Are all colors equally likely for Milk Chocolate M&M's? Data collected from a bag of Milk Chocolate M&M's are provided.
-Are all colors equally likely for Dark Chocolate M&M's? Data collected from a bag of Dark Chocolate M&M's are provided.
Test, at the 5% level, if this sample provides evidence that not all colors are equally likely for Dark Chocolate M&M's. Include all details of the test. Unlock Deck
Unlock for access to all 45 flashcards in this deck.
Unlock Deck
k this deck
8
Use the following to answer the questions below:
An insurance agent is interested in knowing if car crashes are more likely to occur on some days of the week than others. She selects a random sample of 250 insurance claims involving car crashes. Computer output from her chi-square test is provided.
-Is a chi-square test appropriate in this situation?
Unlock Deck
Unlock for access to all 45 flashcards in this deck.
Unlock Deck
k this deck
9
Use the following to answer the questions below:
An insurance agent is interested in knowing if car crashes are more likely to occur on some days of the week than others. She selects a random sample of 250 insurance claims involving car crashes. Computer output from her chi-square test is provided.
-Test, at the 5% level, if there is evidence that car crashes are not equally like to occur on all days of the week. Include all details of the test.
Unlock Deck
Unlock for access to all 45 flashcards in this deck.
Unlock Deck
k this deck
10
Use the following to answer the questions below:
An insurance agent is interested in knowing if car crashes are more likely to occur on some days of the week than others. She selects a random sample of 250 insurance claims involving car crashes. Computer output from her chi-square test is provided.
-The contribution for Friday is missing. Compute the contribution for Friday. Report your answer with three decimal places.
Unlock Deck
Unlock for access to all 45 flashcards in this deck.
Unlock Deck
k this deck
11
Use the following to answer the questions below:
Observed counts from a sample are provided in the following table. The expected counts from a null hypothesis are given in parentheses.
-What is the - test statistic?
A) 3.941
B) 3.711
C) 4.315
D) 2.983
Observed counts from a sample are provided in the following table. The expected counts from a null hypothesis are given in parentheses.
-What is the
- test statistic?A) 3.941
B) 3.711
C) 4.315
D) 2.983
Unlock Deck
Unlock for access to all 45 flashcards in this deck.
Unlock Deck
k this deck
12
Use the following to answer the questions below:
Observed counts from a sample are provided in the following table. The expected counts from a null hypothesis are given in parentheses.
-Based on the expected counts, which of the following is most likely the null hypothesis?
A) : = = =
B) : = 0.25, = 0.25, = 0.5
C) : = 0.2, = 0.4, = 0.4
D)
Observed counts from a sample are provided in the following table. The expected counts from a null hypothesis are given in parentheses.
-Based on the expected counts, which of the following is most likely the null hypothesis?
A)
: = = = B)
: = 0.25, = 0.25, = 0.5C)
: = 0.2, = 0.4, = 0.4D)
Unlock Deck
Unlock for access to all 45 flashcards in this deck.
Unlock Deck
k this deck
13
Use the following to answer the questions below:
In a survey conducted by the Gallup organization, 1,017 adults were asked "In general, how much trust and confidence do you have in the mass media - such as newspapers, TV, and radio - when it comes to reporting the news fully, accurately, and fairly?" The results are summarized in the provided table.
We are interested in testing whether or not the four responses are equally likely.
-Is a chi-square test appropriate in this situation?
Unlock Deck
Unlock for access to all 45 flashcards in this deck.
Unlock Deck
k this deck
14
Use the following to answer the questions below:
In a survey conducted by the Gallup organization, 1,017 adults were asked "In general, how much trust and confidence do you have in the mass media - such as newspapers, TV, and radio - when it comes to reporting the news fully, accurately, and fairly?" The results are summarized in the provided table.
We are interested in testing whether or not the four responses are equally likely.
-Test, at the 5% level, if there is evidence that the four opinions are not all equally likely. Include all details of the test.
Unlock Deck
Unlock for access to all 45 flashcards in this deck.
Unlock Deck
k this deck
15
Use the following to answer the questions below:
In a survey conducted by the Gallup organization, 1,017 adults were asked "In general, how much trust and confidence do you have in the mass media - such as newspapers, TV, and radio - when it comes to reporting the news fully, accurately, and fairly?" The results are summarized in the provided table.
We are interested in testing whether or not the four responses are equally likely.
-Which opinion has the largest contribution to the chi-square test statistic? For this age group, is the observed count smaller or larger than the expected count?
Unlock Deck
Unlock for access to all 45 flashcards in this deck.
Unlock Deck
k this deck
16
Use the following to answer the questions below:
Upon request, the Mars Company (the maker of M&M's) will provide the color distribution for their candies. As of August 2009, they noted that
"Our color blends were selected by conducting consumer preference tests, which indicate the assortment of colors that pleased the greatest number of people and created the most attractive overall effect.
On average, our mix of colors for M&M'S CHOCOLATE CANDIES is:
M&M'S MILK CHOCOLATE: 24% cyan blue, 20% orange, 16% green, 14% bright yellow, 13% red, 13% brown."
Data collected from a bag of Milk Chocolate M&M's are provided.
We want to determine if this sample provides evidence that the color distribution has changed since August 2009.
-State the null and alternative hypotheses for testing if the color distribution for Milk Chocolate M&M's has changed since 2009.
Unlock Deck
Unlock for access to all 45 flashcards in this deck.
Unlock Deck
k this deck
17
Use the following to answer the questions below:
Upon request, the Mars Company (the maker of M&M's) will provide the color distribution for their candies. As of August 2009, they noted that
"Our color blends were selected by conducting consumer preference tests, which indicate the assortment of colors that pleased the greatest number of people and created the most attractive overall effect.
On average, our mix of colors for M&M'S CHOCOLATE CANDIES is:
M&M'S MILK CHOCOLATE: 24% cyan blue, 20% orange, 16% green, 14% bright yellow, 13% red, 13% brown."
Data collected from a bag of Milk Chocolate M&M's are provided.
We want to determine if this sample provides evidence that the color distribution has changed since August 2009.
-Find the expected counts for each color using the sample size (420 total candies) and null hypothesis.
Unlock Deck
Unlock for access to all 45 flashcards in this deck.
Unlock Deck
k this deck
18
Use the following to answer the questions below:
Upon request, the Mars Company (the maker of M&M's) will provide the color distribution for their candies. As of August 2009, they noted that
"Our color blends were selected by conducting consumer preference tests, which indicate the assortment of colors that pleased the greatest number of people and created the most attractive overall effect.
On average, our mix of colors for M&M'S CHOCOLATE CANDIES is:
M&M'S MILK CHOCOLATE: 24% cyan blue, 20% orange, 16% green, 14% bright yellow, 13% red, 13% brown."
Data collected from a bag of Milk Chocolate M&M's are provided.
We want to determine if this sample provides evidence that the color distribution has changed since August 2009.
-Is a chi-square test appropriate in this situation?
Unlock Deck
Unlock for access to all 45 flashcards in this deck.
Unlock Deck
k this deck
19
Use the following to answer the questions below:
Upon request, the Mars Company (the maker of M&M's) will provide the color distribution for their candies. As of August 2009, they noted that
"Our color blends were selected by conducting consumer preference tests, which indicate the assortment of colors that pleased the greatest number of people and created the most attractive overall effect.
On average, our mix of colors for M&M'S CHOCOLATE CANDIES is:
M&M'S MILK CHOCOLATE: 24% cyan blue, 20% orange, 16% green, 14% bright yellow, 13% red, 13% brown."
Data collected from a bag of Milk Chocolate M&M's are provided.
We want to determine if this sample provides evidence that the color distribution has changed since August 2009.
-Report the chi-square test statistic. Use three decimal places.
Unlock Deck
Unlock for access to all 45 flashcards in this deck.
Unlock Deck
k this deck
20
Use the following to answer the questions below:
Upon request, the Mars Company (the maker of M&M's) will provide the color distribution for their candies. As of August 2009, they noted that
"Our color blends were selected by conducting consumer preference tests, which indicate the assortment of colors that pleased the greatest number of people and created the most attractive overall effect.
On average, our mix of colors for M&M'S CHOCOLATE CANDIES is:
M&M'S MILK CHOCOLATE: 24% cyan blue, 20% orange, 16% green, 14% bright yellow, 13% red, 13% brown."
Data collected from a bag of Milk Chocolate M&M's are provided.
We want to determine if this sample provides evidence that the color distribution has changed since August 2009.
-Report the p-value for your test. What conclusion can be made about the color distribution of Milk Chocolate M&M's? Use a 5% significance level.
A) p-value = 0.048
We have evidence that the color distribution of Milk Chocolate M&M's has changed since 2009.
B) p-value = 0.048
We have do not have evidence that the color distribution of Milk Chocolate M&M's has changed since 2009.
C) p-value = 0.052
We have evidence that the color distribution of Milk Chocolate M&M's has changed since 2009.
D) p-value = 0.052
We have do not have evidence that the color distribution of Milk Chocolate M&M's has changed since 2009.
Unlock Deck
Unlock for access to all 45 flashcards in this deck.
Unlock Deck
k this deck
21
Use the following to answer the questions below:
Upon request, the Mars Company (the maker of M&M's) will provide the color distribution for their candies. As of August 2009, they noted that
"Our color blends were selected by conducting consumer preference tests, which indicate the assortment of colors that pleased the greatest number of people and created the most attractive overall effect.
On average, our mix of colors for M&M'S CHOCOLATE CANDIES is:
M&M'S MILK CHOCOLATE: 24% cyan blue, 20% orange, 16% green, 14% bright yellow, 13% red, 13% brown."
Data collected from a bag of Milk Chocolate M&M's are provided.
We want to determine if this sample provides evidence that the color distribution has changed since August 2009.
-Which color contributes the most to the chi-square test statistic? For that color, is the observed count larger or smaller than what we would expect under the null hypothesis?
Unlock Deck
Unlock for access to all 45 flashcards in this deck.
Unlock Deck
k this deck
22
Use the following to answer the questions below:
The Gallup organization surveyed a random sample of American adults about their belief in the theory of evolution. The responses are summarized in the provided table.
-Is a chi-square test appropriate for testing if all beliefs are not equally likely?
The Gallup organization surveyed a random sample of American adults about their belief in the theory of evolution. The responses are summarized in the provided table.
-Is a chi-square test appropriate for testing if all beliefs are not equally likely?
Unlock Deck
Unlock for access to all 45 flashcards in this deck.
Unlock Deck
k this deck
23
Use the following to answer the questions below:
The Gallup organization surveyed a random sample of American adults about their belief in the theory of evolution. The responses are summarized in the provided table.
-Test, at the 5% level, if there is evidence that not all opinions are equally likely.
The Gallup organization surveyed a random sample of American adults about their belief in the theory of evolution. The responses are summarized in the provided table.
-Test, at the 5% level, if there is evidence that not all opinions are equally likely.
Unlock Deck
Unlock for access to all 45 flashcards in this deck.
Unlock Deck
k this deck
24
Use the following to answer the questions below:
The Gallup organization surveyed a random sample of American adults about their belief in the theory of evolution. The responses are summarized in the provided table.
-Which opinion contributes the most to the chi-square test statistic? For that opinion, is the observed count larger or smaller than we would expect?
Unlock Deck
Unlock for access to all 45 flashcards in this deck.
Unlock Deck
k this deck
25
Use the following to answer the questions below:
The Gallup organization surveyed a random sample of American adults about their belief in the theory of evolution. The responses are summarized in the provided table.
-In a survey, Gallup asked a random sample of U.S. adults if they would prefer to have a job outside the home, or if they would prefer to stay home to care for the family and home. The results are summarized below.
Use the goodness-of-fit test to determine if there is evidence that the two choices are not equally likely. Use a 5% significance level.
The Gallup organization surveyed a random sample of American adults about their belief in the theory of evolution. The responses are summarized in the provided table.
-In a survey, Gallup asked a random sample of U.S. adults if they would prefer to have a job outside the home, or if they would prefer to stay home to care for the family and home. The results are summarized below.
Use the goodness-of-fit test to determine if there is evidence that the two choices are not equally likely. Use a 5% significance level. Unlock Deck
Unlock for access to all 45 flashcards in this deck.
Unlock Deck
k this deck
26
Use the following to answer the questions below:
February 12, 2009 marked the 200th anniversary of Charles Darwin's birth. To celebrate, Gallup, a national polling organization, surveyed 1,018 Americans about their education level and their beliefs about the theory of evolution. The survey results are displayed in the provided two-way table. Note that the expected counts for most cells appear in parentheses.
-Compute the expected cell count for the (College Graduate, Do Not Believe) cell. Report your answer with one decimal place.
Unlock Deck
Unlock for access to all 45 flashcards in this deck.
Unlock Deck
k this deck
27
Use the following to answer the questions below:
February 12, 2009 marked the 200th anniversary of Charles Darwin's birth. To celebrate, Gallup, a national polling organization, surveyed 1,018 Americans about their education level and their beliefs about the theory of evolution. The survey results are displayed in the provided two-way table. Note that the expected counts for most cells appear in parentheses.
-Compute the contribution to the chi-square statistic for the (Postgraduate, Believe) cell. Report your answer to two decimal places.
Unlock Deck
Unlock for access to all 45 flashcards in this deck.
Unlock Deck
k this deck
28
Use the following to answer the questions below:
February 12, 2009 marked the 200th anniversary of Charles Darwin's birth. To celebrate, Gallup, a national polling organization, surveyed 1,018 Americans about their education level and their beliefs about the theory of evolution. The survey results are displayed in the provided two-way table. Note that the expected counts for most cells appear in parentheses.
-What are the degrees of freedom for the test?
A) 6
B) 4
C) 3
D) 11
Unlock Deck
Unlock for access to all 45 flashcards in this deck.
Unlock Deck
k this deck
29
Use the following to answer the questions below:
February 12, 2009 marked the 200th anniversary of Charles Darwin's birth. To celebrate, Gallup, a national polling organization, surveyed 1,018 Americans about their education level and their beliefs about the theory of evolution. The survey results are displayed in the provided two-way table. Note that the expected counts for most cells appear in parentheses.
-State the hypotheses for testing whether the data indicate that there is some association between education level and belief in evolution.
Unlock Deck
Unlock for access to all 45 flashcards in this deck.
Unlock Deck
k this deck
30
Use the following to answer the questions below:
February 12, 2009 marked the 200th anniversary of Charles Darwin's birth. To celebrate, Gallup, a national polling organization, surveyed 1,018 Americans about their education level and their beliefs about the theory of evolution. The survey results are displayed in the provided two-way table. Note that the expected counts for most cells appear in parentheses.
-Is it appropriate to use a chi-square test to test for an association between education level and belief about evolution?
Unlock Deck
Unlock for access to all 45 flashcards in this deck.
Unlock Deck
k this deck
31
Use the following to answer the questions below:
February 12, 2009 marked the 200th anniversary of Charles Darwin's birth. To celebrate, Gallup, a national polling organization, surveyed 1,018 Americans about their education level and their beliefs about the theory of evolution. The survey results are displayed in the provided two-way table. Note that the expected counts for most cells appear in parentheses.
-Using a 5% significance level and assuming the test statistic is = 127.451, compute the p-value and make an appropriate conclusion for this test. If there is a significant association between these two variables, describe how they are related.
February 12, 2009 marked the 200th anniversary of Charles Darwin's birth. To celebrate, Gallup, a national polling organization, surveyed 1,018 Americans about their education level and their beliefs about the theory of evolution. The survey results are displayed in the provided two-way table. Note that the expected counts for most cells appear in parentheses.
-Using a 5% significance level and assuming the test statistic is
= 127.451, compute the p-value and make an appropriate conclusion for this test. If there is a significant association between these two variables, describe how they are related. Unlock Deck
Unlock for access to all 45 flashcards in this deck.
Unlock Deck
k this deck
32
Use the following to answer the questions below:
February 12, 2009 marked the 200th anniversary of Charles Darwin's birth. To celebrate, Gallup, a national polling organization, surveyed 1,018 Americans about their education level and their beliefs about the theory of evolution. The survey results are displayed in the provided two-way table. Note that the expected counts for most cells appear in parentheses.
-A study to investigate the dominant paw in cats was described in the scientific journal Animal Behaviour. The researchers used a random sample of 42 domestic cats. In this study, each cat was shown a treat (5 grams of tuna), and while the cat watched, the food was placed inside a jar. The opening of the jar was small enough that the cat could not stick its head inside to remove the treat. The researcher recorded the paw that was first used by the cat to try to retrieve the treat. This was repeated 100 times for each cat (over a span of several days). The paw used most often was deemed the dominant paw.
The researchers want to determine if there is a significant association between sex of the cat and dominant paw. Computer output from the analysis is provided. Is it appropriate to perform the chi-test to test for an association between sex and dominant paw in cats? If so, perform the test. If not, briefly explain why.
All expected cell counts are larger than 5, so it is appropriate to use the chi-square test.
Test Statistic: 30.927
Degrees of freedom: 1
p-value ≈ 0
There is very strong evidence that sex and the dominant paw in cats are related.
Unlock Deck
Unlock for access to all 45 flashcards in this deck.
Unlock Deck
k this deck
33
Use the following to answer the questions below:
February 12, 2009 marked the 200th anniversary of Charles Darwin's birth. To celebrate, Gallup, a national polling organization, surveyed 1,018 Americans about their education level and their beliefs about the theory of evolution. The survey results are displayed in the provided two-way table. Note that the expected counts for most cells appear in parentheses.
-M&M's, the popular candy-coated chocolate treats, come in a variety of flavors. One of the newest varieties is Pretzel, and another popular variety is Peanut Butter. Does the Mars Company (the maker of M&M's) use the same color distribution (frequency of colors) for all varieties, or does it depend on variety? Data collected on the two varieties are displayed in the provided two-way table. Test, at the 5% level, if the samples provide evidence of an association between color and variety. Include all of the details of the test.
Unlock Deck
Unlock for access to all 45 flashcards in this deck.
Unlock Deck
k this deck
34
Use the following to answer the questions below:
M&M's, the popular candy-coated chocolate treats, come in a variety of flavors. Two popular varieties are Milk Chocolate (sometimes referred to as "Plain") and Peanut. Does the Mars Company (the maker of M&M's) use the same color distribution (frequency of colors) for all varieties, or does it depend on variety? Data were collected on the two varieties and computer output for a chi-square test of association is provided.
?
-Is it appropriate to use a chi-square test to test for an association between variety and color?
Unlock Deck
Unlock for access to all 45 flashcards in this deck.
Unlock Deck
k this deck
35
Use the following to answer the questions below:
M&M's, the popular candy-coated chocolate treats, come in a variety of flavors. Two popular varieties are Milk Chocolate (sometimes referred to as "Plain") and Peanut. Does the Mars Company (the maker of M&M's) use the same color distribution (frequency of colors) for all varieties, or does it depend on variety? Data were collected on the two varieties and computer output for a chi-square test of association is provided.
-Test, at the 5% level, if there is a significant association between variety and color. Include all details of the test.
Unlock Deck
Unlock for access to all 45 flashcards in this deck.
Unlock Deck
k this deck
36
Use the following to answer the questions below:
We have a random sample of 150 students (60 males and 90 females) that includes two variables: Smoke = "yes" or "no" and Gender = "female (F)" or "Male (M)." The two-way table below summarizes the results.
-Is it appropriate to use a chi-square test to test for an association between gender and smoking status?
Unlock Deck
Unlock for access to all 45 flashcards in this deck.
Unlock Deck
k this deck
37
Use the following to answer the questions below:
We have a random sample of 150 students (60 males and 90 females) that includes two variables: Smoke = "yes" or "no" and Gender = "female (F)" or "Male (M)." The two-way table below summarizes the results.
-Test, at the 10% level, if there is a significant association between gender and smoking status among students at this university. Include all of the details of the test.
Unlock Deck
Unlock for access to all 45 flashcards in this deck.
Unlock Deck
k this deck
38
Use the following to answer the questions below:
A political science professor at a small university wants to know if political party affiliation is significantly associated with trust in the media. He randomly selects 66 Democrats, 63 Republicans, and 41 Independents. Computer output of his chi-square analysis is provided.
-The expected count for the (Independent, Yes) cell is missing. Compute the expected count for this cell. Report your answer with two decimal places.
Unlock Deck
Unlock for access to all 45 flashcards in this deck.
Unlock Deck
k this deck
39
Use the following to answer the questions below:
A political science professor at a small university wants to know if political party affiliation is significantly associated with trust in the media. He randomly selects 66 Democrats, 63 Republicans, and 41 Independents. Computer output of his chi-square analysis is provided.
-Is it appropriate to use a chi-square test to test for an association between political party and trust in the media?
Unlock Deck
Unlock for access to all 45 flashcards in this deck.
Unlock Deck
k this deck
40
Use the following to answer the questions below:
A political science professor at a small university wants to know if political party affiliation is significantly associated with trust in the media. He randomly selects 66 Democrats, 63 Republicans, and 41 Independents. Computer output of his chi-square analysis is provided.
-Test, at the 5% level, if there is a significant association between political party affiliation and trust in the media. Include all details of the test.
Unlock Deck
Unlock for access to all 45 flashcards in this deck.
Unlock Deck
k this deck
41
Use the following to answer the questions below:
A political science professor at a small university wants to know if political party affiliation is significantly associated with trust in the media. He randomly selects 66 Democrats, 63 Republicans, and 41 Independents. Computer output of his chi-square analysis is provided.
-Which cell has the largest contribution to the chi-square statistic? For this cell, is the observed count larger or smaller than the expected count?
Unlock Deck
Unlock for access to all 45 flashcards in this deck.
Unlock Deck
k this deck
42
Use the following to answer the questions below:
The Gallup organization recently conducted a survey of 1,015 randomly selected U.S. adults about "Black Friday" shopping. They asked the following question:
"As you know, the Friday after Thanksgiving is one of the biggest shopping days of the year.
Looking ahead, do you personally plan on shopping on the Friday after Thanksgiving, or not?"
Their results, broken down by sex, are summarized in the provided two-way table.
-Compute the expected cell counts for all cells. Report your counts to two decimal places.
Unlock Deck
Unlock for access to all 45 flashcards in this deck.
Unlock Deck
k this deck
43
Use the following to answer the questions below:
The Gallup organization recently conducted a survey of 1,015 randomly selected U.S. adults about "Black Friday" shopping. They asked the following question:
"As you know, the Friday after Thanksgiving is one of the biggest shopping days of the year.
Looking ahead, do you personally plan on shopping on the Friday after Thanksgiving, or not?"
Their results, broken down by sex, are summarized in the provided two-way table.
-Is it appropriate to use a chi-square test to test for an association between sex and plans to shop the Friday after Thanksgiving?
Unlock Deck
Unlock for access to all 45 flashcards in this deck.
Unlock Deck
k this deck
44
Use the following to answer the questions below:
The Gallup organization recently conducted a survey of 1,015 randomly selected U.S. adults about "Black Friday" shopping. They asked the following question:
"As you know, the Friday after Thanksgiving is one of the biggest shopping days of the year.
Looking ahead, do you personally plan on shopping on the Friday after Thanksgiving, or not?"
Their results, broken down by sex, are summarized in the provided two-way table.
-Test, at the 1% level, if there is a significant association between sex and plans to shop the Friday after Thanksgiving. Include all details of your test.
Unlock Deck
Unlock for access to all 45 flashcards in this deck.
Unlock Deck
k this deck
45
Use the following to answer the questions below:
The Gallup organization recently conducted a survey of 1,015 randomly selected U.S. adults about "Black Friday" shopping. They asked the following question:
"As you know, the Friday after Thanksgiving is one of the biggest shopping days of the year.
Looking ahead, do you personally plan on shopping on the Friday after Thanksgiving, or not?"
Their results, broken down by sex, are summarized in the provided two-way table.
-The Gallup organization asked a random sample of U.S. adults if they would prefer to have a job outside the home, or if they would prefer to stay home to care for the family and home. Of the 504 males they surveyed, 391 said that they would prefer to have a job outside of the home. Of the 473 females they surveyed, 254 said that they would prefer a job outside of the home.
Test, at the 5% level, if there is evidence of an association between sex and preference to have a job outside of the home. Include all details of the test.
Unlock Deck
Unlock for access to all 45 flashcards in this deck.
Unlock Deck
k this deck
Unlock Deck
Unlock for access to all 45 flashcards in this deck.


