Deck 8: Measures of Association for Variables Measured at the Nominal Level
Full screen (f)
Question
Question
Question
Question
Question
Question
Question
Question
Question
Question
Question
Question
Question
Question
Question
Question
Question
Question
Question
Question
Question
Question
Question
Question
Question
Question
Question
Question
Question
Question
Question
Question
Question
Question
Question
Question

-Refer to the table. How should we calculate the conditional distribution of job satisfaction among those in unionized workforces?
A) (75/220) × 100 = 34%
B) (75/150) × 100 = 50%
C) ((75 + 220)/440) × 100 = 67%
D) ((75 + 220)/370) × 100 = 80%
Question
-Refer to the table. Which of these statements is the best way to describe the relationship between type of workplace and job satisfaction?
A) There is a weak positive association.
B) There is a moderate negative association.
C) There is an association, but it is impossible to determine its direction.
D) There is no association.
Question
-Refer to the table. Which of these statements would best describe the results if we drew a paralleled pie chart to depict the association between workplace type (unionized or non-unionized) and job satisfaction?
A) Two pies would be drawn, one for satisfied workers and one for unsatisfied workers; the pie for unsatisfied workers would be larger.
B) Two pies would be drawn, one for satisfied workers and one for unsatisfied workers; both would have identical pie slice sizes.
C) Two pies would be drawn, one for unionized workers and one for non-unionized workers; they would have identical pie slice sizes.
D) Four pies would be drawn, the biggest slices of which would correspond to non-unionized workers.
Question
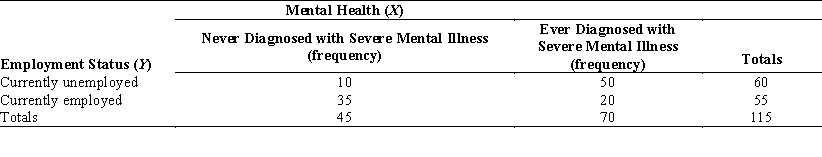
-Refer to the table. What is E1?
A) 10
B) 50
C) 55
D) 70
Question
-Refer to the table. What is E2?
A) 30
B) 45
C) 55
D) 70
Question
-Refer to the table. What is lambda?
A) 0.82
B) 0.45
C) 0.33
D) 0.25
Question
Question

Unlock Deck
Sign up to unlock the cards in this deck!
Unlock Deck
Unlock Deck
1/43
Play
Full screen (f)
Deck 8: Measures of Association for Variables Measured at the Nominal Level
1
A researcher has found a non-random relationship in a large random sample using hypothesis testing. Why would it be a good idea to also compute measures of association?
A) The researcher will want to assess the strength and direction of the relationship.
B) Hypothesis tests do not have sufficient power to detect important relationships in large samples.
C) Measures of association can sometimes contradict hypothesis test results, so both are needed for complete information.
D) Measures of association are not necessary if the null hypothesis has been rejected.
The researcher will want to assess the strength and direction of the relationship.
2
Why are measures of association helpful in testing the validity of a theory?
A) Theories do not specify what the independent or dependent variable is in a relationship, so measures of association help clarify this point.
B) Theories seldom articulate cause-and-effect relationships, so measures of association help determine causality.
C) Theories stipulate that one variable causes another, so we need to know how strongly the independent variable is related to the dependent variable.
D) Measures of association are not helpful in testing a theory; they are used for research purposes where theory is not yet developed.
Theories stipulate that one variable causes another, so we need to know how strongly the independent variable is related to the dependent variable.
3
Tests of significance reveal if results are non-random. What should a researcher use to investigate the strength and direction of relationships?
A) ANOVA
B) percentages
C) measures of association
D) chi square tests
A) ANOVA
B) percentages
C) measures of association
D) chi square tests
measures of association
4
Which element of research design influences tests of significance far more than it influences measures of association?
A) sample size
B) level of measurement
C) how the EPSEM sample was obtained
D) whether the association is positive or negative
A) sample size
B) level of measurement
C) how the EPSEM sample was obtained
D) whether the association is positive or negative
Unlock Deck
Unlock for access to all 43 flashcards in this deck.
Unlock Deck
k this deck
5
In what sense do measures of association help with prediction?
A) They show whether a relationship is causal.
B) They give us a better estimate of a case's score on the dependent variable than we would obtain by guessing.
C) They tell us whether an observed relationship is likely to have occurred by random chance.
D) They allow us to determine whether a theory is true or false.
Unlock Deck
Unlock for access to all 43 flashcards in this deck.
Unlock Deck
k this deck
6
Which of these statements describes the variables if the distribution of the scores of one variable changes across the categories of another variable?
A) They are perfectly associated.
B) They are associated to some extent.
C) They have a cause-and-effect relationship.
D) They are related in a way that is statistically significant.
A) They are perfectly associated.
B) They are associated to some extent.
C) They have a cause-and-effect relationship.
D) They are related in a way that is statistically significant.
Unlock Deck
Unlock for access to all 43 flashcards in this deck.
Unlock Deck
k this deck
7
If the independent (X) variable is located in the columns, and the dependent (Y) variable in the rows of a bivariate table, how would we inspect the table to understand a bivariate association?
A) Read down the rows to compare the conditional distributions of X.
B) Look across the columns to compare the conditional distributions of Y.
C) Look for the cell with the largest frequency value and compare it to the cell with the lowest frequency value.
D) Add the frequency values together and divide by the total frequency.
Unlock Deck
Unlock for access to all 43 flashcards in this deck.
Unlock Deck
k this deck
8
Suppose chi square computed on a bivariate table is greater than zero. Which of these statements describes the variables?
A) They are not associated, and they are independent.
B) They are associated, and they may be dependent.
C) They are associated, and they are independent.
D) They are not associated, and they are not independent.
A) They are not associated, and they are independent.
B) They are associated, and they may be dependent.
C) They are associated, and they are independent.
D) They are not associated, and they are not independent.
Unlock Deck
Unlock for access to all 43 flashcards in this deck.
Unlock Deck
k this deck
9
How would a researcher reveal if variables are associated when the variables are arranged in a bivariate table?
A) by subtracting their scores horizontally
B) by computing percentages in the direction of the dependent variable
C) by computing percentages in the direction of the independent variable
D) by adding their scores vertically
A) by subtracting their scores horizontally
B) by computing percentages in the direction of the dependent variable
C) by computing percentages in the direction of the independent variable
D) by adding their scores vertically
Unlock Deck
Unlock for access to all 43 flashcards in this deck.
Unlock Deck
k this deck
10
Which percentages should be computed in order to display the effects of the X variable on the Y variable in a bivariate table when the independent variable has been arranged in the columns?
A) those using n as the denominator
B) those within each column
C) those within each row
D) those between each column
A) those using n as the denominator
B) those within each column
C) those within each row
D) those between each column
Unlock Deck
Unlock for access to all 43 flashcards in this deck.
Unlock Deck
k this deck
11
Suppose there is a perfect relationship between being convicted of a crime (X) and being sentenced to jail (Y) in a sample of criminal defendants. Which of the following statements can we conclude?
A) Just as many defendants not convicted of a crime were sentenced to jail as were those who were convicted.
B) All cases in each column of a bivariate table would be located in a single cell.
C) There is maximum variation in jail sentencing for each category of crime conviction.
D) We are unable to predict jail sentencing on the basis of crime conviction.
Unlock Deck
Unlock for access to all 43 flashcards in this deck.
Unlock Deck
k this deck
12
Suppose the maximum difference calculated in a bivariate table is 23 percentage points. How should we describe the relationship?
A) as weak
B) as moderate
C) as strong
D) as causal
A) as weak
B) as moderate
C) as strong
D) as causal
Unlock Deck
Unlock for access to all 43 flashcards in this deck.
Unlock Deck
k this deck
13
Which one of the following patterns describes a positive association between two variables?
A) As one variable increases in value, the other also increases.
B) As one variable increases in value, the other stays the same.
C) As one variable decreases in value, the other increases.
D) Neither variable decreases.
A) As one variable increases in value, the other also increases.
B) As one variable increases in value, the other stays the same.
C) As one variable decreases in value, the other increases.
D) Neither variable decreases.
Unlock Deck
Unlock for access to all 43 flashcards in this deck.
Unlock Deck
k this deck
14
As age increases, memorization speed declines. What kind of relationship is this?
A) a negative relationship
B) a positive relationship
C) a non-linear relationship
D) a null relationship
A) a negative relationship
B) a positive relationship
C) a non-linear relationship
D) a null relationship
Unlock Deck
Unlock for access to all 43 flashcards in this deck.
Unlock Deck
k this deck
15
What is the association between variables if they vary in opposite directions?
A) neutral
B) contradictory
C) negative
D) positive
A) neutral
B) contradictory
C) negative
D) positive
Unlock Deck
Unlock for access to all 43 flashcards in this deck.
Unlock Deck
k this deck
16
A historical study of dietary patterns in the Middle Ages finds that, with increased wealth, people consumed more calories. How would this relationship be summarized statistically?
A) There was a negative association between wealth and caloric intake.
B) There was a positive association between wealth and caloric intake.
C) There was a perfect association between wealth and caloric intake.
D) There was either a moderate or a strong association between these variables, and there could not be a weak relationship.
Unlock Deck
Unlock for access to all 43 flashcards in this deck.
Unlock Deck
k this deck
17
A researcher is interested in the association between gender (measured in two categories) and income (measured in three ordered categories: low, medium, high). What variable should dictate what measure of association is used?
A) gender
B) income
C) low income
D) Measures of association cannot be computed with these variables.
A) gender
B) income
C) low income
D) Measures of association cannot be computed with these variables.
Unlock Deck
Unlock for access to all 43 flashcards in this deck.
Unlock Deck
k this deck
18
What must be calculated before phi and Cramer's V can be computed?
A) lambda
B) maximum difference
C) clustered bar charts
D) chi square test
A) lambda
B) maximum difference
C) clustered bar charts
D) chi square test
Unlock Deck
Unlock for access to all 43 flashcards in this deck.
Unlock Deck
k this deck
19
Which of the following types of bivariate tables are appropriate for calculating phi?
A) 2 × 1
B) 2 × 2
C) 4 × 0
D) Bivariate tables of any size are appropriate for calculating phi.
A) 2 × 1
B) 2 × 2
C) 4 × 0
D) Bivariate tables of any size are appropriate for calculating phi.
Unlock Deck
Unlock for access to all 43 flashcards in this deck.
Unlock Deck
k this deck
20
How is phi similar to Cramer's V?
A) Both first require calculating ÷2.
B) Both are measures of proportional reduction in error (PRE).
C) Both provide a meaningful percentage of the explained variance in Y.
D) Both are useful for 4 × 4 bivariate tables.
A) Both first require calculating ÷2.
B) Both are measures of proportional reduction in error (PRE).
C) Both provide a meaningful percentage of the explained variance in Y.
D) Both are useful for 4 × 4 bivariate tables.
Unlock Deck
Unlock for access to all 43 flashcards in this deck.
Unlock Deck
k this deck
21
What is the major difference between Cramer's V and phi?
A) Cramer's V is suitable for tables larger than 2 × 2, and phi is not.
B) Phi is suitable for tables larger than 2 × 2, and Cramer's V is not.
C) Cramer's V gives us the direction of an association, and phi does not.
D) Phi gives us the direction of an association, and Cramer's V does not.
A) Cramer's V is suitable for tables larger than 2 × 2, and phi is not.
B) Phi is suitable for tables larger than 2 × 2, and Cramer's V is not.
C) Cramer's V gives us the direction of an association, and phi does not.
D) Phi gives us the direction of an association, and Cramer's V does not.
Unlock Deck
Unlock for access to all 43 flashcards in this deck.
Unlock Deck
k this deck
22
For which of the following would phi and Cramer's V be appropriate as measures of association?
A) for variables measured at the nominal level
B) for variables measured at the interval-ratio level
C) for variables measured at the ordinal level
D) for variables measured at the continuous level
A) for variables measured at the nominal level
B) for variables measured at the interval-ratio level
C) for variables measured at the ordinal level
D) for variables measured at the continuous level
Unlock Deck
Unlock for access to all 43 flashcards in this deck.
Unlock Deck
k this deck
23
In a 2 × 2 table, what is the range of phi?
A) 1 to 100
B) 0 to 1.00
C) 0 to 1.00.
D) -1.00 to +1.00
A) 1 to 100
B) 0 to 1.00
C) 0 to 1.00.
D) -1.00 to +1.00
Unlock Deck
Unlock for access to all 43 flashcards in this deck.
Unlock Deck
k this deck
24
Researchers are comparing Canadians and Americans on support (yes versus no) for subsidized child care. A phi of 0.21 was calculated for the relationship between nationality and support for the proposed childcare policy. What can we conclude?
A) Canadians are more supportive than Americans for subsidized child care.
B) There is a positive association between nationality and support for the policy.
C) There is a moderate association between the variables.
D) There is a strong association between the variables.
A) Canadians are more supportive than Americans for subsidized child care.
B) There is a positive association between nationality and support for the policy.
C) There is a moderate association between the variables.
D) There is a strong association between the variables.
Unlock Deck
Unlock for access to all 43 flashcards in this deck.
Unlock Deck
k this deck
25
Which of the following best describes how measures of proportional reduction in error (PRE) quantify association?
A) by comparing two predictions
B) by comparing two bivariate tables
C) by comparing expected and observed values in a bivariate table
D) by comparing two critical values
A) by comparing two predictions
B) by comparing two bivariate tables
C) by comparing expected and observed values in a bivariate table
D) by comparing two critical values
Unlock Deck
Unlock for access to all 43 flashcards in this deck.
Unlock Deck
k this deck
26
What is the basis of our prediction for the first prediction in a proportional reduction in error (PRE) measure?
A) the most typical value of the dependent variable
B) the most typical value of the independent variable
C) the value of a dependent variable at a given value of the independent variable
D) the least common value from the dependent or independent variable-whichever is lower
A) the most typical value of the dependent variable
B) the most typical value of the independent variable
C) the value of a dependent variable at a given value of the independent variable
D) the least common value from the dependent or independent variable-whichever is lower
Unlock Deck
Unlock for access to all 43 flashcards in this deck.
Unlock Deck
k this deck
27
A researcher wants to predict fitness club membership, with income level as the independent variable. When ignoring income, the researcher's prediction results in 102 errors. When taking income into account, the number of errors falls to 56. What should be the conclusion?
A) Income causes differences in fitness club membership.
B) There is an association between income and fitness club membership.
C) There is no association between income and fitness club membership.
D) Phi will equal the value of lambda.
A) Income causes differences in fitness club membership.
B) There is an association between income and fitness club membership.
C) There is no association between income and fitness club membership.
D) Phi will equal the value of lambda.
Unlock Deck
Unlock for access to all 43 flashcards in this deck.
Unlock Deck
k this deck
28
How do we find E2?
A) by subtracting the respective column totals from row totals, and dividing by n
B) by multiplying E1 by n
C) by subtracting the column totals from the largest cell frequency in each column, and then adding subtotals together
D) by subtracting the largest cell frequency in each column from the column total, and then adding the subtotals
Unlock Deck
Unlock for access to all 43 flashcards in this deck.
Unlock Deck
k this deck
29
Suppose we wish to understand the relationship between two variables: social class and film genre preference. Which of the following would be a reason to prefer lambda as a measure of association?
A) Lambda allows us to understand whether our sample was drawn randomly from a well-defined population.
B) Lambda gives us clear criteria for knowing whether the association is weak, moderate, or strong.
C) Lambda is a symmetrical measure of association, so we will get the same value even if we were to reverse the X and Y variables in our calculation.
D) Lambda allows us to quantify exactly how much knowing a person's social class helps to predict their film preference.
Unlock Deck
Unlock for access to all 43 flashcards in this deck.
Unlock Deck
k this deck
30
In his thesis project, a student analyzes a 2 × 3 table with level of education (university degree versus less than university degree) predicting frequency of strenuous exercise (< weekly, weekly, > weekly). He finds that lambda = 0.48. What should his interpretation be?
A) Knowing how frequently a person exercises helps reduce our error in predicting education level by about half.
B) Knowing a person's education helps reduce our error in predicting exercise frequency by about half.
C) We can assume that there is a moderate relationship, but lambda lacks a PRE interpretation.
D) It is inappropriate to calculate lambda for a 2 × 3 table because it is not symmetrical. He should change the table to be 2 × 2 or 3 × 3 before computing lambda.
Unlock Deck
Unlock for access to all 43 flashcards in this deck.
Unlock Deck
k this deck
31
A researcher assesses the relationship between countries' development (highly developed versus less highly developed) and whether or not the country has ever elected a female head of state. The lambda for this association is 0.28. The researcher is better off knowing about country development by what percentage?
A) 72%
B) 52%
C) 28%
D) 8%
A) 72%
B) 52%
C) 28%
D) 8%
Unlock Deck
Unlock for access to all 43 flashcards in this deck.
Unlock Deck
k this deck
32
Lambda is considered an asymmetric measure of association. What does this mean?
A) Lambda can help reject a hypothesis, but it does not directly provide information about strength of association.
B) Lambda provides information about positive relationships, but not negative associations.
C) Lambda provides information about negative associations, but not positive relationships.
D) The value of lambda may vary depending on which variable is considered independent and which is considered dependent.
Unlock Deck
Unlock for access to all 43 flashcards in this deck.
Unlock Deck
k this deck
33
Which one of the following can occur to lambda when the row marginals are extremely unequal?
A) Lambda may exceed 1.00.
B) Nothing, since lambda is not affected by row marginals.
C) Lambda may be less than zero.
D) Lambda may be zero even though there is an association between the variables.
A) Lambda may exceed 1.00.
B) Nothing, since lambda is not affected by row marginals.
C) Lambda may be less than zero.
D) Lambda may be zero even though there is an association between the variables.
Unlock Deck
Unlock for access to all 43 flashcards in this deck.
Unlock Deck
k this deck
34
In a bivariate table, Cramer's V is 0.21 and lambda is 0. Which of the following should be our conclusion?
A) that the null hypothesis cannot be rejected; we have no evidence of an association
B) that the null hypothesis should be rejected, but we may have made a computation error when calculating lambda
C) that although V suggests a moderate relationship, lambda corrects our interpretation to indicate there is no relationship
D) that the variables may be associated even if lambda is zero, and disregard lambda if the row marginals are very unequal
Unlock Deck
Unlock for access to all 43 flashcards in this deck.
Unlock Deck
k this deck
35
When should analysts be very cautious about using lambda as a measure of proportional reduction in error?
A) when both variables are measured at the nominal level
B) when the sample size is very large
C) when the bivariate table is larger than 2 × 2
D) when the row marginals are very unequal
A) when both variables are measured at the nominal level
B) when the sample size is very large
C) when the bivariate table is larger than 2 × 2
D) when the row marginals are very unequal
Unlock Deck
Unlock for access to all 43 flashcards in this deck.
Unlock Deck
k this deck
36
-Refer to the table. How should we calculate the conditional distribution of job satisfaction among those in unionized workforces?
A) (75/220) × 100 = 34%
B) (75/150) × 100 = 50%
C) ((75 + 220)/440) × 100 = 67%
D) ((75 + 220)/370) × 100 = 80%
Unlock Deck
Unlock for access to all 43 flashcards in this deck.
Unlock Deck
k this deck
37
-Refer to the table. Which of these statements is the best way to describe the relationship between type of workplace and job satisfaction?
A) There is a weak positive association.
B) There is a moderate negative association.
C) There is an association, but it is impossible to determine its direction.
D) There is no association.
Unlock Deck
Unlock for access to all 43 flashcards in this deck.
Unlock Deck
k this deck
38
-Refer to the table. Which of these statements would best describe the results if we drew a paralleled pie chart to depict the association between workplace type (unionized or non-unionized) and job satisfaction?
A) Two pies would be drawn, one for satisfied workers and one for unsatisfied workers; the pie for unsatisfied workers would be larger.
B) Two pies would be drawn, one for satisfied workers and one for unsatisfied workers; both would have identical pie slice sizes.
C) Two pies would be drawn, one for unionized workers and one for non-unionized workers; they would have identical pie slice sizes.
D) Four pies would be drawn, the biggest slices of which would correspond to non-unionized workers.
Unlock Deck
Unlock for access to all 43 flashcards in this deck.
Unlock Deck
k this deck
39
-Refer to the table. What is E1?
A) 10
B) 50
C) 55
D) 70
Unlock Deck
Unlock for access to all 43 flashcards in this deck.
Unlock Deck
k this deck
40
-Refer to the table. What is E2?
A) 30
B) 45
C) 55
D) 70
Unlock Deck
Unlock for access to all 43 flashcards in this deck.
Unlock Deck
k this deck
41
-Refer to the table. What is lambda?
A) 0.82
B) 0.45
C) 0.33
D) 0.25
Unlock Deck
Unlock for access to all 43 flashcards in this deck.
Unlock Deck
k this deck
42
Measures of association enable prediction. Explain whether prediction requires a causal relationship between the variables.
Unlock Deck
Unlock for access to all 43 flashcards in this deck.
Unlock Deck
k this deck
43
Describe the difference between the "dependent-only prediction rule" and the "relational prediction rule" when applying a proportional reduction in error (PRE) approach.
Unlock Deck
Unlock for access to all 43 flashcards in this deck.
Unlock Deck
k this deck
Unlock Deck
Unlock for access to all 43 flashcards in this deck.


