Deck 4: The Normal Curve
Full screen (f)
Question
Question
Consider two normal distributions. Normal Distribution A has  = 50 and s = 4. Normal Distribution B has
  = 15 and s = 2. How does the total area under the curve differ between Distribution A and Distribution B when we move from the mean to +1 standard deviation along the curve's horizontal axis (abscissa)?
A) The area is half as large for Distribution A compared to Distribution B.
B) The area under the curve is equal for Distribution A and Distribution B.
C) The area is twice as big for Distribution A compared to Distribution B.
D) The area is four times as big for Distribution A compared to Distribution B.
= 50 and s = 4. Normal Distribution B has = 15 and s = 2. How does the total area under the curve differ between Distribution A and Distribution B when we move from the mean to +1 standard deviation along the curve's horizontal axis (abscissa)?A) The area is half as large for Distribution A compared to Distribution B.
B) The area under the curve is equal for Distribution A and Distribution B.
C) The area is twice as big for Distribution A compared to Distribution B.
D) The area is four times as big for Distribution A compared to Distribution B.
Question
Question
Question
Question
Question
Question
Question
Question
Question
Question
Question
Question
Question
Question
Question
Question
Question
Question
Question
Question
Question
Question
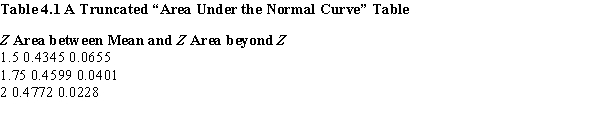
-Refer to Table 4.1. Approximately what proportion of the standard distribution's total area is found between 1.5 standard deviations above the mean and 2 standard deviations above the mean?
A) approximately 0.02 of the total area under the curve
B) approximately 0.04 of the total area under the curve
C) approximately 0.09 of the total area under the curve
D) approximately 0.91 of the total area under the curve
Question
-Refer to Table 4.1. What percentage of a sample will be more than 1.5 standard deviations above the mean?
A) 6.55%
B) 43%
C) 46%
D) 57%
Question
-Refer to Table 4.1. If a case is selected randomly from the distribution, what is the approximate probability that its value will be between 1.75 standard deviations above the mean and 2 standard deviations above the mean?
A) 0.01
B) 0.02
C) 0.05
D) 0.07
Question
-Refer to Table 4.1. If a case is chosen randomly from this distribution, what is the approximate probability that its value will be higher in value than -2 standard deviations below the mean?
A) 0.43
B) 0.48
C) 0.93
D) 0.98
Question

Unlock Deck
Sign up to unlock the cards in this deck!
Unlock Deck
Unlock Deck
1/28
Play
Full screen (f)
Deck 4: The Normal Curve
1
Which two characteristics describe normal curve distribution?
A) theoretical and unimodal (single peak)
B) symmetrical and bimodal (two peaks)
C) symmetrical and short-tailed
D) symmetrical and commonly occurring for most observable variables in the real world
A) theoretical and unimodal (single peak)
B) symmetrical and bimodal (two peaks)
C) symmetrical and short-tailed
D) symmetrical and commonly occurring for most observable variables in the real world
theoretical and unimodal (single peak)
2
Consider two normal distributions. Normal Distribution A has = 50 and s = 4. Normal Distribution B has = 15 and s = 2. How does the total area under the curve differ between Distribution A and Distribution B when we move from the mean to +1 standard deviation along the curve's horizontal axis (abscissa)?
A) The area is half as large for Distribution A compared to Distribution B.
B) The area under the curve is equal for Distribution A and Distribution B.
C) The area is twice as big for Distribution A compared to Distribution B.
D) The area is four times as big for Distribution A compared to Distribution B.
= 50 and s = 4. Normal Distribution B has = 15 and s = 2. How does the total area under the curve differ between Distribution A and Distribution B when we move from the mean to +1 standard deviation along the curve's horizontal axis (abscissa)?A) The area is half as large for Distribution A compared to Distribution B.
B) The area under the curve is equal for Distribution A and Distribution B.
C) The area is twice as big for Distribution A compared to Distribution B.
D) The area is four times as big for Distribution A compared to Distribution B.
The area under the curve is equal for Distribution A and Distribution B.
3
Where do the tails of the theoretical normal curve touch the horizontal axis?
A) just past the 3rd standard deviation
B) between the 3rd and 4th standard deviations
C) at approximately the 5th standard deviation
D) They never touch the horizontal axis.
A) just past the 3rd standard deviation
B) between the 3rd and 4th standard deviations
C) at approximately the 5th standard deviation
D) They never touch the horizontal axis.
They never touch the horizontal axis.
4
What percentage of the total area is between the mean and +1 standard deviation for a normal curve?
A) about 34%
B) about 68%
C) about 80%
D) about 99.7%
A) about 34%
B) about 68%
C) about 80%
D) about 99.7%
Unlock Deck
Unlock for access to all 28 flashcards in this deck.
Unlock Deck
k this deck
5
For a sample of 100 nursing home residents where we assume blood pressure to be normally distributed, approximately how many people would be two standard deviations below the mean blood pressure?
A) approximately 1 resident
B) approximately 2 residents
C) approximately 10 residents
D) approximately 32 residents
A) approximately 1 resident
B) approximately 2 residents
C) approximately 10 residents
D) approximately 32 residents
Unlock Deck
Unlock for access to all 28 flashcards in this deck.
Unlock Deck
k this deck
6
A Z score of -0.5 means that the case's raw score is how much less than the sample mean?
A) five standard deviations less than the mean
B) half a raw unit deviation less than the mean
C) half a standard deviation less than the mean
D) It is impossible to answer without knowing the size of the sample's standard deviation.
A) five standard deviations less than the mean
B) half a raw unit deviation less than the mean
C) half a standard deviation less than the mean
D) It is impossible to answer without knowing the size of the sample's standard deviation.
Unlock Deck
Unlock for access to all 28 flashcards in this deck.
Unlock Deck
k this deck
7
For a curve that is NOT normally distributed, what percentage of the area will be beyond ±1.5 standard deviations?
A) about 97%
B) about 68%
C) about 13.4%
D) It's impossible to say.
A) about 97%
B) about 68%
C) about 13.4%
D) It's impossible to say.
Unlock Deck
Unlock for access to all 28 flashcards in this deck.
Unlock Deck
k this deck
8
Suppose 50 hockey players tried out for a team, and their skating speed for a 100-metre dash was normally distributed. What would be the mean and standard deviation for the normal distribution characterizing their skate times?
A) a mean of 0 and a standard deviation of 0
B) a mean of 0 and a standard deviation of 1
C) a mean of 10 and a standard deviation of 20
D) a mean of 50 and a standard deviation of 1
A) a mean of 0 and a standard deviation of 0
B) a mean of 0 and a standard deviation of 1
C) a mean of 10 and a standard deviation of 20
D) a mean of 50 and a standard deviation of 1
Unlock Deck
Unlock for access to all 28 flashcards in this deck.
Unlock Deck
k this deck
9
A researcher obtains robbery rates for 23 cities for 2016. She standardizes the robbery rate variable. What happens to the variable's scores?
A) Each will be identical to the median city's score.
B) Each will be identical to the standard deviation.
C) Each will be turned into a Z score.
D) The mean will be equal to 1.
A) Each will be identical to the median city's score.
B) Each will be identical to the standard deviation.
C) Each will be turned into a Z score.
D) The mean will be equal to 1.
Unlock Deck
Unlock for access to all 28 flashcards in this deck.
Unlock Deck
k this deck
10
What is the value of the corresponding raw score if a Z score is 0?
A) zero
B) a negative number
C) the same as the standard deviation of the empirical distribution
D) the same as the mean of the empirical distribution
A) zero
B) a negative number
C) the same as the standard deviation of the empirical distribution
D) the same as the mean of the empirical distribution
Unlock Deck
Unlock for access to all 28 flashcards in this deck.
Unlock Deck
k this deck
11
What is the process for finding the area above a positive Z score or below a negative Z score?
A) Use the "Area Beyond Z" column C of the Z-score table.
B) Add the area between the Z score and the mean to 100%.
C) Subtract the value of the Z score from the mean.
D) Add the value of the Z score to the area beyond the mean.
A) Use the "Area Beyond Z" column C of the Z-score table.
B) Add the area between the Z score and the mean to 100%.
C) Subtract the value of the Z score from the mean.
D) Add the value of the Z score to the area beyond the mean.
Unlock Deck
Unlock for access to all 28 flashcards in this deck.
Unlock Deck
k this deck
12
What property of the normal curve ensures that the area from the mean to -2 standard deviations is the same as the area from the mean to +2 standard deviations?
A) the least squares principle of the normal distribution
B) the skewness of the normal distribution
C) the symmetry of the normal distribution
D) the interval-ratio measurement of the normal distribution
A) the least squares principle of the normal distribution
B) the skewness of the normal distribution
C) the symmetry of the normal distribution
D) the interval-ratio measurement of the normal distribution
Unlock Deck
Unlock for access to all 28 flashcards in this deck.
Unlock Deck
k this deck
13
The mean score on a physiology test was 71, and the standard deviation of scores was 9. Assuming a normal distribution, what percentage of scores fell below a 60?
A) 11.12%
B) 19.44%
C) 25%
D) 45.71%
A) 11.12%
B) 19.44%
C) 25%
D) 45.71%
Unlock Deck
Unlock for access to all 28 flashcards in this deck.
Unlock Deck
k this deck
14
What is the process for obtaining the area between the scores when the Z scores of two tests' scores are +1.2 and +1.5?
A) Find the area between each score and the mean in the Z-score table, and then subtract the smaller area from the larger area.
B) Find the area beyond each score in the Z-score table, and subtract the difference between the areas from the mean.
C) Subtract the Z scores and find the area of the difference in the Z-score table.
D) Find the area between each score and the mean in the Z-score table, and then subtract the difference between them from 100%.
Unlock Deck
Unlock for access to all 28 flashcards in this deck.
Unlock Deck
k this deck
15
A set of 80 sociology tests with a normal distribution has a mean score of 65 and a standard deviation of 8. Shellie scored in the 90th percentile of the class. What score did she receive?
A) 0.52 = (Xi + 65)/8 = 60.84
B) 1.28 = (65 - Xi)/80 = 63.44
C) 1.28 = (Xi - 65)/8 = 75.24
D) 100 = (Xi + 10)/1 = 90
A) 0.52 = (Xi + 65)/8 = 60.84
B) 1.28 = (65 - Xi)/80 = 63.44
C) 1.28 = (Xi - 65)/8 = 75.24
D) 100 = (Xi + 10)/1 = 90
Unlock Deck
Unlock for access to all 28 flashcards in this deck.
Unlock Deck
k this deck
16
What is the process for determining the area between two negative Z scores?
A) Find the area between each Z score and the mean, and subtract the smaller area from the larger.
B) Add the Z scores and find the area below the total Z score.
C) Subtract the two negative Z scores and find the total area above the total Z score.
D) Find the area between each Z score and the mean, and add the areas.
Unlock Deck
Unlock for access to all 28 flashcards in this deck.
Unlock Deck
k this deck
17
In what sense is the normal distribution a distribution of probabilities?
A) The normal distribution tells us that cases are equally likely to have any value within ±3 standard deviations from the mean.
B) The normal distribution allows us to estimate the precise likelihood of selecting a case that has a score within a certain range.
C) The normal distribution indicates that scores above the mean are more probable than scores with negative Z values.
D) The normal distribution tells us that half of all cases will probably fall within ±1 standard deviation from the mean.
Unlock Deck
Unlock for access to all 28 flashcards in this deck.
Unlock Deck
k this deck
18
A social work researcher constructed a measure of quality of life and obtained a distribution of scores on this measure from a randomly selected sample of elderly persons. The scores were normally distributed, with a mean of 45 and a standard deviation of 7. What is the probability that a randomly selected case from the sample will have a score less than 38?
A) 0.5200
B) 0.5018
C) 0.4526
D) 0.1587
A) 0.5200
B) 0.5018
C) 0.4526
D) 0.1587
Unlock Deck
Unlock for access to all 28 flashcards in this deck.
Unlock Deck
k this deck
19
What is the probability of rolling a 1 in a single toss of a six-sided die?
A) 1 in 60
B) 1 in 6
C) 1 in 5
D) 5 in 6
A) 1 in 60
B) 1 in 6
C) 1 in 5
D) 5 in 6
Unlock Deck
Unlock for access to all 28 flashcards in this deck.
Unlock Deck
k this deck
20
If it rains 21 of 30 days in a month, what value represents the probability of rain occurring on a single day chosen at random from the month?
A) 21/30 = 0.70
B) (30 - 21)/9 = 1
C) 30/21 = 1.43
D) (21 + 30)/21 = 2.43
A) 21/30 = 0.70
B) (30 - 21)/9 = 1
C) 30/21 = 1.43
D) (21 + 30)/21 = 2.43
Unlock Deck
Unlock for access to all 28 flashcards in this deck.
Unlock Deck
k this deck
21
What is the lower limit of a probability?
A) negative infinity
B) about -3 standard deviations below the mean
C) 0
D) 1
A) negative infinity
B) about -3 standard deviations below the mean
C) 0
D) 1
Unlock Deck
Unlock for access to all 28 flashcards in this deck.
Unlock Deck
k this deck
22
A researcher obtains a sample of 15 university students to conduct a study on physical strength and memorization ability. If the researcher selects one student at random from the sample, what is the probability that she will select a human being?
A) 0
B) 1
C) 100
D) Infinity
A) 0
B) 1
C) 100
D) Infinity
Unlock Deck
Unlock for access to all 28 flashcards in this deck.
Unlock Deck
k this deck
23
What is the most likely score of a case if it is randomly selected from a normal distribution?
A) at least 1 standard deviation below the mean
B) at least 1 standard deviation above the mean
C) close to the mean in value
D) equal to the mean in value
A) at least 1 standard deviation below the mean
B) at least 1 standard deviation above the mean
C) close to the mean in value
D) equal to the mean in value
Unlock Deck
Unlock for access to all 28 flashcards in this deck.
Unlock Deck
k this deck
24
-Refer to Table 4.1. Approximately what proportion of the standard distribution's total area is found between 1.5 standard deviations above the mean and 2 standard deviations above the mean?
A) approximately 0.02 of the total area under the curve
B) approximately 0.04 of the total area under the curve
C) approximately 0.09 of the total area under the curve
D) approximately 0.91 of the total area under the curve
Unlock Deck
Unlock for access to all 28 flashcards in this deck.
Unlock Deck
k this deck
25
-Refer to Table 4.1. What percentage of a sample will be more than 1.5 standard deviations above the mean?
A) 6.55%
B) 43%
C) 46%
D) 57%
Unlock Deck
Unlock for access to all 28 flashcards in this deck.
Unlock Deck
k this deck
26
-Refer to Table 4.1. If a case is selected randomly from the distribution, what is the approximate probability that its value will be between 1.75 standard deviations above the mean and 2 standard deviations above the mean?
A) 0.01
B) 0.02
C) 0.05
D) 0.07
Unlock Deck
Unlock for access to all 28 flashcards in this deck.
Unlock Deck
k this deck
27
-Refer to Table 4.1. If a case is chosen randomly from this distribution, what is the approximate probability that its value will be higher in value than -2 standard deviations below the mean?
A) 0.43
B) 0.48
C) 0.93
D) 0.98
Unlock Deck
Unlock for access to all 28 flashcards in this deck.
Unlock Deck
k this deck
28
Briefly explain the statistical meaning of the term "probability."
Unlock Deck
Unlock for access to all 28 flashcards in this deck.
Unlock Deck
k this deck
Unlock Deck
Unlock for access to all 28 flashcards in this deck.


