Deck 4: Measures of Dispersion
Full screen (f)
Question
Question
Question
Question
Question
Question
Question
Question
Question
Question
Question
Question
Question
Question
Question
Answer questions 15-16 using the following frequency distribution:
NUMBER OF BROTHERS AND SISTERS
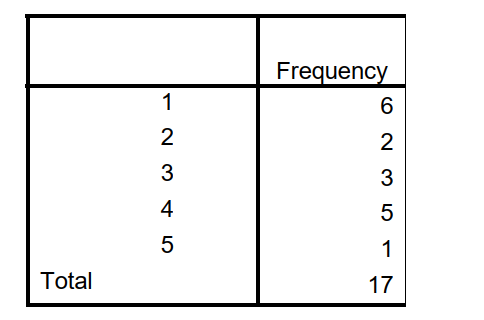
-What is the variance?
A) 3
B) 7.5
C) 19
D) 38
NUMBER OF BROTHERS AND SISTERS
-What is the variance?
A) 3
B) 7.5
C) 19
D) 38
Question
Answer questions 15-16 using the following frequency distribution:
NUMBER OF BROTHERS AND SISTERS
-What is the standard deviation?
A) 2.7
B) 4.4
C) 7.5
D) 19
NUMBER OF BROTHERS AND SISTERS
-What is the standard deviation?
A) 2.7
B) 4.4
C) 7.5
D) 19
Question
Question
Question
Question
Question
Question
Question
Question
Question
Question
Question
Question
Question

Unlock Deck
Sign up to unlock the cards in this deck!
Unlock Deck
Unlock Deck
1/29
Play
Full screen (f)
Deck 4: Measures of Dispersion
1
What is the range of the following numbers? 9, 12, 14, 18, 22
A) 5.5
B) 13
C) 14
D) 22
A) 5.5
B) 13
C) 14
D) 22
13
2
What is the interquartile range of the following numbers? 9, 12, 14, 18, 22
A) 9.5
B) 10
C) 13
D) 14
A) 9.5
B) 10
C) 13
D) 14
9.5
3
What is the mean deviation of the following numbers? 9, 12, 14, 18, 22
A) 0
B) 4
C) 5
D) 20
A) 0
B) 4
C) 5
D) 20
4
4
What is the mean deviation of the following numbers? 68, 70, 76, 84, 87, 89
A) 0
B) 7.67
C) 46
D) 76
A) 0
B) 7.67
C) 46
D) 76
Unlock Deck
Unlock for access to all 29 flashcards in this deck.
Unlock Deck
k this deck
5
What is the sum of squares of the following numbers? 9, 12, 14, 18, 22
A) 4
B) 81
C) 104
D) 484
A) 4
B) 81
C) 104
D) 484
Unlock Deck
Unlock for access to all 29 flashcards in this deck.
Unlock Deck
k this deck
6
What is the sum of squares of the following numbers? 68, 70, 76, 84, 87, 89
A) 7.67
B) 21
C) 328
D) 400
A) 7.67
B) 21
C) 328
D) 400
Unlock Deck
Unlock for access to all 29 flashcards in this deck.
Unlock Deck
k this deck
7
Use the following data to answer questions :
2, 7, 4, 4, 1, 2, 2, 3, 1, 2, 4, 5.
-What is the range?
A) 2
B) 5
C) 6
D) 7
2, 7, 4, 4, 1, 2, 2, 3, 1, 2, 4, 5.
-What is the range?
A) 2
B) 5
C) 6
D) 7
Unlock Deck
Unlock for access to all 29 flashcards in this deck.
Unlock Deck
k this deck
8
Use the following data to answer questions :
2, 7, 4, 4, 1, 2, 2, 3, 1, 2, 4, 5.
-What is the interquartile range?
A) 2
B) 5
C) 6
D) 7
2, 7, 4, 4, 1, 2, 2, 3, 1, 2, 4, 5.
-What is the interquartile range?
A) 2
B) 5
C) 6
D) 7
Unlock Deck
Unlock for access to all 29 flashcards in this deck.
Unlock Deck
k this deck
9
Use the following data to answer questions :
2, 7, 4, 4, 1, 2, 2, 3, 1, 2, 4, 5.
-What is the variance?
A) 2
B) 3.2
C) 4.3
D) 7
2, 7, 4, 4, 1, 2, 2, 3, 1, 2, 4, 5.
-What is the variance?
A) 2
B) 3.2
C) 4.3
D) 7
Unlock Deck
Unlock for access to all 29 flashcards in this deck.
Unlock Deck
k this deck
10
Use the following data to answer questions :
2, 7, 4, 4, 1, 2, 2, 3, 1, 2, 4, 5.
-What is the standard deviation?
A) 1.8
B) 3.2
C) 7
D) 10.2
2, 7, 4, 4, 1, 2, 2, 3, 1, 2, 4, 5.
-What is the standard deviation?
A) 1.8
B) 3.2
C) 7
D) 10.2
Unlock Deck
Unlock for access to all 29 flashcards in this deck.
Unlock Deck
k this deck
11
The 2006 GSS reports the number of weeks respondents worked in the year prior. Answer questions using the following selection from this sample:
25, 29, 32, 38, 42, 46, 50, 52
-What is the range?
A) 25
B) 27
C) 40
D) 52
25, 29, 32, 38, 42, 46, 50, 52
-What is the range?
A) 25
B) 27
C) 40
D) 52
Unlock Deck
Unlock for access to all 29 flashcards in this deck.
Unlock Deck
k this deck
12
The 2006 GSS reports the number of weeks respondents worked in the year prior. Answer questions using the following selection from this sample:
25, 29, 32, 38, 42, 46, 50, 52
-What is the interquartile range?
A) 17
B) 25
C) 27
D) 40
25, 29, 32, 38, 42, 46, 50, 52
-What is the interquartile range?
A) 17
B) 25
C) 27
D) 40
Unlock Deck
Unlock for access to all 29 flashcards in this deck.
Unlock Deck
k this deck
13
The 2006 GSS reports the number of weeks respondents worked in the year prior. Answer questions using the following selection from this sample:
25, 29, 32, 38, 42, 46, 50, 52
-What is the variance?
A) 7.03
B) 42.3
C) 49.4
D) 99.1
25, 29, 32, 38, 42, 46, 50, 52
-What is the variance?
A) 7.03
B) 42.3
C) 49.4
D) 99.1
Unlock Deck
Unlock for access to all 29 flashcards in this deck.
Unlock Deck
k this deck
14
The 2006 GSS reports the number of weeks respondents worked in the year prior. Answer questions using the following selection from this sample:
25, 29, 32, 38, 42, 46, 50, 52
-What is the standard deviation?
A) 7.03
B) 9.95
C) 49.4
D) 52
25, 29, 32, 38, 42, 46, 50, 52
-What is the standard deviation?
A) 7.03
B) 9.95
C) 49.4
D) 52
Unlock Deck
Unlock for access to all 29 flashcards in this deck.
Unlock Deck
k this deck
15
Answer questions 15-16 using the following frequency distribution:
NUMBER OF BROTHERS AND SISTERS
-What is the variance?
A) 3
B) 7.5
C) 19
D) 38
NUMBER OF BROTHERS AND SISTERS
-What is the variance?
A) 3
B) 7.5
C) 19
D) 38
Unlock Deck
Unlock for access to all 29 flashcards in this deck.
Unlock Deck
k this deck
16
Answer questions 15-16 using the following frequency distribution:
NUMBER OF BROTHERS AND SISTERS
-What is the standard deviation?
A) 2.7
B) 4.4
C) 7.5
D) 19
NUMBER OF BROTHERS AND SISTERS
-What is the standard deviation?
A) 2.7
B) 4.4
C) 7.5
D) 19
Unlock Deck
Unlock for access to all 29 flashcards in this deck.
Unlock Deck
k this deck
17
For all normal curves, one standard deviation above and below the mean constitutes roughly ----------- of all cases.
A) 34%
B) 68%
C) 95%
D) 100%
A) 34%
B) 68%
C) 95%
D) 100%
Unlock Deck
Unlock for access to all 29 flashcards in this deck.
Unlock Deck
k this deck
18
For all normal curves, two standard deviations above and below the mean constitute roughly ---------------- of all cases.
A) 34%
B) 68%
C) 95%
D) 100%
A) 34%
B) 68%
C) 95%
D) 100%
Unlock Deck
Unlock for access to all 29 flashcards in this deck.
Unlock Deck
k this deck
19
For all normal curves, one standard deviation below the mean constitutes roughly ------------- of all cases.
A) 34%
B) 68%
C) 95%
D) 100%
A) 34%
B) 68%
C) 95%
D) 100%
Unlock Deck
Unlock for access to all 29 flashcards in this deck.
Unlock Deck
k this deck
20
For all normal curves, two standard deviations above the mean constitute roughly ------------ of all cases.
A) 47.5%
B) 68%
C) 95%
D) 100%
A) 47.5%
B) 68%
C) 95%
D) 100%
Unlock Deck
Unlock for access to all 29 flashcards in this deck.
Unlock Deck
k this deck
21
The interquartile range is calculated by subtracting the first quartile from the highest value.
Unlock Deck
Unlock for access to all 29 flashcards in this deck.
Unlock Deck
k this deck
22
Variance is calculated by averaging the deviations from the mean.
Unlock Deck
Unlock for access to all 29 flashcards in this deck.
Unlock Deck
k this deck
23
Normal curves exist only in theory, not in reality.
Unlock Deck
Unlock for access to all 29 flashcards in this deck.
Unlock Deck
k this deck
24
It is impossible to have two distributions with identical measures of central tendency, but different values for their standard deviation.
Unlock Deck
Unlock for access to all 29 flashcards in this deck.
Unlock Deck
k this deck
25
For all normal curves, one standard deviation above and below the mean constitutes roughly 95% of cases.
Unlock Deck
Unlock for access to all 29 flashcards in this deck.
Unlock Deck
k this deck
26
What do measures of dispersion tell us?
Unlock Deck
Unlock for access to all 29 flashcards in this deck.
Unlock Deck
k this deck
27
When should we use measures of dispersion as opposed to measures of central tendency?
Unlock Deck
Unlock for access to all 29 flashcards in this deck.
Unlock Deck
k this deck
28
Determine the range and interquartile range for the following data: 15, 22, 25, 16, 10, 19, 24, 68, 17, 24.
a. Range:
a. Range:
Unlock Deck
Unlock for access to all 29 flashcards in this deck.
Unlock Deck
k this deck
29
Which is the better measure for question 31, and why?
Unlock Deck
Unlock for access to all 29 flashcards in this deck.
Unlock Deck
k this deck
Unlock Deck
Unlock for access to all 29 flashcards in this deck.


