Deck 7: Cross-Tabulation Tables and Chi-Square
Full screen (f)
Question
Use the following table to answer questions :
Abortion Attitudes by Race of Respondent Cross-tabulation
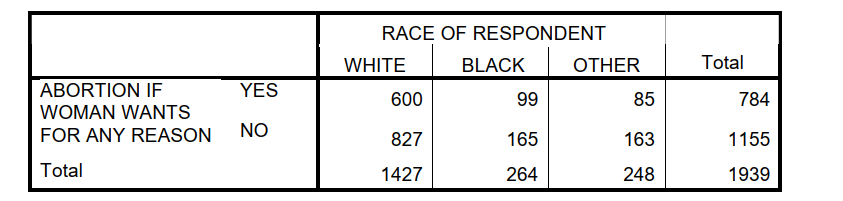
-How many respondents provided data for the table?
A) 784
B) 1155
C) 1427
D) 1939
Abortion Attitudes by Race of Respondent Cross-tabulation
-How many respondents provided data for the table?
A) 784
B) 1155
C) 1427
D) 1939
Question
Use the following table to answer questions :
Abortion Attitudes by Race of Respondent Cross-tabulation
-How many respondents are black?
A) 99
B) 264
C) 784
D) 784.
Abortion Attitudes by Race of Respondent Cross-tabulation
-How many respondents are black?
A) 99
B) 264
C) 784
D) 784.
Question
Use the following table to answer questions :
Abortion Attitudes by Race of Respondent Cross-tabulation
-How many white respondents responded with "No"?
A) 600
B) 165
C) 827
D) 1427
Abortion Attitudes by Race of Respondent Cross-tabulation
-How many white respondents responded with "No"?
A) 600
B) 165
C) 827
D) 1427
Question
Use the following table to answer questions :
Abortion Attitudes by Race of Respondent Cross-tabulation
-Which of these ethnic groups is most likely to respond "yes"?
A) white
B) black
C) other
Abortion Attitudes by Race of Respondent Cross-tabulation
-Which of these ethnic groups is most likely to respond "yes"?
A) white
B) black
C) other
Question
Use the following table to answer questions :
Abortion Attitudes by Race of Respondent Cross-tabulation
-What percent of white respondents agree with abortion for any reason?
A) 37.5
B) 42
C) 58
D) 65.7
Abortion Attitudes by Race of Respondent Cross-tabulation
-What percent of white respondents agree with abortion for any reason?
A) 37.5
B) 42
C) 58
D) 65.7
Question
Use the following table to answer questions :
Abortion Attitudes by Race of Respondent Cross-tabulation
-What percent of the "other" category disagree with abortion for any reason?
A) 37.5
B) 42
C) 58
D) 65.7
Abortion Attitudes by Race of Respondent Cross-tabulation
-What percent of the "other" category disagree with abortion for any reason?
A) 37.5
B) 42
C) 58
D) 65.7
Question
Use the following table to answer questions :
Abortion Attitudes by Race of Respondent Cross-tabulation
-What percent of respondents who disagree are black?
A) 14.3
B) 37.5
C) 42
D) 62.5
Abortion Attitudes by Race of Respondent Cross-tabulation
-What percent of respondents who disagree are black?
A) 14.3
B) 37.5
C) 42
D) 62.5
Question
Use the following table to answer questions :
Abortion Attitudes by Race of Respondent Cross-tabulation
-What percent of respondents who agree are white?
A) 40.4
B) 42
C) 65.7
D) 76.5
Abortion Attitudes by Race of Respondent Cross-tabulation
-What percent of respondents who agree are white?
A) 40.4
B) 42
C) 65.7
D) 76.5
Question
Use the following table to answer questions :
Abortion Attitudes by Race of Respondent Cross-tabulation
-What is the value of chi-square?
A) 1.6
B) 2
C) 6.4
D) 10.2
Abortion Attitudes by Race of Respondent Cross-tabulation
-What is the value of chi-square?
A) 1.6
B) 2
C) 6.4
D) 10.2
Question
Use the following table to answer questions :
Abortion Attitudes by Race of Respondent Cross-tabulation
-The relationship between the variables is significant at what level?
A) .001
B) .01
C) .05
D) all of the above
Abortion Attitudes by Race of Respondent Cross-tabulation
-The relationship between the variables is significant at what level?
A) .001
B) .01
C) .05
D) all of the above
Question
Question
Question
Question
Question
Question
Question
Question
Question
Question
Question
Question
Question
Question
The following is a hypothetical bivariate table of gender and religion:
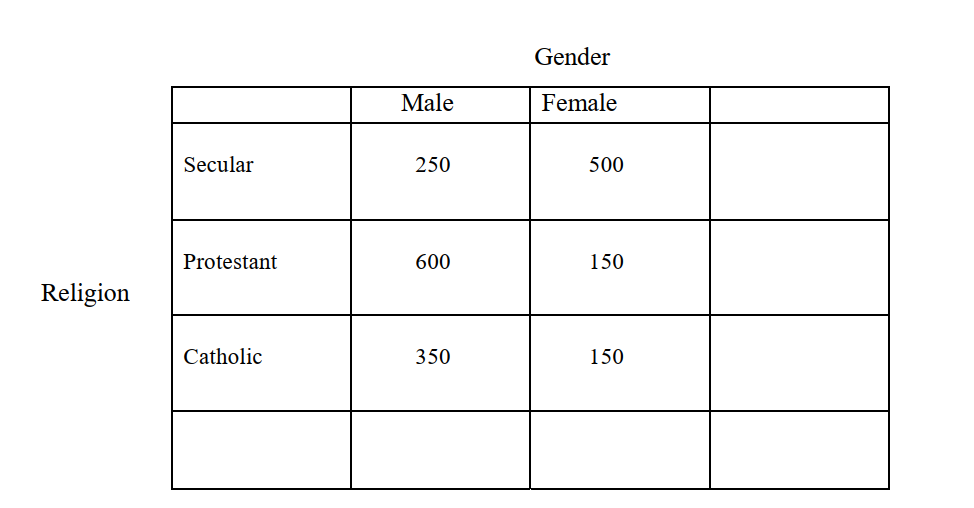 a.Complete the bivariate table. (Add marginals, percentages, and total N).
b.Answer the following questions about the table:
What is the independent variable for this table?
What is the dependent variable?
a.Complete the bivariate table. (Add marginals, percentages, and total N).b.Answer the following questions about the table:
What is the independent variable for this table?
What is the dependent variable?
Question
Use the following table to answer questions
SHOULD MARIJUANA BE MADE LEGAL by RESPONDENTS SEX
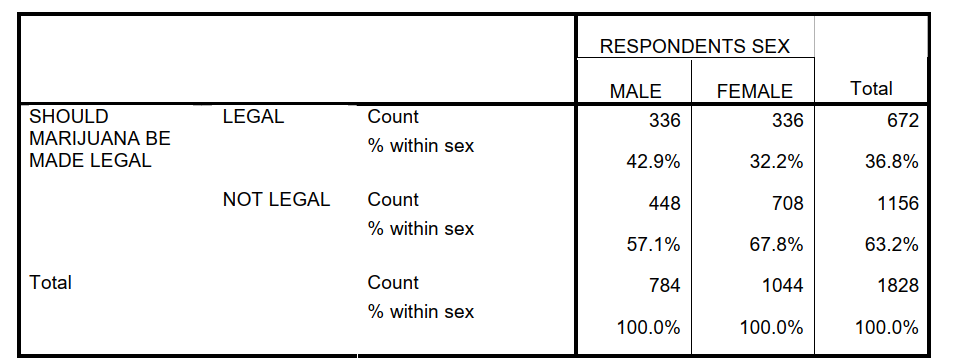
-Calculate chi-square for the above table.
SHOULD MARIJUANA BE MADE LEGAL by RESPONDENTS SEX
-Calculate chi-square for the above table.
Question
Use the following table to answer questions
SHOULD MARIJUANA BE MADE LEGAL by RESPONDENTS SEX
-Interpret chi-square. Be sure to include a discussion of statistical significance.
SHOULD MARIJUANA BE MADE LEGAL by RESPONDENTS SEX
-Interpret chi-square. Be sure to include a discussion of statistical significance.
Question
Use the table below to answer the following questions:
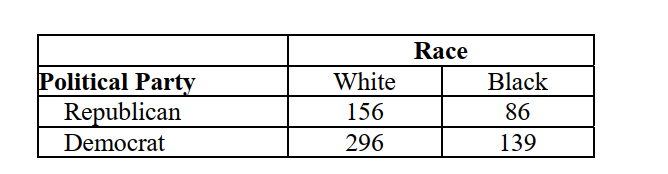
-Test the null hypothesis that gender and support for welfare are independent (alpha =.05). Begin by stating the research hypothesis.
Research Hypothesis:
Obtained statistic score:
Decision:
Interpretation:
-Test the null hypothesis that gender and support for welfare are independent (alpha =.05). Begin by stating the research hypothesis.
Research Hypothesis:
Obtained statistic score:
Decision:
Interpretation:

Unlock Deck
Sign up to unlock the cards in this deck!
Unlock Deck
Unlock Deck
1/27
Play
Full screen (f)
Deck 7: Cross-Tabulation Tables and Chi-Square
1
Use the following table to answer questions :
Abortion Attitudes by Race of Respondent Cross-tabulation
-How many respondents provided data for the table?
A) 784
B) 1155
C) 1427
D) 1939
Abortion Attitudes by Race of Respondent Cross-tabulation
-How many respondents provided data for the table?
A) 784
B) 1155
C) 1427
D) 1939
1939
2
Use the following table to answer questions :
Abortion Attitudes by Race of Respondent Cross-tabulation
-How many respondents are black?
A) 99
B) 264
C) 784
D) 784.
Abortion Attitudes by Race of Respondent Cross-tabulation
-How many respondents are black?
A) 99
B) 264
C) 784
D) 784.
264
3
Use the following table to answer questions :
Abortion Attitudes by Race of Respondent Cross-tabulation
-How many white respondents responded with "No"?
A) 600
B) 165
C) 827
D) 1427
Abortion Attitudes by Race of Respondent Cross-tabulation
-How many white respondents responded with "No"?
A) 600
B) 165
C) 827
D) 1427
827
4
Use the following table to answer questions :
Abortion Attitudes by Race of Respondent Cross-tabulation
-Which of these ethnic groups is most likely to respond "yes"?
A) white
B) black
C) other
Abortion Attitudes by Race of Respondent Cross-tabulation
-Which of these ethnic groups is most likely to respond "yes"?
A) white
B) black
C) other
Unlock Deck
Unlock for access to all 27 flashcards in this deck.
Unlock Deck
k this deck
5
Use the following table to answer questions :
Abortion Attitudes by Race of Respondent Cross-tabulation
-What percent of white respondents agree with abortion for any reason?
A) 37.5
B) 42
C) 58
D) 65.7
Abortion Attitudes by Race of Respondent Cross-tabulation
-What percent of white respondents agree with abortion for any reason?
A) 37.5
B) 42
C) 58
D) 65.7
Unlock Deck
Unlock for access to all 27 flashcards in this deck.
Unlock Deck
k this deck
6
Use the following table to answer questions :
Abortion Attitudes by Race of Respondent Cross-tabulation
-What percent of the "other" category disagree with abortion for any reason?
A) 37.5
B) 42
C) 58
D) 65.7
Abortion Attitudes by Race of Respondent Cross-tabulation
-What percent of the "other" category disagree with abortion for any reason?
A) 37.5
B) 42
C) 58
D) 65.7
Unlock Deck
Unlock for access to all 27 flashcards in this deck.
Unlock Deck
k this deck
7
Use the following table to answer questions :
Abortion Attitudes by Race of Respondent Cross-tabulation
-What percent of respondents who disagree are black?
A) 14.3
B) 37.5
C) 42
D) 62.5
Abortion Attitudes by Race of Respondent Cross-tabulation
-What percent of respondents who disagree are black?
A) 14.3
B) 37.5
C) 42
D) 62.5
Unlock Deck
Unlock for access to all 27 flashcards in this deck.
Unlock Deck
k this deck
8
Use the following table to answer questions :
Abortion Attitudes by Race of Respondent Cross-tabulation
-What percent of respondents who agree are white?
A) 40.4
B) 42
C) 65.7
D) 76.5
Abortion Attitudes by Race of Respondent Cross-tabulation
-What percent of respondents who agree are white?
A) 40.4
B) 42
C) 65.7
D) 76.5
Unlock Deck
Unlock for access to all 27 flashcards in this deck.
Unlock Deck
k this deck
9
Use the following table to answer questions :
Abortion Attitudes by Race of Respondent Cross-tabulation
-What is the value of chi-square?
A) 1.6
B) 2
C) 6.4
D) 10.2
Abortion Attitudes by Race of Respondent Cross-tabulation
-What is the value of chi-square?
A) 1.6
B) 2
C) 6.4
D) 10.2
Unlock Deck
Unlock for access to all 27 flashcards in this deck.
Unlock Deck
k this deck
10
Use the following table to answer questions :
Abortion Attitudes by Race of Respondent Cross-tabulation
-The relationship between the variables is significant at what level?
A) .001
B) .01
C) .05
D) all of the above
Abortion Attitudes by Race of Respondent Cross-tabulation
-The relationship between the variables is significant at what level?
A) .001
B) .01
C) .05
D) all of the above
Unlock Deck
Unlock for access to all 27 flashcards in this deck.
Unlock Deck
k this deck
11
Suppose a sample of students in your class counts 13 females and 7 males. What is the expected frequency of males?
A) 7
B) 10
C) 13
D) 20
A) 7
B) 10
C) 13
D) 20
Unlock Deck
Unlock for access to all 27 flashcards in this deck.
Unlock Deck
k this deck
12
Calculate chi-square for the distribution from question 12.
A) 1
B) 1.8
C) 3.2
D) 4
A) 1
B) 1.8
C) 3.2
D) 4
Unlock Deck
Unlock for access to all 27 flashcards in this deck.
Unlock Deck
k this deck
13
The relationship between the variables in questions 12-13 is significant at what level?
A) .001
B) .01
C) .05
D) There is no statistically significant relationship.
A) .001
B) .01
C) .05
D) There is no statistically significant relationship.
Unlock Deck
Unlock for access to all 27 flashcards in this deck.
Unlock Deck
k this deck
14
What type of test was used to answer questions 12-14?
A) one-way chi-square
B) two-way chi-square
C) t-ratio
D) f-ratio
A) one-way chi-square
B) two-way chi-square
C) t-ratio
D) f-ratio
Unlock Deck
Unlock for access to all 27 flashcards in this deck.
Unlock Deck
k this deck
15
Suppose you obtain a chi-square statistic of 13.4. Are your results statistically significant if the critical value obtained from the distribution of chi-square is 5.99 with an alpha level of .05?
A) results are not significant
B) results are significant
C) not enough information is provided here
A) results are not significant
B) results are significant
C) not enough information is provided here
Unlock Deck
Unlock for access to all 27 flashcards in this deck.
Unlock Deck
k this deck
16
Suppose you obtain a chi-square statistic of 3.7. Are your results statistically significant if the critical value obtained from the distribution of chi-square is 9.2 with an alpha level of .01?
A) results are not significant
B) results are significant
C) not enough information is provided here
A) results are not significant
B) results are significant
C) not enough information is provided here
Unlock Deck
Unlock for access to all 27 flashcards in this deck.
Unlock Deck
k this deck
17
-------- frequencies are those frequencies that are expected in a frequency table if no trends exist in the data.
A) Observed
B) Expected
C) Trend
D) Significant
A) Observed
B) Expected
C) Trend
D) Significant
Unlock Deck
Unlock for access to all 27 flashcards in this deck.
Unlock Deck
k this deck
18
------------ frequencies are those frequencies that are actually distributed in a frequency table.
A) Observed
B) Expected
C) Trend
D) Significant
A) Observed
B) Expected
C) Trend
D) Significant
Unlock Deck
Unlock for access to all 27 flashcards in this deck.
Unlock Deck
k this deck
19
According to the textbook, the column variable is the dependent variable in hypotheses.
Unlock Deck
Unlock for access to all 27 flashcards in this deck.
Unlock Deck
k this deck
20
The degrees of freedom in a bivariate table are found by subtracting 1 from the number of rows.
Unlock Deck
Unlock for access to all 27 flashcards in this deck.
Unlock Deck
k this deck
21
Expected frequencies are the frequencies we would expect to see if no trends exist in the data.
Unlock Deck
Unlock for access to all 27 flashcards in this deck.
Unlock Deck
k this deck
22
Suppose you obtain a chi-square statistic of 5.9. This is not statistically significant if the critical value obtained from the distribution of chi-square is 9.2 with an alpha level of .01.
Unlock Deck
Unlock for access to all 27 flashcards in this deck.
Unlock Deck
k this deck
23
A chi-square statistic of 8.2 is statistically significant if the critical value obtained from the distribution of chi-square is 5.99 with an alpha level of .05.
Unlock Deck
Unlock for access to all 27 flashcards in this deck.
Unlock Deck
k this deck
24
The following is a hypothetical bivariate table of gender and religion:
a.Complete the bivariate table. (Add marginals, percentages, and total N).
b.Answer the following questions about the table:
What is the independent variable for this table?
What is the dependent variable?
a.Complete the bivariate table. (Add marginals, percentages, and total N).b.Answer the following questions about the table:
What is the independent variable for this table?
What is the dependent variable?
Unlock Deck
Unlock for access to all 27 flashcards in this deck.
Unlock Deck
k this deck
25
Use the following table to answer questions
SHOULD MARIJUANA BE MADE LEGAL by RESPONDENTS SEX
-Calculate chi-square for the above table.
SHOULD MARIJUANA BE MADE LEGAL by RESPONDENTS SEX
-Calculate chi-square for the above table.
Unlock Deck
Unlock for access to all 27 flashcards in this deck.
Unlock Deck
k this deck
26
Use the following table to answer questions
SHOULD MARIJUANA BE MADE LEGAL by RESPONDENTS SEX
-Interpret chi-square. Be sure to include a discussion of statistical significance.
SHOULD MARIJUANA BE MADE LEGAL by RESPONDENTS SEX
-Interpret chi-square. Be sure to include a discussion of statistical significance.
Unlock Deck
Unlock for access to all 27 flashcards in this deck.
Unlock Deck
k this deck
27
Use the table below to answer the following questions:
-Test the null hypothesis that gender and support for welfare are independent (alpha =.05). Begin by stating the research hypothesis.
Research Hypothesis:
Obtained statistic score:
Decision:
Interpretation:
-Test the null hypothesis that gender and support for welfare are independent (alpha =.05). Begin by stating the research hypothesis.
Research Hypothesis:
Obtained statistic score:
Decision:
Interpretation:
Unlock Deck
Unlock for access to all 27 flashcards in this deck.
Unlock Deck
k this deck
Unlock Deck
Unlock for access to all 27 flashcards in this deck.


