Deck 9: Analysis of Variance
Full screen (f)
Question
Question
Question
Question
Question
Question
Question
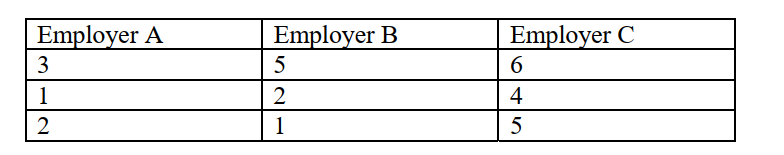
Use the table below to answer questions :
Number of Years Respondent Worked across Employers
-Determine the number of degrees of freedom between groups.
A) 1
B) 2
C) 3
D) 6
Number of Years Respondent Worked across Employers
-Determine the number of degrees of freedom between groups.
A) 1
B) 2
C) 3
D) 6
Question
Use the table below to answer questions :
Number of Years Respondent Worked across Employers
-Determine the number of degrees of freedom among the subgroups.
A) 2
B) 3
C) 6
D) 12
Number of Years Respondent Worked across Employers
-Determine the number of degrees of freedom among the subgroups.
A) 2
B) 3
C) 6
D) 12
Question
Use the table below to answer questions :
Number of Years Respondent Worked across Employers
-What is the value of the total sum of squares (SST)?
A) 3.22
B) 4.93
C) 27.55
D) 32.14
Number of Years Respondent Worked across Employers
-What is the value of the total sum of squares (SST)?
A) 3.22
B) 4.93
C) 27.55
D) 32.14
Question
Use the table below to answer questions :
Number of Years Respondent Worked across Employers
-What is the value of the within-group sum of squares (SSW)?
A) 8.67
B) 12.67
C) 22.61
D) 32.14
Number of Years Respondent Worked across Employers
-What is the value of the within-group sum of squares (SSW)?
A) 8.67
B) 12.67
C) 22.61
D) 32.14
Question
Use the table below to answer questions :
Number of Years Respondent Worked across Employers
-What is the value of the between-group sum of squares (SSB)?
A) 8.67
B) 12.67
C) 14.88
D) 22.61
Number of Years Respondent Worked across Employers
-What is the value of the between-group sum of squares (SSB)?
A) 8.67
B) 12.67
C) 14.88
D) 22.61
Question
Use the table below to answer questions :
Number of Years Respondent Worked across Employers
-What is the value of the mean square between populations?
A) 7.44
B) 8.67
C) 14.88
D) 22.61
Number of Years Respondent Worked across Employers
-What is the value of the mean square between populations?
A) 7.44
B) 8.67
C) 14.88
D) 22.61
Question
Use the table below to answer questions :
Number of Years Respondent Worked across Employers
-What is the value of the mean square within populations?
A) 2.11
B) 7.44
C) 14.88
D) 22.61
Number of Years Respondent Worked across Employers
-What is the value of the mean square within populations?
A) 2.11
B) 7.44
C) 14.88
D) 22.61
Question
Use the table below to answer questions :
Number of Years Respondent Worked across Employers
-What is the value of the f-ratio?
A) 1.06
B) 3.52
C) 9.23
D) 14.88
Number of Years Respondent Worked across Employers
-What is the value of the f-ratio?
A) 1.06
B) 3.52
C) 9.23
D) 14.88
Question
Use the table below to answer questions :
Number of Years Respondent Worked across Employers
-Is there a statistically significant difference among the means of these groups?
A) no
B) yes
C) there is not enough information to determine
Number of Years Respondent Worked across Employers
-Is there a statistically significant difference among the means of these groups?
A) no
B) yes
C) there is not enough information to determine
Question
Use the table below to answer questions :
Number of Years Respondent Worked across Employers
-What is the value of eta2?
A) .2
B) .43
C) .54
D) .72
Number of Years Respondent Worked across Employers
-What is the value of eta2?
A) .2
B) .43
C) .54
D) .72
Question
Use the table below to answer questions :
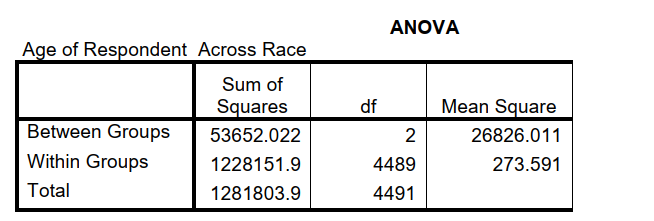
-What is the value of the f-ratio?
A) .02
B) .27
C) 98.05
D) 273.59
-What is the value of the f-ratio?
A) .02
B) .27
C) 98.05
D) 273.59
Question
Use the table below to answer questions :
-Are the differences across categories statistically significant?
A) no
B) yes
C) there is not enough information to determine
-Are the differences across categories statistically significant?
A) no
B) yes
C) there is not enough information to determine
Question
Use the table below to answer questions :
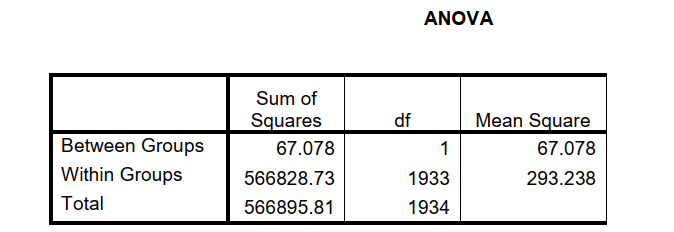
-What is the value of the f-ratio?
A) .001
B) .229
C) .293
D) 67.08
-What is the value of the f-ratio?
A) .001
B) .229
C) .293
D) 67.08
Question
Use the table below to answer questions :
-Are the differences across categories statistically significant?
A) no
B) yes
C) there is not enough information to determine
-Are the differences across categories statistically significant?
A) no
B) yes
C) there is not enough information to determine
Question
Question
Question
Question
Question
Question
Question
Use the table below to answer the following questions:
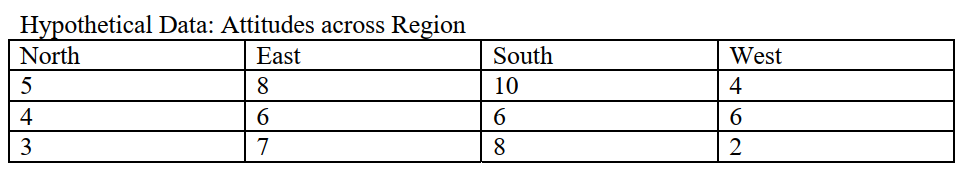
a.Determine the number of degrees of freedom between groups.
b.Determine the number of degrees of freedom among the subgroups.
c.What is the value of thetotal sum of squares (SST)?
d.What is the value of the within-group sum of squares (SSW)?
e.What is the value of the between-group sum of squares (SSB)?
f.What is the value of the mean square between populations?
g.What is the value of the mean square within populations?
h.What is the value of the f-ratio?
i.Is there a statistically significant difference among the means of these groups?
j.What is the value of Eta2?
k.oes Eta2 offer any evidence that attitudes areassociated with region? Explain.

Unlock Deck
Sign up to unlock the cards in this deck!
Unlock Deck
Unlock Deck
1/27
Play
Full screen (f)
Deck 9: Analysis of Variance
1
If the sum of squares between is equal to 20 and the sum of squares within is equal to 10, what is the value of the total sum of squares?
A) 10
B) 20
C) 30
D) 200
A) 10
B) 20
C) 30
D) 200
30
2
If the sum of squares between is equal to 20 and the sum of squares within is equal to 10, what is the value of eta2?
A) .2
B) .46
C) .67
D) 1.5
A) .2
B) .46
C) .67
D) 1.5
.67
3
If the sum of squares between is equal to 7 and the sum of squares within is equal to 3, what is the value of the total sum of squares?
A) 7
B) 10
C) 13
D) 21
A) 7
B) 10
C) 13
D) 21
10
4
If the sum of squares between is equal to 7 and the sum of squares within is equal to 3, what is the value of eta2?
A) .2
B) .43
C) .70
D) 1.4
A) .2
B) .43
C) .70
D) 1.4
Unlock Deck
Unlock for access to all 27 flashcards in this deck.
Unlock Deck
k this deck
5
Eta2 should be used when the independent variable is categorical and the dependent variable is -----------.
A) nominal
B) ordinal
C) categorical
D) interval/ratio
A) nominal
B) ordinal
C) categorical
D) interval/ratio
Unlock Deck
Unlock for access to all 27 flashcards in this deck.
Unlock Deck
k this deck
6
What is the strength of the association represented by an eta2 of .87?
A) weak
B) moderate
C) strong
D) the measure does not reflect strength
A) weak
B) moderate
C) strong
D) the measure does not reflect strength
Unlock Deck
Unlock for access to all 27 flashcards in this deck.
Unlock Deck
k this deck
7
Use the table below to answer questions :
Number of Years Respondent Worked across Employers
-Determine the number of degrees of freedom between groups.
A) 1
B) 2
C) 3
D) 6
Number of Years Respondent Worked across Employers
-Determine the number of degrees of freedom between groups.
A) 1
B) 2
C) 3
D) 6
Unlock Deck
Unlock for access to all 27 flashcards in this deck.
Unlock Deck
k this deck
8
Use the table below to answer questions :
Number of Years Respondent Worked across Employers
-Determine the number of degrees of freedom among the subgroups.
A) 2
B) 3
C) 6
D) 12
Number of Years Respondent Worked across Employers
-Determine the number of degrees of freedom among the subgroups.
A) 2
B) 3
C) 6
D) 12
Unlock Deck
Unlock for access to all 27 flashcards in this deck.
Unlock Deck
k this deck
9
Use the table below to answer questions :
Number of Years Respondent Worked across Employers
-What is the value of the total sum of squares (SST)?
A) 3.22
B) 4.93
C) 27.55
D) 32.14
Number of Years Respondent Worked across Employers
-What is the value of the total sum of squares (SST)?
A) 3.22
B) 4.93
C) 27.55
D) 32.14
Unlock Deck
Unlock for access to all 27 flashcards in this deck.
Unlock Deck
k this deck
10
Use the table below to answer questions :
Number of Years Respondent Worked across Employers
-What is the value of the within-group sum of squares (SSW)?
A) 8.67
B) 12.67
C) 22.61
D) 32.14
Number of Years Respondent Worked across Employers
-What is the value of the within-group sum of squares (SSW)?
A) 8.67
B) 12.67
C) 22.61
D) 32.14
Unlock Deck
Unlock for access to all 27 flashcards in this deck.
Unlock Deck
k this deck
11
Use the table below to answer questions :
Number of Years Respondent Worked across Employers
-What is the value of the between-group sum of squares (SSB)?
A) 8.67
B) 12.67
C) 14.88
D) 22.61
Number of Years Respondent Worked across Employers
-What is the value of the between-group sum of squares (SSB)?
A) 8.67
B) 12.67
C) 14.88
D) 22.61
Unlock Deck
Unlock for access to all 27 flashcards in this deck.
Unlock Deck
k this deck
12
Use the table below to answer questions :
Number of Years Respondent Worked across Employers
-What is the value of the mean square between populations?
A) 7.44
B) 8.67
C) 14.88
D) 22.61
Number of Years Respondent Worked across Employers
-What is the value of the mean square between populations?
A) 7.44
B) 8.67
C) 14.88
D) 22.61
Unlock Deck
Unlock for access to all 27 flashcards in this deck.
Unlock Deck
k this deck
13
Use the table below to answer questions :
Number of Years Respondent Worked across Employers
-What is the value of the mean square within populations?
A) 2.11
B) 7.44
C) 14.88
D) 22.61
Number of Years Respondent Worked across Employers
-What is the value of the mean square within populations?
A) 2.11
B) 7.44
C) 14.88
D) 22.61
Unlock Deck
Unlock for access to all 27 flashcards in this deck.
Unlock Deck
k this deck
14
Use the table below to answer questions :
Number of Years Respondent Worked across Employers
-What is the value of the f-ratio?
A) 1.06
B) 3.52
C) 9.23
D) 14.88
Number of Years Respondent Worked across Employers
-What is the value of the f-ratio?
A) 1.06
B) 3.52
C) 9.23
D) 14.88
Unlock Deck
Unlock for access to all 27 flashcards in this deck.
Unlock Deck
k this deck
15
Use the table below to answer questions :
Number of Years Respondent Worked across Employers
-Is there a statistically significant difference among the means of these groups?
A) no
B) yes
C) there is not enough information to determine
Number of Years Respondent Worked across Employers
-Is there a statistically significant difference among the means of these groups?
A) no
B) yes
C) there is not enough information to determine
Unlock Deck
Unlock for access to all 27 flashcards in this deck.
Unlock Deck
k this deck
16
Use the table below to answer questions :
Number of Years Respondent Worked across Employers
-What is the value of eta2?
A) .2
B) .43
C) .54
D) .72
Number of Years Respondent Worked across Employers
-What is the value of eta2?
A) .2
B) .43
C) .54
D) .72
Unlock Deck
Unlock for access to all 27 flashcards in this deck.
Unlock Deck
k this deck
17
Use the table below to answer questions :
-What is the value of the f-ratio?
A) .02
B) .27
C) 98.05
D) 273.59
-What is the value of the f-ratio?
A) .02
B) .27
C) 98.05
D) 273.59
Unlock Deck
Unlock for access to all 27 flashcards in this deck.
Unlock Deck
k this deck
18
Use the table below to answer questions :
-Are the differences across categories statistically significant?
A) no
B) yes
C) there is not enough information to determine
-Are the differences across categories statistically significant?
A) no
B) yes
C) there is not enough information to determine
Unlock Deck
Unlock for access to all 27 flashcards in this deck.
Unlock Deck
k this deck
19
Use the table below to answer questions :
-What is the value of the f-ratio?
A) .001
B) .229
C) .293
D) 67.08
-What is the value of the f-ratio?
A) .001
B) .229
C) .293
D) 67.08
Unlock Deck
Unlock for access to all 27 flashcards in this deck.
Unlock Deck
k this deck
20
Use the table below to answer questions :
-Are the differences across categories statistically significant?
A) no
B) yes
C) there is not enough information to determine
-Are the differences across categories statistically significant?
A) no
B) yes
C) there is not enough information to determine
Unlock Deck
Unlock for access to all 27 flashcards in this deck.
Unlock Deck
k this deck
21
ANOVA is only useful when comparing two means.
Unlock Deck
Unlock for access to all 27 flashcards in this deck.
Unlock Deck
k this deck
22
Within-group sum of squares is the amount of variation that exists for all cases in a sample relative to their sub-group means.
Unlock Deck
Unlock for access to all 27 flashcards in this deck.
Unlock Deck
k this deck
23
Within-group sum of squares is the amount of variation that exists for all cases in a sample relative to the overall mean.
Unlock Deck
Unlock for access to all 27 flashcards in this deck.
Unlock Deck
k this deck
24
Eta2 should be used when the independent variable is interval/ratio and the dependent variable is categorical.
Unlock Deck
Unlock for access to all 27 flashcards in this deck.
Unlock Deck
k this deck
25
When should ANOVA be used?
Unlock Deck
Unlock for access to all 27 flashcards in this deck.
Unlock Deck
k this deck
26
How does ANOVA improve upon t-tests?
Unlock Deck
Unlock for access to all 27 flashcards in this deck.
Unlock Deck
k this deck
27
Use the table below to answer the following questions:
a.Determine the number of degrees of freedom between groups.
b.Determine the number of degrees of freedom among the subgroups.
c.What is the value of thetotal sum of squares (SST)?
d.What is the value of the within-group sum of squares (SSW)?
e.What is the value of the between-group sum of squares (SSB)?
f.What is the value of the mean square between populations?
g.What is the value of the mean square within populations?
h.What is the value of the f-ratio?
i.Is there a statistically significant difference among the means of these groups?
j.What is the value of Eta2?
k.oes Eta2 offer any evidence that attitudes areassociated with region? Explain.
Unlock Deck
Unlock for access to all 27 flashcards in this deck.
Unlock Deck
k this deck
Unlock Deck
Unlock for access to all 27 flashcards in this deck.


