Deck 10: Correlation and Regression
Full screen (f)
Question
Question
Question
Question
Question
Question
Question
Question
Question
Question
Question
Use the data below to answer questions:
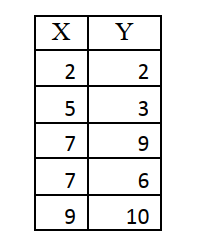
-What is the sum of squares for the independent variable?
A) 0
B) 28
C) 30
D) 34
-What is the sum of squares for the independent variable?
A) 0
B) 28
C) 30
D) 34
Question
Use the data below to answer questions:
-What is the sum of squares for the dependent variable?
A) 0
B) 28
C) 34
D) 50
-What is the sum of squares for the dependent variable?
A) 0
B) 28
C) 34
D) 50
Question
Use the data below to answer questions:
-What is the sum of products?
A) 0
B) 28
C) 34
D) 50
-What is the sum of products?
A) 0
B) 28
C) 34
D) 50
Question
Use the data below to answer questions:
-What is the value of Pearson's r?
A) 0
B) .34
C) .91
D) 1
-What is the value of Pearson's r?
A) 0
B) .34
C) .91
D) 1
Question
Use the data below to answer questions:
-What is the t-ratio?
A) 0
B) 3.8
C) 4.6
D) 34
-What is the t-ratio?
A) 0
B) 3.8
C) 4.6
D) 34
Question
Use the data below to answer questions:
-How many degrees of freedom exist in the data?
A) 0
B) 2
C) 3
D) 5
-How many degrees of freedom exist in the data?
A) 0
B) 2
C) 3
D) 5
Question
Use the data below to answer questions:
-What is the slope?
A) -1.2
B) 0
C) 1.2
D) 5
-What is the slope?
A) -1.2
B) 0
C) 1.2
D) 5
Question
Use the data below to answer questions:
-What is the y-intercept?
A) -1.2
B) 0
C) 1.2
D) 5
-What is the y-intercept?
A) -1.2
B) 0
C) 1.2
D) 5
Question
Use the data below to answer questions:
-What is the predicted value of Y when X equals 5?
A) -1.2
B) 1.2
C) 4.8
D) 5
-What is the predicted value of Y when X equals 5?
A) -1.2
B) 1.2
C) 4.8
D) 5
Question
Use the data below to answer questions:
-Y is predicted to be 10.8 when X equals --------------?
A) 4.8
B) 10
C) 10.8
D) 12
-Y is predicted to be 10.8 when X equals --------------?
A) 4.8
B) 10
C) 10.8
D) 12
Question
Use the data below to answer questions:
-What is the direction of the relationship between these variables?
A) positive
B) negative
C) symmetrical
D) There is no correlation.
-What is the direction of the relationship between these variables?
A) positive
B) negative
C) symmetrical
D) There is no correlation.
Question
Question
Question
Question
Question
Question
Use the data below to answer the following questions:
a. Create a scatterplot using the data below.
 b. Calculate the slope and the y-intercept for the regression line for the distribution. Write the regression line equation.
Slope:
Y-intercept:
Regression line:
 c.Interpret the numbers of boththe slope and the y-intercept.
d.Compute r and 2 for the regression equation.
e. Interpret both the r and 2 What does each number tell us?
a. Create a scatterplot using the data below.
b. Calculate the slope and the y-intercept for the regression line for the distribution. Write the regression line equation.Slope:
Y-intercept:
Regression line:
c.Interpret the numbers of boththe slope and the y-intercept.d.Compute r and 2 for the regression equation.
e. Interpret both the r and 2 What does each number tell us?
Question
Use the table below to answer the following questions:
 a.Calculate the slope and the y-intercept for the regression line for the distribution. Writethe regression line.
Slope:
Y-intercept:
Regression line:
b.Interpret the numbers of both the slope and the y-intercept.
c.Compute r and r2 for the regression equation.
d. Interpret both the r and r2 . What does each number tell us?
a.Calculate the slope and the y-intercept for the regression line for the distribution. Writethe regression line.Slope:
Y-intercept:
Regression line:
b.Interpret the numbers of both the slope and the y-intercept.
c.Compute r and r2 for the regression equation.
d. Interpret both the r and r2 . What does each number tell us?

Unlock Deck
Sign up to unlock the cards in this deck!
Unlock Deck
Unlock Deck
1/28
Play
Full screen (f)
Deck 10: Correlation and Regression
1
Consider the following linear regression prediction equation: Y = 12 + 3X. If X = 7, what is the predicted value of Y for this observation?
A) 3
B) 12
C) 21
D) 33
A) 3
B) 12
C) 21
D) 33
33
2
Based on the equation in question 1, where does the regression line cross the y-axis?
A) 3
B) 12
C) 21
D) 33
A) 3
B) 12
C) 21
D) 33
12
3
Based on the equation in question 1, what type of correlation appears to exist in the data?
A) positive
B) negative
C) symmetrical
D) There is no correlation.
A) positive
B) negative
C) symmetrical
D) There is no correlation.
positive
4
Consider the following linear regression prediction equation: Y = 4 + (-4.2)X. If X=2, what is the predicted value of Y for this observation?
A) -7.8
B) -4.4
C) 4
D) 12.4
A) -7.8
B) -4.4
C) 4
D) 12.4
Unlock Deck
Unlock for access to all 28 flashcards in this deck.
Unlock Deck
k this deck
5
Based on the equation in question 4, where does the regression line cross the y-axis?
A) -7.8
B) -4.4
C) 4
D) 12.4
A) -7.8
B) -4.4
C) 4
D) 12.4
Unlock Deck
Unlock for access to all 28 flashcards in this deck.
Unlock Deck
k this deck
6
Based on the equation in question 4, what type of correlation appears to exist in the data?
A) positive
B) negative
C) symmetrical
D) There is no correlation.
A) positive
B) negative
C) symmetrical
D) There is no correlation.
Unlock Deck
Unlock for access to all 28 flashcards in this deck.
Unlock Deck
k this deck
7
In the linear regression equation, Y=a+bx, the coefficient, "b" represents -----------.
A) the predicted value of y
B) the y-intercept
C) slope
D) Pearson's r
A) the predicted value of y
B) the y-intercept
C) slope
D) Pearson's r
Unlock Deck
Unlock for access to all 28 flashcards in this deck.
Unlock Deck
k this deck
8
In the linear regression equation, Y=a+bx, "a" represents -----------.
A) the predicted value of y
B) the y-intercept
C) slope
D) Pearson's r
A) the predicted value of y
B) the y-intercept
C) slope
D) Pearson's r
Unlock Deck
Unlock for access to all 28 flashcards in this deck.
Unlock Deck
k this deck
9
If r2 =.60, what percent of the variation in the dependent variable is left unexplained
By the independent variable?
A) .4
B) .6
C) 40
D) 60
By the independent variable?
A) .4
B) .6
C) 40
D) 60
Unlock Deck
Unlock for access to all 28 flashcards in this deck.
Unlock Deck
k this deck
10
If r2 =.40, what percent of the variation in the dependent variable is explained by the independent variable?
A) .4
B) .6
C) 40
D) 60
A) .4
B) .6
C) 40
D) 60
Unlock Deck
Unlock for access to all 28 flashcards in this deck.
Unlock Deck
k this deck
11
Use the data below to answer questions:
-What is the sum of squares for the independent variable?
A) 0
B) 28
C) 30
D) 34
-What is the sum of squares for the independent variable?
A) 0
B) 28
C) 30
D) 34
Unlock Deck
Unlock for access to all 28 flashcards in this deck.
Unlock Deck
k this deck
12
Use the data below to answer questions:
-What is the sum of squares for the dependent variable?
A) 0
B) 28
C) 34
D) 50
-What is the sum of squares for the dependent variable?
A) 0
B) 28
C) 34
D) 50
Unlock Deck
Unlock for access to all 28 flashcards in this deck.
Unlock Deck
k this deck
13
Use the data below to answer questions:
-What is the sum of products?
A) 0
B) 28
C) 34
D) 50
-What is the sum of products?
A) 0
B) 28
C) 34
D) 50
Unlock Deck
Unlock for access to all 28 flashcards in this deck.
Unlock Deck
k this deck
14
Use the data below to answer questions:
-What is the value of Pearson's r?
A) 0
B) .34
C) .91
D) 1
-What is the value of Pearson's r?
A) 0
B) .34
C) .91
D) 1
Unlock Deck
Unlock for access to all 28 flashcards in this deck.
Unlock Deck
k this deck
15
Use the data below to answer questions:
-What is the t-ratio?
A) 0
B) 3.8
C) 4.6
D) 34
-What is the t-ratio?
A) 0
B) 3.8
C) 4.6
D) 34
Unlock Deck
Unlock for access to all 28 flashcards in this deck.
Unlock Deck
k this deck
16
Use the data below to answer questions:
-How many degrees of freedom exist in the data?
A) 0
B) 2
C) 3
D) 5
-How many degrees of freedom exist in the data?
A) 0
B) 2
C) 3
D) 5
Unlock Deck
Unlock for access to all 28 flashcards in this deck.
Unlock Deck
k this deck
17
Use the data below to answer questions:
-What is the slope?
A) -1.2
B) 0
C) 1.2
D) 5
-What is the slope?
A) -1.2
B) 0
C) 1.2
D) 5
Unlock Deck
Unlock for access to all 28 flashcards in this deck.
Unlock Deck
k this deck
18
Use the data below to answer questions:
-What is the y-intercept?
A) -1.2
B) 0
C) 1.2
D) 5
-What is the y-intercept?
A) -1.2
B) 0
C) 1.2
D) 5
Unlock Deck
Unlock for access to all 28 flashcards in this deck.
Unlock Deck
k this deck
19
Use the data below to answer questions:
-What is the predicted value of Y when X equals 5?
A) -1.2
B) 1.2
C) 4.8
D) 5
-What is the predicted value of Y when X equals 5?
A) -1.2
B) 1.2
C) 4.8
D) 5
Unlock Deck
Unlock for access to all 28 flashcards in this deck.
Unlock Deck
k this deck
20
Use the data below to answer questions:
-Y is predicted to be 10.8 when X equals --------------?
A) 4.8
B) 10
C) 10.8
D) 12
-Y is predicted to be 10.8 when X equals --------------?
A) 4.8
B) 10
C) 10.8
D) 12
Unlock Deck
Unlock for access to all 28 flashcards in this deck.
Unlock Deck
k this deck
21
Use the data below to answer questions:
-What is the direction of the relationship between these variables?
A) positive
B) negative
C) symmetrical
D) There is no correlation.
-What is the direction of the relationship between these variables?
A) positive
B) negative
C) symmetrical
D) There is no correlation.
Unlock Deck
Unlock for access to all 28 flashcards in this deck.
Unlock Deck
k this deck
22
A relationship is said to be strong when Pearson's r is .10.
Unlock Deck
Unlock for access to all 28 flashcards in this deck.
Unlock Deck
k this deck
23
A Pearson's r of -.9 represents a stronger association than an r of .60.
Unlock Deck
Unlock for access to all 28 flashcards in this deck.
Unlock Deck
k this deck
24
In the linear regression equation, "a" represents the y-intercept.
Unlock Deck
Unlock for access to all 28 flashcards in this deck.
Unlock Deck
k this deck
25
In the linear regression equation, "b" represents the y-intercept.
Unlock Deck
Unlock for access to all 28 flashcards in this deck.
Unlock Deck
k this deck
26
r2 represents the percent of total variance in the independent variable that is explained by the dependent variable.
Unlock Deck
Unlock for access to all 28 flashcards in this deck.
Unlock Deck
k this deck
27
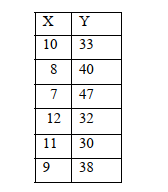
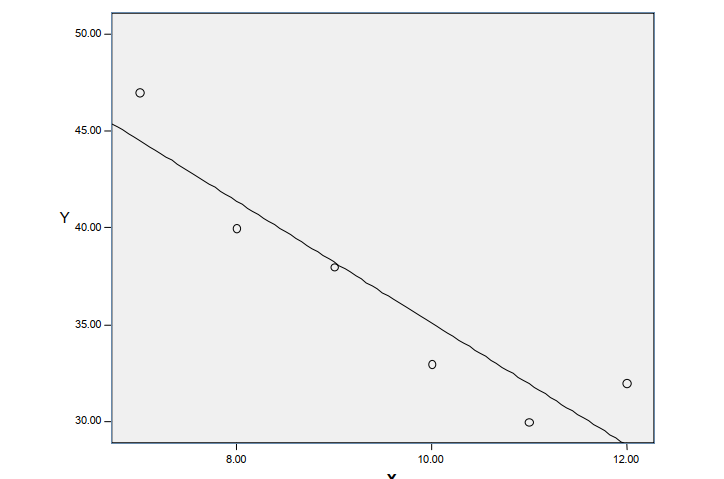
Use the data below to answer the following questions:
a. Create a scatterplot using the data below.
b. Calculate the slope and the y-intercept for the regression line for the distribution. Write the regression line equation.
Slope:
Y-intercept:
Regression line:
c.Interpret the numbers of boththe slope and the y-intercept.
d.Compute r and 2 for the regression equation.
e. Interpret both the r and 2 What does each number tell us?
a. Create a scatterplot using the data below.
b. Calculate the slope and the y-intercept for the regression line for the distribution. Write the regression line equation.Slope:
Y-intercept:
Regression line:
c.Interpret the numbers of boththe slope and the y-intercept.d.Compute r and 2 for the regression equation.
e. Interpret both the r and 2 What does each number tell us?
Unlock Deck
Unlock for access to all 28 flashcards in this deck.
Unlock Deck
k this deck
28
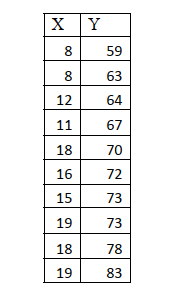
Use the table below to answer the following questions:
a.Calculate the slope and the y-intercept for the regression line for the distribution. Writethe regression line.
Slope:
Y-intercept:
Regression line:
b.Interpret the numbers of both the slope and the y-intercept.
c.Compute r and r2 for the regression equation.
d. Interpret both the r and r2 . What does each number tell us?
a.Calculate the slope and the y-intercept for the regression line for the distribution. Writethe regression line.Slope:
Y-intercept:
Regression line:
b.Interpret the numbers of both the slope and the y-intercept.
c.Compute r and r2 for the regression equation.
d. Interpret both the r and r2 . What does each number tell us?
Unlock Deck
Unlock for access to all 28 flashcards in this deck.
Unlock Deck
k this deck
Unlock Deck
Unlock for access to all 28 flashcards in this deck.


