Deck 11: Estimating Means With Confidence
Full screen (f)
Question
Question
Question
Question
Question
Question
Question
Question
Question
Question
Question
Question
Question
Question
Question
Question
Question
Question
Question
Question
Question
Question
Question
Question
Question
Question
Question
Question
Question
Question
Question
Use the following information for questions:
For a random sample of n = 203 adults in a survey, here is a summary of responses to "How long did you sleep last night?"
-Based on the output, what value estimates, roughly, the average difference that would be found between the sample mean and the population mean ? in repeated samples of this size?
A)
B) 6.42
C) 1.56
D) 0.11
Question
Use the following information for questions:
For a random sample of n = 203 adults in a survey, here is a summary of responses to "How long did you sleep last night?"
-Which of the following provides an approximate 95% confidence interval for the mean hours of sleep the previous night in the population represented by the sample?
A) 6.42 2×0.11
B) 6.42 2×
C) 6.42 0.11
D) 6.42 2×1.56
Question
Use the following information for questions:
For a random sample of n = 203 adults in a survey, here is a summary of responses to "How long did you sleep last night?"
-What confidence level would be associated with the interval 6.42 - 0.11 as a confidence interval for the population mean ?
A) 50%
B) 68%
C) 90%
D) 95%
For a random sample of n = 203 adults in a survey, here is a summary of responses to "How long did you sleep last night?"
-What confidence level would be associated with the interval 6.42 - 0.11 as a confidence interval for the population mean ?
A) 50%
B) 68%
C) 90%
D) 95%
Question
Use the following information for questions:
Spatial perception is measured on a scale from 0 to 10. Two groups of 8th grade children are tested for spatial perception. The students in group 1 were first given a short course on spatial concepts. The students in group 2 received no such instruction. SPSS was used to calculate descriptive statistics for the two samples.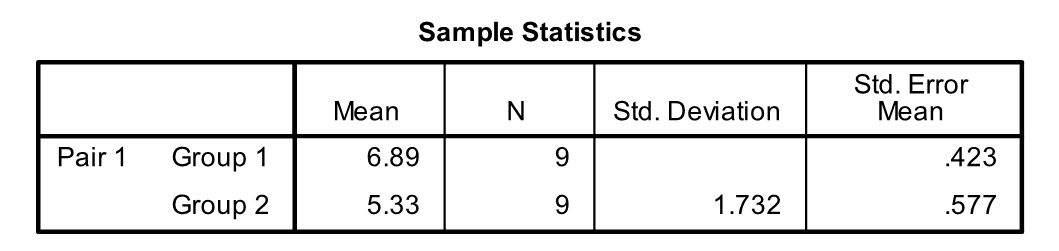
-What is the value of the standard deviation for measurements made on the group 1 students, which is missing in the output?
A) 1.732
B) 3.807
C) 1.269
D) 0.141
Question
Use the following information for questions:
Spatial perception is measured on a scale from 0 to 10. Two groups of 8th grade children are tested for spatial perception. The students in group 1 were first given a short course on spatial concepts. The students in group 2 received no such instruction. SPSS was used to calculate descriptive statistics for the two samples.
-Calculate a 95% confidence interval for the mean spatial perception score for students with instruction.
A) (6.47, 7.31)
B) (5.91, 7.87)
C) (6.04, 7.74)
D) None of the above
Question
Use the following information for questions:
Spatial perception is measured on a scale from 0 to 10. Two groups of 8th grade children are tested for spatial perception. The students in group 1 were first given a short course on spatial concepts. The students in group 2 received no such instruction. SPSS was used to calculate descriptive statistics for the two samples.
-Calculate a 90% confidence interval for the mean spatial perception score for students without instruction.
A) (4.75, 5.91)
B) (4.00, 6.66)
C) (4.26, 6.40)
D) (4.18, 6.48)
Question
Question
Question
Question
Question
Question
Question
Use the following information for questions:
Refer to the following statistical summary of the left foot lengths (in centimeters) for a random sample of 76 college men.
-In terms of the notation of this course, what is the correct way to express the "Mean" shown in the output?
Refer to the following statistical summary of the left foot lengths (in centimeters) for a random sample of 76 college men.
-In terms of the notation of this course, what is the correct way to express the "Mean" shown in the output?
Question
Use the following information for questions:
Refer to the following statistical summary of the left foot lengths (in centimeters) for a random sample of 76 college men.
-Complete the following sentence: In about 95% of all samples of this size from this population, the difference between the sample mean and the population mean would be ____.
Refer to the following statistical summary of the left foot lengths (in centimeters) for a random sample of 76 college men.
-Complete the following sentence: In about 95% of all samples of this size from this population, the difference between the sample mean and the population mean would be ____.
Question
Use the following information for questions:
Refer to the following statistical summary of the left foot lengths (in centimeters) for a random sample of 76 college men.
-Give an approximate 95% confidence interval for the average left foot length for college men.
Refer to the following statistical summary of the left foot lengths (in centimeters) for a random sample of 76 college men.
-Give an approximate 95% confidence interval for the average left foot length for college men.
Question
Use the following information for questions:
Spatial perception is measured on a scale from 0 to 10. A group of 9th grade students are tested for spatial perception. SPSS was used to calculate descriptive statistics of the spatial perception scores in the sample.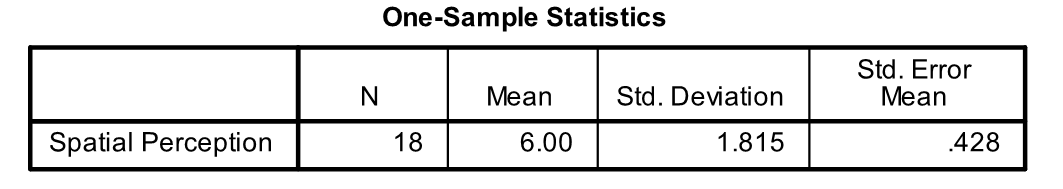
-In terms of the notation of this course, what is the correct way to express the value 0.428 in the output?
Question
Use the following information for questions:
Spatial perception is measured on a scale from 0 to 10. A group of 9th grade students are tested for spatial perception. SPSS was used to calculate descriptive statistics of the spatial perception scores in the sample.
-Explain in your own words what the value 0.428 in the output measures.
Spatial perception is measured on a scale from 0 to 10. A group of 9th grade students are tested for spatial perception. SPSS was used to calculate descriptive statistics of the spatial perception scores in the sample.
-Explain in your own words what the value 0.428 in the output measures.
Question
Use the following information for questions:
Spatial perception is measured on a scale from 0 to 10. A group of 9th grade students are tested for spatial perception. SPSS was used to calculate descriptive statistics of the spatial perception scores in the sample.
-Give a 90% confidence interval for the average spatial perception score for all 9th graders.
Question
Question
Question
Question
Question
Question
Question
Use the following information for questions:
An experiment is conducted with 15 seniors who are taking Spanish at Oak View High School. A randomly selected group of eight students is first tested with a written test and a day later with an oral exam. To avoid order effects, the other seven students are tested in reverse order. The instructor is interested in the difference in grades between the two testing methods. SPSS is used to obtain descriptive statistics for the grades of the two tests.
-What are the degrees of freedom for this design?
A) 7
B) 8
C) 14
D) 29
Question
Use the following information for questions:
An experiment is conducted with 15 seniors who are taking Spanish at Oak View High School. A randomly selected group of eight students is first tested with a written test and a day later with an oral exam. To avoid order effects, the other seven students are tested in reverse order. The instructor is interested in the difference in grades between the two testing methods. SPSS is used to obtain descriptive statistics for the grades of the two tests.
-What is the value of the standard error for the difference in mean grades between the two testing methods?
A) 0.395
B) 0.529
C) 0.563
D) 0.660
Question
Use the following information for questions:
An experiment is conducted with 15 seniors who are taking Spanish at Oak View High School. A randomly selected group of eight students is first tested with a written test and a day later with an oral exam. To avoid order effects, the other seven students are tested in reverse order. The instructor is interested in the difference in grades between the two testing methods. SPSS is used to obtain descriptive statistics for the grades of the two tests.
-Calculate a 98% confidence interval for the difference in mean grades between the two testing methods.
A) (-3.85, -1.44)
B) (-4.03, -1.26)
C) (-4.12, -1.17)
D) (-4.33, -0.95)
Question
Question
Question
Question
Question
Question
Question
Question
Question
Question
Question
Question
Question
Question
Question
Question
Question
Question
Question
Question
Question
Question
Question

Unlock Deck
Sign up to unlock the cards in this deck!
Unlock Deck
Unlock Deck
1/103
Play
Full screen (f)
Deck 11: Estimating Means With Confidence
1
Use the following information for questions:
For each study, decide if the two samples are independent samples or paired samples.
-A group of 50 students each measured the length of their right arm and the length of their left arm. The average right arm lengths were compared to the average left arm lengths.
A) Independent samples
B) Paired samples
Paired samples
2
Use the following information for questions:
For each study, decide if the two samples are independent samples or paired samples.
-A study compared the average number of courses taken by a random sample of 100 freshmen at a university with the average number of courses taken by a separate random sample of 50 freshmen at a community college.
A) Independent samples
B) Paired samples
Independent samples
3
Use the following information for questions:
For each study, decide if the two samples are independent samples or paired samples.
-A group of 100 students were randomly assigned to receive vitamin C (50 students) or a placebo (50 students). The groups were followed for 2 weeks and the proportions of students with colds were compared.
A) Independent samples
B) Paired samples
Independent samples
4
Use the following information for questions:
For each study, decide if the two samples are independent samples or paired samples.
-A group of 50 students had their blood pressures measured before and after watching a movie containing violence. The mean blood pressure before the movie was compared with the mean pressure after the movie.
A) Independent samples
B) Paired samples
Unlock Deck
Unlock for access to all 103 flashcards in this deck.
Unlock Deck
k this deck
5
Which of the following helps determine the standard error for a confidence interval for a mean?
A) The sample size(s).
B) The sample estimate.
C) The true value of the population parameter.
D) The confidence level.
A) The sample size(s).
B) The sample estimate.
C) The true value of the population parameter.
D) The confidence level.
Unlock Deck
Unlock for access to all 103 flashcards in this deck.
Unlock Deck
k this deck
6
The distinction between a sampling distribution and a confidence interval is:
A) A confidence interval gives possible values for a sample statistic when the population parameter is assumed known, while a sampling distribution gives possible values for a population parameter when only a single value of a sample statistic is known.
B) A sampling distribution gives possible values for a sample statistic when the population parameter is assumed known, while a confidence interval gives possible values for a population parameter when only a single value of a sample statistic is known.
C) Sampling distributions exist only for situations involving means, while confidence intervals can be computed for situations involving means and proportions.
D) Confidence intervals exist only for situations involving means, while sampling distributions can be computed for situations involving means and proportions.
Unlock Deck
Unlock for access to all 103 flashcards in this deck.
Unlock Deck
k this deck
7
A randomly selected sample of 100 students had an average grade point average (GPA) of 3.2 with a standard deviation of 0.2. The standard error of the sample mean is
A) 0.020
B) 0.200
C) 1.600
D) 2.000
A) 0.020
B) 0.200
C) 1.600
D) 2.000
Unlock Deck
Unlock for access to all 103 flashcards in this deck.
Unlock Deck
k this deck
8
A randomly selected sample of 30 students spent an average amount of $40.00 on a date, with a standard deviation of $5.00. The standard error of the sample mean is
A) 0.063
B) 0.167
C) 0.913
D) 5.000
A) 0.063
B) 0.167
C) 0.913
D) 5.000
Unlock Deck
Unlock for access to all 103 flashcards in this deck.
Unlock Deck
k this deck
9
A random sample of 250 third graders scored an average of 3.2 on a standardized reading test. The standard deviation was 0.95. What is the standard error of the sample mean?
A) 0.95
B) 0.202
C) 0.0038
D) 0.060
A) 0.95
B) 0.202
C) 0.0038
D) 0.060
Unlock Deck
Unlock for access to all 103 flashcards in this deck.
Unlock Deck
k this deck
10
A randomly selected sample of 60 mathematics majors spent an average of $200.00 for textbooks one term, while during the same term, a randomly selected sample of 40 literature majors spent an average of $180.00 for textbooks. The standard deviation for each sample was $20.00. The standard error for the difference between the two sample means is
A) 0.057
B) 4.082
C) 5.744
D) 16.663
A) 0.057
B) 4.082
C) 5.744
D) 16.663
Unlock Deck
Unlock for access to all 103 flashcards in this deck.
Unlock Deck
k this deck
11
A random sample of 40 men drank an average of 20 cups of coffee per week during finals, while a sample of 30 women drank an average of 15 cups of coffee per week. The sample standard deviations were 6 cups for the men and 3 cups for the women. The standard error for the difference between the two sample means is
A) 1.095
B) 1.200
C) 1.549
D) 2.400
A) 1.095
B) 1.200
C) 1.549
D) 2.400
Unlock Deck
Unlock for access to all 103 flashcards in this deck.
Unlock Deck
k this deck
12
Conscientiousness is a tendency to show self-discipline, act dutifully, and aim for achievement. The trait shows a preference for planned rather than spontaneous behavior. A random sample of 650 students is asked to fill out the Hogan Personality Inventory (HPI) to measure their level of conscientiousness. The 300 undergraduate students scored an average of 145 with a standard deviation of 16. The 350 graduate students had a mean score of 153 with a standard deviation of 21. What is the standard error for the difference between the two sample means?
A) 18.5
B) 2.11
C) 1.45
D) 2.05
A) 18.5
B) 2.11
C) 1.45
D) 2.05
Unlock Deck
Unlock for access to all 103 flashcards in this deck.
Unlock Deck
k this deck
13
Which of the following is not true about the standard error of a statistic?
A) The standard error measures, roughly, the average difference between the statistic and the population parameter.
B) The standard error is the estimated standard deviation of the sampling distribution for the statistic.
C) The standard error can never be a negative number.
D) The standard error increases as the sample size(s) increases.
Unlock Deck
Unlock for access to all 103 flashcards in this deck.
Unlock Deck
k this deck
14
For a randomly selected sample of n = 36 men's heights, it is reported that the standard error of the mean is 0.5 inches. Three of the following statements are true, while one is false. Which statement is false?
A) The standard error (0.5 inches) is an estimated value of the standard deviation of the sample mean.
B) If a new sample of n = 36 men's heights is collected, the standard error of the mean might not equal 0.5 inches.
C) Over many different samples of n = 36 men's heights, the average difference between the sample mean and population mean will be roughly 0.5 inches.
D) In about 95% of all samples of n = 36 men's heights, the sample mean will be within 0.5 inches of the population mean.
Unlock Deck
Unlock for access to all 103 flashcards in this deck.
Unlock Deck
k this deck
15
What is the primary purpose of a 95% confidence interval for a mean?
A) to estimate a sample mean
B) to test a hypothesis about a sample mean
C) to estimate a population mean
D) to provide an interval that covers 95% of the individual values in the population
A) to estimate a sample mean
B) to test a hypothesis about a sample mean
C) to estimate a population mean
D) to provide an interval that covers 95% of the individual values in the population
Unlock Deck
Unlock for access to all 103 flashcards in this deck.
Unlock Deck
k this deck
16
The confidence level for a confidence interval for a mean is
A) the probability the procedure provides an interval that covers the sample mean.
B) the probability of making a Type 1 error if the interval is used to test a null hypothesis about the population mean.
C) the probability that individuals in the population have values that fall into the interval.
D) the probability the procedure provides an interval that covers the population mean.
Unlock Deck
Unlock for access to all 103 flashcards in this deck.
Unlock Deck
k this deck
17
Which of the following will not result in paired data?
A) The same measurement is taken twice on each person, under different conditions or at different times.
B) Similar individuals are paired before giving the treatments in an experiment. Each member of a pair then receives a different treatment. The same response variable is measured for all individuals.
C) Two different variables are measured for each individual. There is interest in the amount of difference between the two variables.
D) One random sample is taken, and a variable is recorded for each individual, but then units are categorized as belonging to one population or another.
Unlock Deck
Unlock for access to all 103 flashcards in this deck.
Unlock Deck
k this deck
18
Which of the following statements is most correct about a confidence interval for a mean?
A) It provides a range of values, any of which is a good guess at the possible value of the sample mean.
B) It provides a range of values, any of which is a good guess at the possible value of the population mean.
C) It provides a good guess for the range of values the sample mean is likely to have in repeated samples.
D) It provides a good guess for the range of values the population mean is likely to have in repeated samples.
Unlock Deck
Unlock for access to all 103 flashcards in this deck.
Unlock Deck
k this deck
19
The weights of a sample of n = 8 college men will be used to create a 95% confidence interval for the mean weight of all college men. What is the correct t* multiplier involved in calculating the interval?
A) 1.89
B) 2.00
C) 2.31
D) 2.36
A) 1.89
B) 2.00
C) 2.31
D) 2.36
Unlock Deck
Unlock for access to all 103 flashcards in this deck.
Unlock Deck
k this deck
20
The heights of a sample of n = 18 female college students will be used to create a 98% confidence interval for the mean height of all female college students. What is the correct t* multiplier for this interval?
A) 2.11
B) 2.55
C) 2.57
D) 2.90
A) 2.11
B) 2.55
C) 2.57
D) 2.90
Unlock Deck
Unlock for access to all 103 flashcards in this deck.
Unlock Deck
k this deck
21
The WISC scores (similar to IQ test scores) of a sample of n = 20 5th graders will be used to create a 99% confidence interval for the mean WISC score of all 5th graders. What is the correct t* multiplier for this interval?
A) 2.86
B) 3.55
C) 2.54
D) 2.85
A) 2.86
B) 3.55
C) 2.54
D) 2.85
Unlock Deck
Unlock for access to all 103 flashcards in this deck.
Unlock Deck
k this deck
22
The heights of a random sample of 100 women are recorded. The sample mean is 65.3 inches and the sample standard deviation is 3 inches. Which of the following is an approximate 95% confidence interval for the population mean?
A) 65.3 (2)(0.03)
B) 65.3 (2)(0.3)
C) 65.3 (2)(3)
D) 65.3 (2)(30)
A) 65.3 (2)(0.03)
B) 65.3 (2)(0.3)
C) 65.3 (2)(3)
D) 65.3 (2)(30)
Unlock Deck
Unlock for access to all 103 flashcards in this deck.
Unlock Deck
k this deck
23
A random sample of 100 students had a mean grade point average (GPA) of 3.2 with a standard deviation of 0.2. The standard error of the sample mean in this case is 0.02. Calculate an approximate 95% confidence interval for the mean GPA for all students.
A) (2.8, 3.6)
B) (3.16, 3.24)
C) (3.18, 3.22)
D) None of the above
A) (2.8, 3.6)
B) (3.16, 3.24)
C) (3.18, 3.22)
D) None of the above
Unlock Deck
Unlock for access to all 103 flashcards in this deck.
Unlock Deck
k this deck
24
A random sample of 30 students spent an average amount of $40.00 on a date, with a standard deviation of $5.00. The standard error of the sample mean is 0.913. Calculate an approximate 95% confidence interval for the average amount spent by all students on a date.
A) (40.00, 90.00)
B) (79.10, 80.90)
C) (78.20, 81.80)
D) None of the above
A) (40.00, 90.00)
B) (79.10, 80.90)
C) (78.20, 81.80)
D) None of the above
Unlock Deck
Unlock for access to all 103 flashcards in this deck.
Unlock Deck
k this deck
25
The cholesterol levels of a random sample of 100 men are measured. The sample mean is 188 and the sample standard deviation is 40. Which of the following provides a 95% confidence interval for the population mean?
A) 188 (1.98)(0.4)
B) 188 (1.98)(4)
C) 188 (1.98)(40)
D) 188 (1.98)(4000)
A) 188 (1.98)(0.4)
B) 188 (1.98)(4)
C) 188 (1.98)(40)
D) 188 (1.98)(4000)
Unlock Deck
Unlock for access to all 103 flashcards in this deck.
Unlock Deck
k this deck
26
A random sample of 30 airline flights during a storm had a mean delay of 40 minutes. The standard deviation was 5 minutes, and the standard error of the mean is 0.9129. Calculate a 90% confidence interval for the average delay for all flights during a storm.
A) (38.2, 41.8)
B) (38.4, 41.6)
C) (31.5, 48.5)
D) None of the above
A) (38.2, 41.8)
B) (38.4, 41.6)
C) (31.5, 48.5)
D) None of the above
Unlock Deck
Unlock for access to all 103 flashcards in this deck.
Unlock Deck
k this deck
27
A random sample of 30 airline flights during a storm had an average delay of 40 minutes. The standard deviation was 5 minutes. Calculate a 98% confidence interval for the average delay for all flights during a storm.
A) (37.8, 42.2)
B) (38.2, 41.8)
C) (27.7, 52.3)
D) None of the above
A) (37.8, 42.2)
B) (38.2, 41.8)
C) (27.7, 52.3)
D) None of the above
Unlock Deck
Unlock for access to all 103 flashcards in this deck.
Unlock Deck
k this deck
28
A randomly selected sample of n = 51 men in Brazil had an average lifespan of 59 years. The standard deviation was 10 years, and the standard error of the mean is 1.400. Calculate a 90% confidence interval for the average lifespan for all men in Brazil.
A) (42.2, 75.8)
B) (56.6, 61.4)
C) (56.2, 61.8)
D) None of the above
A) (42.2, 75.8)
B) (56.6, 61.4)
C) (56.2, 61.8)
D) None of the above
Unlock Deck
Unlock for access to all 103 flashcards in this deck.
Unlock Deck
k this deck
29
A randomly selected sample of n =51 men in Brazil had an average lifespan of 59 years. The standard deviation was 10 years. Calculate a 98% confidence interval for the average lifespan for all men in Brazil.
A) (55.6, 62.4)
B) (56.2, 61.8)
C) (35.0, 83.0)
D) None of the above
A) (55.6, 62.4)
B) (56.2, 61.8)
C) (35.0, 83.0)
D) None of the above
Unlock Deck
Unlock for access to all 103 flashcards in this deck.
Unlock Deck
k this deck
30
A random sample of 25 third graders scored an average of 3.2 on a standardized reading test. The standard deviation was 0.95. Calculate a 99% confidence interval for the mean score on this test.
A) (3.01, 3.39)
B) (2.49, 3.91)
C) (2.81, 3.59)
D) None of the above
A) (3.01, 3.39)
B) (2.49, 3.91)
C) (2.81, 3.59)
D) None of the above
Unlock Deck
Unlock for access to all 103 flashcards in this deck.
Unlock Deck
k this deck
31
Use the following information for questions:
For a random sample of n = 203 adults in a survey, here is a summary of responses to "How long did you sleep last night?"
-Based on the output, what value estimates, roughly, the average difference that would be found between the sample mean and the population mean ? in repeated samples of this size?
A)
B) 6.42
C) 1.56
D) 0.11
Unlock Deck
Unlock for access to all 103 flashcards in this deck.
Unlock Deck
k this deck
32
Use the following information for questions:
For a random sample of n = 203 adults in a survey, here is a summary of responses to "How long did you sleep last night?"
-Which of the following provides an approximate 95% confidence interval for the mean hours of sleep the previous night in the population represented by the sample?
A) 6.42 2×0.11
B) 6.42 2×
C) 6.42 0.11
D) 6.42 2×1.56
Unlock Deck
Unlock for access to all 103 flashcards in this deck.
Unlock Deck
k this deck
33
Use the following information for questions:
For a random sample of n = 203 adults in a survey, here is a summary of responses to "How long did you sleep last night?"
-What confidence level would be associated with the interval 6.42 - 0.11 as a confidence interval for the population mean ?
A) 50%
B) 68%
C) 90%
D) 95%
For a random sample of n = 203 adults in a survey, here is a summary of responses to "How long did you sleep last night?"
-What confidence level would be associated with the interval 6.42 - 0.11 as a confidence interval for the population mean ?
A) 50%
B) 68%
C) 90%
D) 95%
Unlock Deck
Unlock for access to all 103 flashcards in this deck.
Unlock Deck
k this deck
34
Use the following information for questions:
Spatial perception is measured on a scale from 0 to 10. Two groups of 8th grade children are tested for spatial perception. The students in group 1 were first given a short course on spatial concepts. The students in group 2 received no such instruction. SPSS was used to calculate descriptive statistics for the two samples.
-What is the value of the standard deviation for measurements made on the group 1 students, which is missing in the output?
A) 1.732
B) 3.807
C) 1.269
D) 0.141
Unlock Deck
Unlock for access to all 103 flashcards in this deck.
Unlock Deck
k this deck
35
Use the following information for questions:
Spatial perception is measured on a scale from 0 to 10. Two groups of 8th grade children are tested for spatial perception. The students in group 1 were first given a short course on spatial concepts. The students in group 2 received no such instruction. SPSS was used to calculate descriptive statistics for the two samples.
-Calculate a 95% confidence interval for the mean spatial perception score for students with instruction.
A) (6.47, 7.31)
B) (5.91, 7.87)
C) (6.04, 7.74)
D) None of the above
Unlock Deck
Unlock for access to all 103 flashcards in this deck.
Unlock Deck
k this deck
36
Use the following information for questions:
Spatial perception is measured on a scale from 0 to 10. Two groups of 8th grade children are tested for spatial perception. The students in group 1 were first given a short course on spatial concepts. The students in group 2 received no such instruction. SPSS was used to calculate descriptive statistics for the two samples.
-Calculate a 90% confidence interval for the mean spatial perception score for students without instruction.
A) (4.75, 5.91)
B) (4.00, 6.66)
C) (4.26, 6.40)
D) (4.18, 6.48)
Unlock Deck
Unlock for access to all 103 flashcards in this deck.
Unlock Deck
k this deck
37
Explain what is wrong with the following statement: A t-interval is a confidence interval estimate of a sample mean.
Unlock Deck
Unlock for access to all 103 flashcards in this deck.
Unlock Deck
k this deck
38
In a random sample of 100 students (60 women and 40 men), the average hours of sleep during finals week were compared. Are the samples of men and women independent samples or paired samples?
Unlock Deck
Unlock for access to all 103 flashcards in this deck.
Unlock Deck
k this deck
39
In a random sample of 100 students, the change in hours of sleep for each student during and after finals week were compared. Are the samples of students' sleep during finals and after finals independent samples or paired samples?
Unlock Deck
Unlock for access to all 103 flashcards in this deck.
Unlock Deck
k this deck
40
Use the following information for questions:
Based on a random sample of 41 flights, the average minutes of airborne time for an airline was 106 minutes, with a standard deviation of 5 minutes.
-What is the standard error for the average airborne time?
Based on a random sample of 41 flights, the average minutes of airborne time for an airline was 106 minutes, with a standard deviation of 5 minutes.
-What is the standard error for the average airborne time?
Unlock Deck
Unlock for access to all 103 flashcards in this deck.
Unlock Deck
k this deck
41
Use the following information for questions:
Based on a random sample of 41 flights, the average minutes of airborne time for an airline was 106 minutes, with a standard deviation of 5 minutes.
-Give a 90% confidence interval for the average airborne time for this airline.
Based on a random sample of 41 flights, the average minutes of airborne time for an airline was 106 minutes, with a standard deviation of 5 minutes.
-Give a 90% confidence interval for the average airborne time for this airline.
Unlock Deck
Unlock for access to all 103 flashcards in this deck.
Unlock Deck
k this deck
42
Use the following information for questions:
Based on a random sample of 41 flights, the average minutes of airborne time for an airline was 106 minutes, with a standard deviation of 5 minutes.
-Would a 95% confidence interval for the average airborne time for this airline be wider or narrower than the 90% confidence interval?
Based on a random sample of 41 flights, the average minutes of airborne time for an airline was 106 minutes, with a standard deviation of 5 minutes.
-Would a 95% confidence interval for the average airborne time for this airline be wider or narrower than the 90% confidence interval?
Unlock Deck
Unlock for access to all 103 flashcards in this deck.
Unlock Deck
k this deck
43
Use the following information for questions:
Refer to the following statistical summary of the left foot lengths (in centimeters) for a random sample of 76 college men.
-In terms of the notation of this course, what is the correct way to express the "Mean" shown in the output?
Refer to the following statistical summary of the left foot lengths (in centimeters) for a random sample of 76 college men.
-In terms of the notation of this course, what is the correct way to express the "Mean" shown in the output?
Unlock Deck
Unlock for access to all 103 flashcards in this deck.
Unlock Deck
k this deck
44
Use the following information for questions:
Refer to the following statistical summary of the left foot lengths (in centimeters) for a random sample of 76 college men.
-Complete the following sentence: In about 95% of all samples of this size from this population, the difference between the sample mean and the population mean would be ____.
Refer to the following statistical summary of the left foot lengths (in centimeters) for a random sample of 76 college men.
-Complete the following sentence: In about 95% of all samples of this size from this population, the difference between the sample mean and the population mean would be ____.
Unlock Deck
Unlock for access to all 103 flashcards in this deck.
Unlock Deck
k this deck
45
Use the following information for questions:
Refer to the following statistical summary of the left foot lengths (in centimeters) for a random sample of 76 college men.
-Give an approximate 95% confidence interval for the average left foot length for college men.
Refer to the following statistical summary of the left foot lengths (in centimeters) for a random sample of 76 college men.
-Give an approximate 95% confidence interval for the average left foot length for college men.
Unlock Deck
Unlock for access to all 103 flashcards in this deck.
Unlock Deck
k this deck
46
Use the following information for questions:
Spatial perception is measured on a scale from 0 to 10. A group of 9th grade students are tested for spatial perception. SPSS was used to calculate descriptive statistics of the spatial perception scores in the sample.
-In terms of the notation of this course, what is the correct way to express the value 0.428 in the output?
Unlock Deck
Unlock for access to all 103 flashcards in this deck.
Unlock Deck
k this deck
47
Use the following information for questions:
Spatial perception is measured on a scale from 0 to 10. A group of 9th grade students are tested for spatial perception. SPSS was used to calculate descriptive statistics of the spatial perception scores in the sample.
-Explain in your own words what the value 0.428 in the output measures.
Spatial perception is measured on a scale from 0 to 10. A group of 9th grade students are tested for spatial perception. SPSS was used to calculate descriptive statistics of the spatial perception scores in the sample.
-Explain in your own words what the value 0.428 in the output measures.
Unlock Deck
Unlock for access to all 103 flashcards in this deck.
Unlock Deck
k this deck
48
Use the following information for questions:
Spatial perception is measured on a scale from 0 to 10. A group of 9th grade students are tested for spatial perception. SPSS was used to calculate descriptive statistics of the spatial perception scores in the sample.
-Give a 90% confidence interval for the average spatial perception score for all 9th graders.
Unlock Deck
Unlock for access to all 103 flashcards in this deck.
Unlock Deck
k this deck
49
Which of the following studies describes a paired data design?
A) The testosterone levels of male doctors and male college professors are compared
B) 40 students measure their blood pressure twice--first while resting and then again after running in place for 10 minutes.
C) The mean blood pressure of men is compared to the mean blood pressure of women
D) All of choices A, B, and C involve paired data.
Unlock Deck
Unlock for access to all 103 flashcards in this deck.
Unlock Deck
k this deck
50
Which of the following examples involves paired data?
A) A psychologist compares two methods of memorizing information. Twenty people use one method and twenty other people use the second method.
B) A researcher estimates the difference between the mean forearm lengths of men and women based on a random sample of each.
C) A medical researcher measures the cholesterol levels of each of 30 heart attack patients 2 days after the attack and again 4 days after the attack.
D) A marketing research expert estimates the proportion of the 22 to 29 year-old age group that says they might buy a new car in the next two years
Unlock Deck
Unlock for access to all 103 flashcards in this deck.
Unlock Deck
k this deck
51
Which one of the following ways of collecting data would not result in paired data?
A) Each person is measured twice.
B) Similar individuals are paired prior to an experiment. Each individual in a pair receives a different treatment.
C) Two different variables are measured for each person.
D) Two independent samples are selected and the same response variable is compared between samples.
Unlock Deck
Unlock for access to all 103 flashcards in this deck.
Unlock Deck
k this deck
52
The multiplier for a confidence interval for one mean or the mean of paired differences depends on
A) The confidence level only.
B) The degrees of freedom only.
C) The confidence level and the degrees of freedom.
D) The confidence level and the sample standard deviation.
A) The confidence level only.
B) The degrees of freedom only.
C) The confidence level and the degrees of freedom.
D) The confidence level and the sample standard deviation.
Unlock Deck
Unlock for access to all 103 flashcards in this deck.
Unlock Deck
k this deck
53
The amount of time the husband and the wife spend on house work is measured for 15 women and their 15 husbands. What are the appropriate degrees of freedom for the multiplier t* for a confidence interval for the difference in mean time spent on housework between husbands and wives?
A) 14
B) 15
C) 29
D) 30
A) 14
B) 15
C) 29
D) 30
Unlock Deck
Unlock for access to all 103 flashcards in this deck.
Unlock Deck
k this deck
54
The head circumference is measured for 25 girls and their twin sisters. What is the value of the multiplier t* for a 90% confidence interval for the difference in mean head circumference between girl twins?
A) 1.68
B) 2.02
C) 1.71
D) 2.06
A) 1.68
B) 2.02
C) 1.71
D) 2.06
Unlock Deck
Unlock for access to all 103 flashcards in this deck.
Unlock Deck
k this deck
55
Use the following information for questions:
An experiment is conducted with 15 seniors who are taking Spanish at Oak View High School. A randomly selected group of eight students is first tested with a written test and a day later with an oral exam. To avoid order effects, the other seven students are tested in reverse order. The instructor is interested in the difference in grades between the two testing methods. SPSS is used to obtain descriptive statistics for the grades of the two tests.
-What are the degrees of freedom for this design?
A) 7
B) 8
C) 14
D) 29
Unlock Deck
Unlock for access to all 103 flashcards in this deck.
Unlock Deck
k this deck
56
Use the following information for questions:
An experiment is conducted with 15 seniors who are taking Spanish at Oak View High School. A randomly selected group of eight students is first tested with a written test and a day later with an oral exam. To avoid order effects, the other seven students are tested in reverse order. The instructor is interested in the difference in grades between the two testing methods. SPSS is used to obtain descriptive statistics for the grades of the two tests.
-What is the value of the standard error for the difference in mean grades between the two testing methods?
A) 0.395
B) 0.529
C) 0.563
D) 0.660
Unlock Deck
Unlock for access to all 103 flashcards in this deck.
Unlock Deck
k this deck
57
Use the following information for questions:
An experiment is conducted with 15 seniors who are taking Spanish at Oak View High School. A randomly selected group of eight students is first tested with a written test and a day later with an oral exam. To avoid order effects, the other seven students are tested in reverse order. The instructor is interested in the difference in grades between the two testing methods. SPSS is used to obtain descriptive statistics for the grades of the two tests.
-Calculate a 98% confidence interval for the difference in mean grades between the two testing methods.
A) (-3.85, -1.44)
B) (-4.03, -1.26)
C) (-4.12, -1.17)
D) (-4.33, -0.95)
Unlock Deck
Unlock for access to all 103 flashcards in this deck.
Unlock Deck
k this deck
58
Use the following information for questions:
"Sunlight makes everyone feel better." To test this claim, 30 college students receive special lights for their bedrooms that slowly turn on in the morning with imitation sunlight. The experiment takes place in January, when it is still dark out in the morning. Prior to participation, the students fill out a questionnaire to measure their general mood. The average score was 2.73. After three weeks with the special light they fill in the questionnaire again. The average score this time was 3.13. The standard deviation of the differences was 0.822.
-What is the value of the standard error for the difference in average mood score?
A) 0.106
B) 0.150
C) 0.153
D) 0.822
Unlock Deck
Unlock for access to all 103 flashcards in this deck.
Unlock Deck
k this deck
59
Use the following information for questions:
"Sunlight makes everyone feel better." To test this claim, 30 college students receive special lights for their bedrooms that slowly turn on in the morning with imitation sunlight. The experiment takes place in January, when it is still dark out in the morning. Prior to participation, the students fill out a questionnaire to measure their general mood. The average score was 2.73. After three weeks with the special light they fill in the questionnaire again. The average score this time was 3.13. The standard deviation of the differences was 0.822.
-Calculate a 95% confidence interval for the difference in average mood scores (after - before).
A) (0.14, 0.66)
B) (0.09, 0.71)
C) (0.19, 0.61)
D) None of the above
Unlock Deck
Unlock for access to all 103 flashcards in this deck.
Unlock Deck
k this deck
60
Use the following information for questions:
A manufacturer of cell phones is interested in evaluating two alternative existing layout and flow path designs. Design 1 is the current one in use and Design 2 is a new proposed plan. Both designs were implemented for eight consecutive working days and the output of each design was recorded.
-What are the degrees of freedom for this paired design analysis?
A) 8 (since there are eight days).
B) 16 (since there are 16 observations in all).
C) 15
D) 7
Unlock Deck
Unlock for access to all 103 flashcards in this deck.
Unlock Deck
k this deck
61
Use the following information for questions:
A manufacturer of cell phones is interested in evaluating two alternative existing layout and flow path designs. Design 1 is the current one in use and Design 2 is a new proposed plan. Both designs were implemented for eight consecutive working days and the output of each design was recorded.
-Suppose the sample mean difference in output (Design 2 - Design 1) was -174 phones and the standard error of the mean difference was 28. What is the 95% confidence interval for the population mean difference in output?
A) -174 2.36×28
B) -174 2.36×
C) -174 28
D) -174 0.95×28
Unlock Deck
Unlock for access to all 103 flashcards in this deck.
Unlock Deck
k this deck
62
Use the following information for questions:
A manufacturer of cell phones is interested in evaluating two alternative existing layout and flow path designs. Design 1 is the current one in use and Design 2 is a new proposed plan. Both designs were implemented for eight consecutive working days and the output of each design was recorded.
-How would a 90% confidence interval for the mean difference in output compare to the 95% confidence interval?
A) It would be wider.
B) It would be narrower.
C) It would stay the same.
D) You cannot tell until you look up the multiplier value.
Unlock Deck
Unlock for access to all 103 flashcards in this deck.
Unlock Deck
k this deck
63
Use the following information for questions:
Managerial training programs often teach supervisory skills. Are these training programs effective? A company psychologist administers a test to each of 10 supervisors before and after attending such a training program. Higher scores indicate increased supervisory skills. The results are used to estimate the mean improvement in supervisory skills.
-Explain why this is a paired data design.
Unlock Deck
Unlock for access to all 103 flashcards in this deck.
Unlock Deck
k this deck
64
Use the following information for questions:
Managerial training programs often teach supervisory skills. Are these training programs effective? A company psychologist administers a test to each of 10 supervisors before and after attending such a training program. Higher scores indicate increased supervisory skills. The results are used to estimate the mean improvement in supervisory skills.
-Suppose the mean improvement in supervisory skills was 3 point and the standard deviation of the sampled differences was 2 points. Give the standard error of the sample mean difference.
Unlock Deck
Unlock for access to all 103 flashcards in this deck.
Unlock Deck
k this deck
65
Use the following information for questions:
Managerial training programs often teach supervisory skills. Are these training programs effective? A company psychologist administers a test to each of 10 supervisors before and after attending such a training program. Higher scores indicate increased supervisory skills. The results are used to estimate the mean improvement in supervisory skills.
-Give a 95% confidence interval for the population mean improvement in supervisory skills for all supervisors who take the training program.
Unlock Deck
Unlock for access to all 103 flashcards in this deck.
Unlock Deck
k this deck
66
Use the following information for questions:
Managerial training programs often teach supervisory skills. Are these training programs effective? A company psychologist administers a test to each of 10 supervisors before and after attending such a training program. Higher scores indicate increased supervisory skills. The results are used to estimate the mean improvement in supervisory skills.
-Does it appear that the training program is effective? Explain how you came to your decision.
Unlock Deck
Unlock for access to all 103 flashcards in this deck.
Unlock Deck
k this deck
67
When constructing a confidence interval for the difference in two population means, it is appropriate to use the pooled standard error only when
A) the population standard deviations can be assumed to be equal.
B) the sample standard deviations are exactly equal.
C) the population means can be assumed to be equal.
D) the sample means are exactly equal.
A) the population standard deviations can be assumed to be equal.
B) the sample standard deviations are exactly equal.
C) the population means can be assumed to be equal.
D) the sample means are exactly equal.
Unlock Deck
Unlock for access to all 103 flashcards in this deck.
Unlock Deck
k this deck
68
Which one of the following ways of collecting data would result in two independent samples?
A) A sample of college students is measured for stress both before and after taking an important exam.
B) A group of college students are paired based on gender, age, major, and grades. One student in a pair receives stress management training and the other one does not. After a few weeks all students are measured for stress right before an important exam.
C) A sample of English majors is measured for stress before taking an important exam. A sample of engineering majors is also measured for stress before taking their important exam.
D) A sample of college students is measured for stress before taking an important exam. Their exam grade is also recorded.
Unlock Deck
Unlock for access to all 103 flashcards in this deck.
Unlock Deck
k this deck
69
The amount of time single men and women spend on house work is measured for 15 single women and 20 single men. What are the appropriate degrees of freedom for the multiplier t* for a pooled confidence interval for the difference in mean time spent on housework between single men and women?
A) 14
B) 19
C) 33
D) 35
A) 14
B) 19
C) 33
D) 35
Unlock Deck
Unlock for access to all 103 flashcards in this deck.
Unlock Deck
k this deck
70
The head circumference is measured for a sample of 15 girls and a separate sample of 15 boys. What is the correct combination of degrees of freedom and the value of the multiplier t* for a 90% confidence interval for the difference in mean head circumference between girls and boys?
A) df = 13, t* = 1.77
B) df = 28, t* = 1.70
C) df = 28, t* = 2.05
D) df = 30, t* = 1.70
A) df = 13, t* = 1.77
B) df = 28, t* = 1.70
C) df = 28, t* = 2.05
D) df = 30, t* = 1.70
Unlock Deck
Unlock for access to all 103 flashcards in this deck.
Unlock Deck
k this deck
71
The amount of time single men and women spend on house work is measured for 15 single women and 25 single men. For the women the mean was 7 hours/week with a standard deviation of 1.5. For the men the mean was 4.5 hours/week with a standard deviation of 1.1. What is the value of the pooled standard deviation for the difference in mean time spent on housework between single men and women?
A) 1.30
B) 0.45
C) 1.59
D) 1.26
A) 1.30
B) 0.45
C) 1.59
D) 1.26
Unlock Deck
Unlock for access to all 103 flashcards in this deck.
Unlock Deck
k this deck
72
The head circumference is measured for a sample of 17 girls and a separate sample of 12 boys. The mean for the girls was 49 cm with a standard deviation of 1.25 cm. The mean for the boys was 50 cm with a standard deviation of 0.95 cm. What is the value of the pooled standard error for the difference in mean head circumference between girls and boys?
A) 0.41
B) 1.29
C) 0.43
D) 1.14
A) 0.41
B) 1.29
C) 0.43
D) 1.14
Unlock Deck
Unlock for access to all 103 flashcards in this deck.
Unlock Deck
k this deck
73
A random sample of 60 mathematics majors spent an average of $200.00 for textbooks for a term, with a standard deviation of $22.50. A random sample of 40 English majors spent an average of $180.00 for textbooks that term, with a standard deviation of $18.30. What is the value of the pooled standard error for the difference in mean amount spent?
A) 20.93
B) 4.27
C) 16.81
D) 4.10
A) 20.93
B) 4.27
C) 16.81
D) 4.10
Unlock Deck
Unlock for access to all 103 flashcards in this deck.
Unlock Deck
k this deck
74
Random samples of 200 men and 200 women were collected and their resting pulse rates were measured, to estimate how much mean resting pulse rates differ for men and women in the population. An analyst mistakenly paired the observations and constructed an approximate 95% confidence interval for the mean difference to be (5 2×0.2) beats per minute. If the data had been analyzed correctly, finding an approximate 95% confidence interval for the difference in population means, which of the following parts of the interval would be different?
A) The sample statistic of 5 beats per minute.
B) The multiplier of 2.
C) The standard error of 0.2.
D) None of the parts would be different; it is an equivalent analysis.
A) The sample statistic of 5 beats per minute.
B) The multiplier of 2.
C) The standard error of 0.2.
D) None of the parts would be different; it is an equivalent analysis.
Unlock Deck
Unlock for access to all 103 flashcards in this deck.
Unlock Deck
k this deck
75
A researcher asked random samples of 50 kindergarten teachers and 50 12th grade teachers how much money they spent out-of-pocket on school supplies in the previous school year, to see if teachers at one grade level spend more than the other. A 95% confidence interval for K- 12 is $30 to $50. Based on this result, it is reasonable to conclude that
A) 95% of all kindergarten and 12th grade teachers spend between $30 and $50 on average.
B) 95% of all kindergarten teachers spend between $30 and $50 more then 95% of all 12th grade teachers.
C) kindergarten teachers spend more on average than do 12th grade teachers.
D) 12th grade teachers spend more on average than do kindergarten teachers.
Unlock Deck
Unlock for access to all 103 flashcards in this deck.
Unlock Deck
k this deck
76
A 95% confidence interval for the difference between the mean handspans of men and the mean handspans of women is determined to be 2.7 centimeters to 3.3 centimeters. Which of the following statements is the best interpretation of this interval?
A) It is likely that the difference in the population mean handspans of men and women is covered by the interval 2.7 centimeters to 3.3 centimeters.
B) It is likely that the difference in the sample mean handspans of men and women is covered by the interval 2.7 centimeters to 3.3 centimeters.
C) It is likely that if new samples of the same size were to be taken, the difference in sample means would be contained in the interval 2.7 centimeters to 3.3 centimeters.
D) It is likely that for 95% of married couples, the husband's handspan is between 2.7 and 3.3 centimeters longer than the wife's hand span.
Unlock Deck
Unlock for access to all 103 flashcards in this deck.
Unlock Deck
k this deck
77
A random sample of 60 mathematics majors spent an average of $200.00 for textbooks for a term, while a random sample of 40 literature majors spent an average of $180.00 for textbooks that term. The standard deviation for each sample was $20.00. The standard error for the difference between the two sample means is 4.082. Calculate an approximate 95% confidence interval for the difference in average amounts spent on textbooks (math majors - literature majors).
A) (7.8, 32.2)
B) (11.8, 28.2)
C) (15.9, 24.1)
D) None of the above
A) (7.8, 32.2)
B) (11.8, 28.2)
C) (15.9, 24.1)
D) None of the above
Unlock Deck
Unlock for access to all 103 flashcards in this deck.
Unlock Deck
k this deck
78
A random sample of 40 men drank an average of 20 cups of coffee per week during finals, while a sample of 30 women drank an average of 15 cups of coffee per week. The sample standard deviations were 6 cups for the men and 3 cups for the women. The standard error for the difference between the two sample means is 1.095. Calculate an approximate 95% confidence interval for the difference in average cups of coffee drunk (men -women).
A) (2.81, 7.19)
B) (3.02, 6.98)
C) (3.91, 6.10)
D) None of the above
A) (2.81, 7.19)
B) (3.02, 6.98)
C) (3.91, 6.10)
D) None of the above
Unlock Deck
Unlock for access to all 103 flashcards in this deck.
Unlock Deck
k this deck
79
A random sample of 60 mathematics majors spent an average of $200.00 for textbooks for a term, with a standard deviation of $22.50. A random sample of 40 English majors spent an average of $180.00 for textbooks that term, with a standard deviation of $18.30. Calculate a 90% pooled confidence interval for the difference in average amounts spent on textbooks (math majors - English majors).
A) (12.91, 27.09)
B) (11.50, 28.50)
C) (13.19, 26.81)
D) None of the above
A) (12.91, 27.09)
B) (11.50, 28.50)
C) (13.19, 26.81)
D) None of the above
Unlock Deck
Unlock for access to all 103 flashcards in this deck.
Unlock Deck
k this deck
80
An experiment is conducted with two groups of 25 college students. The treatment group scored an average of 3.67 with a standard deviation of 0.86. The placebo group scored an average of 3.29 with a standard deviation of 0.97. Calculate a 95% pooled confidence interval for the difference in means between the treatment and the placebo.
A) (-0.44, 0.82)
B) (-0.14, 0.90)
C) (-0.25, 1.01)
D) None of the above
A) (-0.44, 0.82)
B) (-0.14, 0.90)
C) (-0.25, 1.01)
D) None of the above
Unlock Deck
Unlock for access to all 103 flashcards in this deck.
Unlock Deck
k this deck
Unlock Deck
Unlock for access to all 103 flashcards in this deck.


