Deck 1: Statistics Success Stories and Cautionary Tales
Full screen (f)
Question
Question
Question
Question
Question
Question
Question
Question
Question
Question
Question
Question
Question
Question
Question
Question
Question
Question
Question
Question
Question
Question
Question
Question
Question
Question
Question
Question
Question
Question
Question
Question
Question
Question
Question
Question
Question
Question
Question
Question
Question
Question
Question
Question
Question
Use the following information for questions:
In a 1994 Census Bureau report, the total number of households and the number of households with a married couple and their own children were reported for the years 1990 and for 1994. The results are given below:
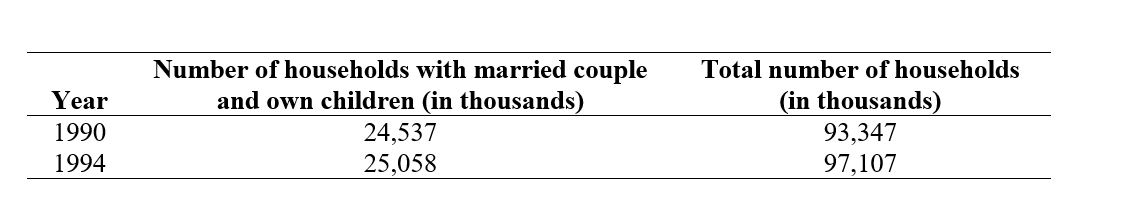 One newspaper reported these results with the following headline: "Number of Two-Parent Families Up." Another newspaper, based on the percentages, reported on the same results with the headline: "Traditional Families Less Common".
-In 1990, what percentage of households consisted of a married couple with children?
In a 1994 Census Bureau report, the total number of households and the number of households with a married couple and their own children were reported for the years 1990 and for 1994. The results are given below:
One newspaper reported these results with the following headline: "Number of Two-Parent Families Up." Another newspaper, based on the percentages, reported on the same results with the headline: "Traditional Families Less Common".-In 1990, what percentage of households consisted of a married couple with children?
Question
Use the following information for questions:
In a 1994 Census Bureau report, the total number of households and the number of households with a married couple and their own children were reported for the years 1990 and for 1994. The results are given below:
One newspaper reported these results with the following headline: "Number of Two-Parent Families Up." Another newspaper, based on the percentages, reported on the same results with the headline: "Traditional Families Less Common".
-In 1994, what percentage of households consisted of a married couple with children?
In a 1994 Census Bureau report, the total number of households and the number of households with a married couple and their own children were reported for the years 1990 and for 1994. The results are given below:
One newspaper reported these results with the following headline: "Number of Two-Parent Families Up." Another newspaper, based on the percentages, reported on the same results with the headline: "Traditional Families Less Common".-In 1994, what percentage of households consisted of a married couple with children?
Question
Use the following information for questions:
In a 1994 Census Bureau report, the total number of households and the number of households with a married couple and their own children were reported for the years 1990 and for 1994. The results are given below:
One newspaper reported these results with the following headline: "Number of Two-Parent Families Up." Another newspaper, based on the percentages, reported on the same results with the headline: "Traditional Families Less Common".
-Both newspapers reported correct figures; explain why it was possible for them to come to opposite conclusions. Which conclusion do you think is more descriptive of the trend?
In a 1994 Census Bureau report, the total number of households and the number of households with a married couple and their own children were reported for the years 1990 and for 1994. The results are given below:
One newspaper reported these results with the following headline: "Number of Two-Parent Families Up." Another newspaper, based on the percentages, reported on the same results with the headline: "Traditional Families Less Common".-Both newspapers reported correct figures; explain why it was possible for them to come to opposite conclusions. Which conclusion do you think is more descriptive of the trend?
Question
Use the following information for questions:
The results of 2,475 people on trial for murder are shown below by the race of the victim (black or white) and the verdict (death penalty yes or no). These results were used in a Supreme Court trial on behalf of a defendant.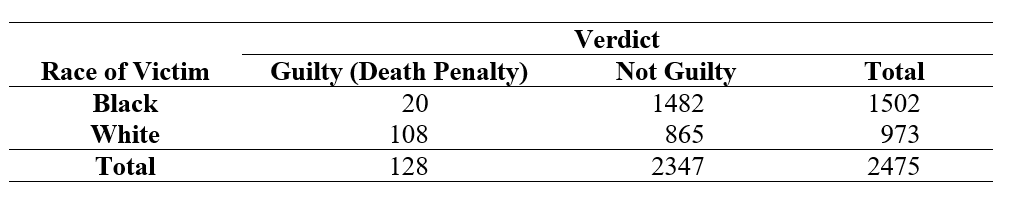
-Calculate the percentage of death penalties for cases where the race of the victim was white, and the percentage where the race of the victim was black.
Question
Use the following information for questions:
The results of 2,475 people on trial for murder are shown below by the race of the victim (black or white) and the verdict (death penalty yes or no). These results were used in a Supreme Court trial on behalf of a defendant.
-What are some confounding variables that might also explain the observed difference in percentages of death penalties for cases where the victim was white versus black?
Question
Question
Question
Drawn below are two dotplots displaying the heights (in inches) of 94 females and 77 males. Also given are the 5 number summaries. Describe any differences or similarities between the two sets of data. 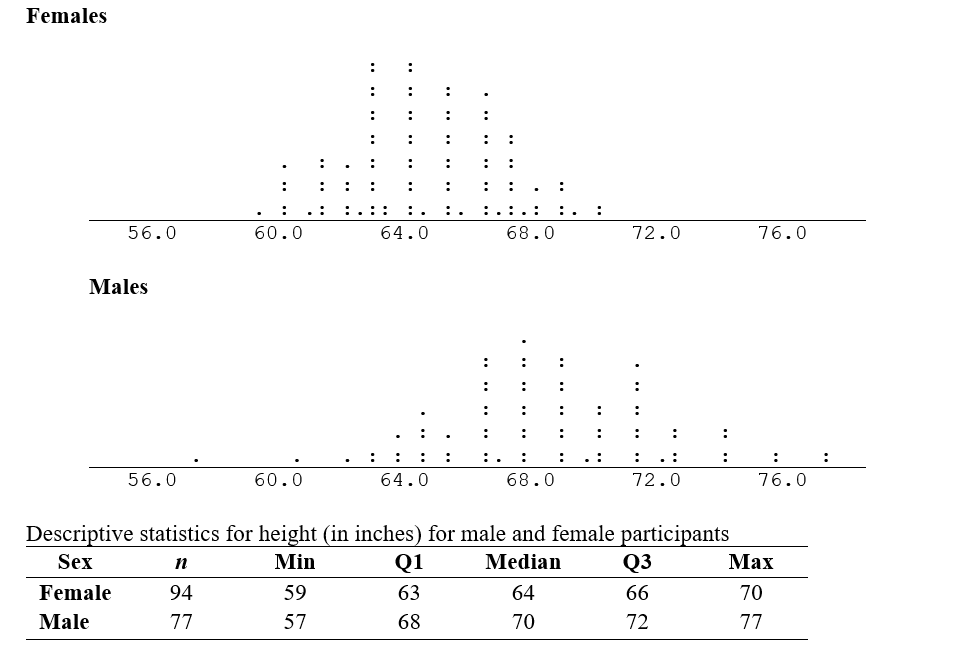
Question
Drawn below are two dotplots displaying the number of letters that could be written in 15 seconds among 63 students using their dominant hand and then using their non-dominant hand. Also given are the 5 number summaries. Describe any differences or similarities between the two sets of data. 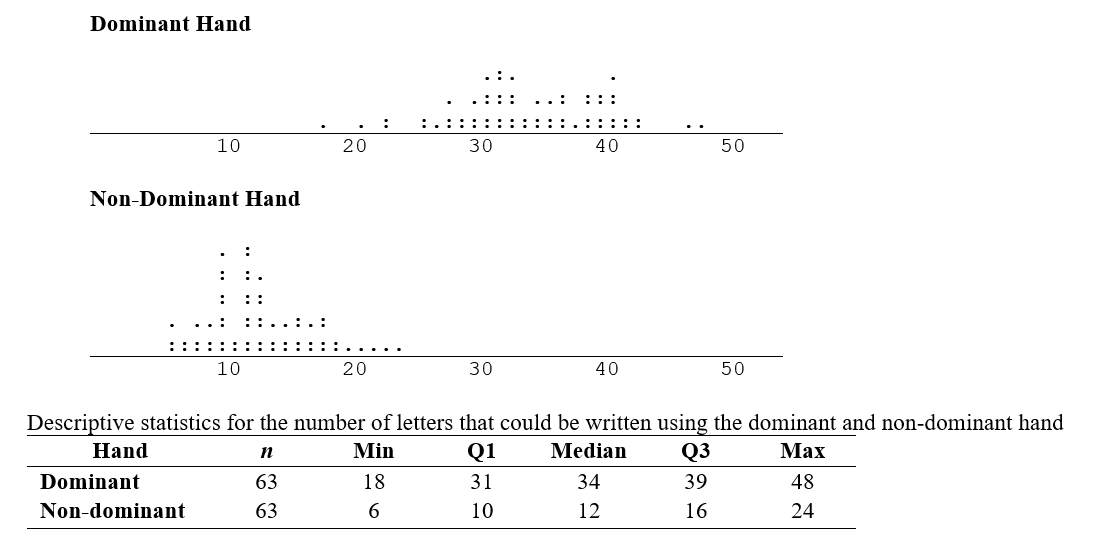
Question
Drawn below are two dotplots displaying the number of minutes spent talking on the telephone during a typical week for 36 female and 39 male students at Penn State University. Also given are the five number summaries. Describe any differences or similarities between the two sets of data. 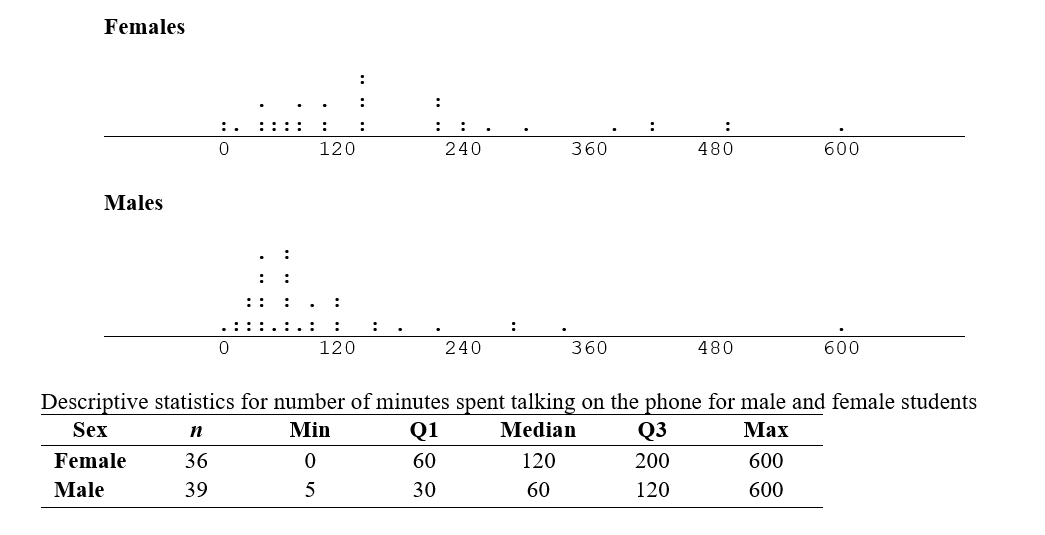
Question
Drawn below are two dotplots displaying the number of minutes spent exercising during a typical week for 36 female and 39 male students at Penn State University. Also given are the five number summaries. Describe any differences or similarities between the two sets of data. 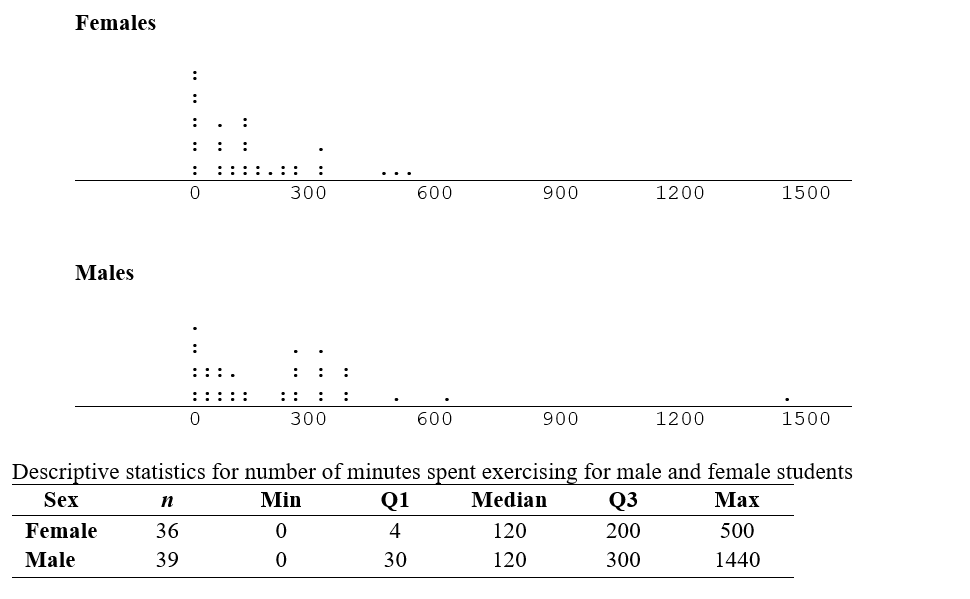
Question
Drawn below are two dotplots displaying the dollar amount spent on textbooks for one semester for 36 female and 39 male students at Penn State University. Also given are the five number summaries. Describe any differences or similarities between the two sets of data. 
Question
Question
Question
Question
Question
Question
Question
Question
Question
Question
Question
Question
Use the following information for questions:
The table below shows the results of a survey of students who took college prep courses who were asked to rate their high school education.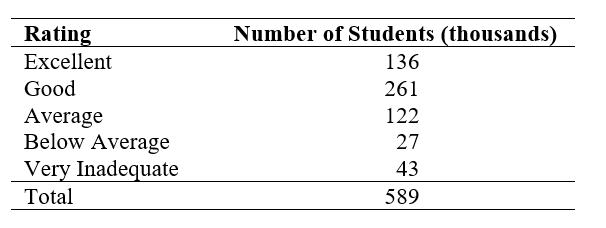
-Calculate the percentage of students who gave an excellent rating to their high schools.
The table below shows the results of a survey of students who took college prep courses who were asked to rate their high school education.
-Calculate the percentage of students who gave an excellent rating to their high schools.
Question
Use the following information for questions:
The table below shows the results of a survey of students who took college prep courses who were asked to rate their high school education.
-Calculate the percentage of students who gave a good rating to their high schools.
The table below shows the results of a survey of students who took college prep courses who were asked to rate their high school education.
-Calculate the percentage of students who gave a good rating to their high schools.
Question
Question
Question
Question
Question
Question
Question
Question
Question
Question

Unlock Deck
Sign up to unlock the cards in this deck!
Unlock Deck
Unlock Deck
1/79
Play
Full screen (f)
Deck 1: Statistics Success Stories and Cautionary Tales
1
Use the following information for questions:
Suppose you were to read about a study showing that people who sleep less than five hours a night have twice as much risk of a premature death as people who sleep seven or eight hours a night.
-Can you conclude that sleeping the shorter hours causes a higher risk of premature death?
A) No, because the result was clearly based on an observational study.
B) Yes, because the result was clearly based on a randomized experiment.
C) The answer depends on whether the research was based on an observational study or a randomized experiment, and it isn't obvious which was used.
D) No, because the baseline risk of premature death is not given.
No, because the result was clearly based on an observational study.
2
Use the following information for questions:
Suppose you were to read about a study showing that people who sleep less than five hours a night have twice as much risk of a premature death as people who sleep seven or eight hours a night.
-The "baseline risk"in this context is
A) the risk of premature death for people who sleep less than five hours a night.
B) the risk of premature death for people who sleep seven or eight hours a night.
C) the risk of premature death for all people.
D) the risk of premature death at the beginning of the study for those in the study.
the risk of premature death for people who sleep seven or eight hours a night.
3
Use the following information for questions:
Suppose you were to read about a study showing that people who sleep less than five hours a night have twice as much risk of a premature death as people who sleep seven or eight hours a night.
-Which of the following is not an example of a possible "confounding variable"in this study?
A) Medications a person is taking.
B) The amount of alcohol a person drinks in the evening.
C) The amount of stress a person is under in their work.
D) The amount of sleep a person gets per night.
The amount of sleep a person gets per night.
4
A randomized experiment was done by randomly assigning each participant either to walk for half an hour three times a week or to sit quietly reading a book for half an hour three times a week. At the end of a year the change in participants' blood pressure over the year was measured, and the change was compared for the two groups.
-This is a randomized experiment rather than an observational study because
A) blood pressure was measured at the beginning and end of the study.
B) the two groups were compared at the end of the study.
C) the participants were randomly assigned to either walk or read, rather than choosing their own activity.
D) a random sample of participants was used.
Unlock Deck
Unlock for access to all 79 flashcards in this deck.
Unlock Deck
k this deck
5
A randomized experiment was done by randomly assigning each participant either to walk for half an hour three times a week or to sit quietly reading a book for half an hour three times a week. At the end of a year the change in participants' blood pressure over the year was measured, and the change was compared for the two groups.
-The two treatments in this study were
A) walking for half an hour three times a week and reading a book for half an hour three times a week.
B) having blood pressure measured at the beginning of the study and having blood pressure measured at the end of the study.
C) walking or reading a book for half an hour three times a week and having blood pressure measured.
D) walking or reading a book for half an hour three times a week and doing nothing.
Unlock Deck
Unlock for access to all 79 flashcards in this deck.
Unlock Deck
k this deck
6
A randomized experiment was done by randomly assigning each participant either to walk for half an hour three times a week or to sit quietly reading a book for half an hour three times a week. At the end of a year the change in participants' blood pressure over the year was measured, and the change was compared for the two groups.
-If a statistically significant difference in blood pressure change at the end of a year for the two activities was found, then
A) it cannot be concluded that the difference in activity caused a difference in the change in blood pressure because in the course of a year there are lots of possible confounding variables.
B) whether or not the difference was caused by the difference in activity depends on what else the participants did during the year.
C) it cannot be concluded that the difference in activity caused a difference in the change in blood pressure because it might be the opposite, that people with high blood pressure were more likely to read a book than to walk.
D) it can be concluded that the difference in activity caused a difference in the change in blood pressure.
Unlock Deck
Unlock for access to all 79 flashcards in this deck.
Unlock Deck
k this deck
7
Which of the following is not a component of "Statistics"as defined in Chapter 1?
A) Procedures and principles for gathering data
B) Procedures and principles for making decisions when faced with uncertainty
C) Procedures and principles for analyzing data and information
D) Procedures and principles for turning uncertainty into certainty
A) Procedures and principles for gathering data
B) Procedures and principles for making decisions when faced with uncertainty
C) Procedures and principles for analyzing data and information
D) Procedures and principles for turning uncertainty into certainty
Unlock Deck
Unlock for access to all 79 flashcards in this deck.
Unlock Deck
k this deck
8
Which of the following is true about a dotplot and a five-number summary?
A) A dotplot displays all of the individual responses while a five-number summary does not.
B) A five-number summary displays all of the individual responses while a dotplot does not.
C) Both a dotplot and a five-number summary display all of the individual responses.
D) Neither a dotplot nor a five-number summary displays all of the individual responses.
Unlock Deck
Unlock for access to all 79 flashcards in this deck.
Unlock Deck
k this deck
9
The five numbers in a five-number summary are the
A) lowest value, mean, median, mode, and the highest value.
B) lowest value, lower margin of error, median, upper margin of error, and the highest value.
C) lowest value, lower quartile, median, upper quartile, and the highest value.
D) lowest value, 2nd lowest value, middle value, 2nd highest value, and the highest value.
Unlock Deck
Unlock for access to all 79 flashcards in this deck.
Unlock Deck
k this deck
10
Student grade point averages (GPAs) are calculated by assigning a number to each letter grade earned, with A = 4, B = 3, C = 2, D = 1 and F = 0, then finding the average. A student proposes using the median of the numbers instead and calls this medGPA. A student has taken five courses (all an equal number of credit hours) and the grades were A, A, F, B, A. The usual GPA for these grades is 3.0. Should the student prefer using the median (medGPA)?
A) No, because medGPA is F = 0 for this student.
B) It doesn't matter, because medGPA is also B = 3.0 for this student.
C) Yes, because medGPA is A = 4.0 for this student.
D) No, because if the student takes one more course and gets an A or B, the usual GPA will go up but the medGPA will stay the same.
Unlock Deck
Unlock for access to all 79 flashcards in this deck.
Unlock Deck
k this deck
11
A pop quiz in a class resulted in the following eight quiz scores: 0, 60, 66, 78, 82, 96, 98, 100. The five-number summary for these test scores is
A) 0, 63, 80, 97, 100.
B) 66, 78, 82, 96, 98.
C) 0, 66, 82, 98, 100.
D) 0, 25, 50, 75, 100.
A) 0, 63, 80, 97, 100.
B) 66, 78, 82, 96, 98.
C) 0, 66, 82, 98, 100.
D) 0, 25, 50, 75, 100.
Unlock Deck
Unlock for access to all 79 flashcards in this deck.
Unlock Deck
k this deck
12
Which of the following is true about the use of sample surveys?
A) Everyone in the population must also be in the sample.
B) Data from people in the sample are used to gain information about the population.
C) Data from people in the population are used to gain information about the sample.
D) The population is a subset of the sample.
A) Everyone in the population must also be in the sample.
B) Data from people in the sample are used to gain information about the population.
C) Data from people in the population are used to gain information about the sample.
D) The population is a subset of the sample.
Unlock Deck
Unlock for access to all 79 flashcards in this deck.
Unlock Deck
k this deck
13
Which of the following is true about the margin of error for the most common types of surveys?
A) If the number of individuals in the sample were to be substantially increased, the margin of error would decrease.
B) If the number of individuals in the sample were to be substantially decreased, the margin of error would also decrease.
C) If the number of individuals in the sample were to be substantially increased, the margin of error would not change.
D) If the number of individuals in the sample were to be substantially decreased, the margin of error would not change.
Unlock Deck
Unlock for access to all 79 flashcards in this deck.
Unlock Deck
k this deck
14
Suppose a Gallup Poll using a sample of 400 individuals found that 25% of them supported a particular opinion. An interval that is 95% certain to contain the truth about the population percent who support that opinion is
A) 25% - 0.05% or 24.95% to 25.05%.
B) 25% - 0.25% or 24.75% to 25.25%.
C) 25% - 5% or 20% to 30%.
D) 25% - 20% or 5% to 45%.
A) 25% - 0.05% or 24.95% to 25.05%.
B) 25% - 0.25% or 24.75% to 25.25%.
C) 25% - 5% or 20% to 30%.
D) 25% - 20% or 5% to 45%.
Unlock Deck
Unlock for access to all 79 flashcards in this deck.
Unlock Deck
k this deck
15
If a magazine sends a survey to a random sample of 10,000 of its subscribers but only 3000 of them return the survey, the sample results may not be representative of the population of subscribers because
A) they used a self-selected sample.
B) there is likely to be nonresponse bias.
C) a volunteer sample was used.
D) they used a random sample.
A) they used a self-selected sample.
B) there is likely to be nonresponse bias.
C) a volunteer sample was used.
D) they used a random sample.
Unlock Deck
Unlock for access to all 79 flashcards in this deck.
Unlock Deck
k this deck
16
In the study described in Case Study 1.4, questionnaires were sent to 100,000 women asking about love, sex and relationships. Only 4.5% of the women responded. This means that
A) the margin of error for the survey was 4.5%.
B) a random sample was not contacted.
C) women who felt strongly did not respond.
D) nonresponse bias was likely to be a major problem.
A) the margin of error for the survey was 4.5%.
B) a random sample was not contacted.
C) women who felt strongly did not respond.
D) nonresponse bias was likely to be a major problem.
Unlock Deck
Unlock for access to all 79 flashcards in this deck.
Unlock Deck
k this deck
17
"Does Prayer Lower Blood Pressure" was a question asked in Case Study 1.5. The moral of the story was
A) cause-and-effect conclusions can generally be made in an observational study.
B) cause-and-effect conclusions cannot generally be made in an observational study.
C) cause-and-effect conclusions can generally be made in an experiment.
D) cause-and-effect conclusions cannot generally be made in an experiment.
Unlock Deck
Unlock for access to all 79 flashcards in this deck.
Unlock Deck
k this deck
18
If a difference seen in sample results is "statistically significant"it means that
A) there is an important difference in the sample results.
B) there is an important difference in the population.
C) the difference observed in the sample was unlikely to have occurred if there is no difference in the population.
D) there is an important difference in the population that wasn't reflected in the sample results.
Unlock Deck
Unlock for access to all 79 flashcards in this deck.
Unlock Deck
k this deck
19
An organization would like to conduct a survey of a sample of their membership to make conclusions about the entire membership. Given that they have a limited budget, they should focus their attention on
A) getting as large a sample as possible, even if they are all volunteers.
B) getting as large a sample as possible, even if they are not representative.
C) getting a representative sample.
D) getting a self-selected sample.
A) getting as large a sample as possible, even if they are all volunteers.
B) getting as large a sample as possible, even if they are not representative.
C) getting a representative sample.
D) getting a self-selected sample.
Unlock Deck
Unlock for access to all 79 flashcards in this deck.
Unlock Deck
k this deck
20
One of the common elements of the eight case studies in Chapter 1 is
A) in each case, a randomized experiment is described.
B) in each case, an observational study is described.
C) in each case, confounding variables are a problem.
D) in each case, data are used to make a judgment about the situation.
A) in each case, a randomized experiment is described.
B) in each case, an observational study is described.
C) in each case, confounding variables are a problem.
D) in each case, data are used to make a judgment about the situation.
Unlock Deck
Unlock for access to all 79 flashcards in this deck.
Unlock Deck
k this deck
21
Use the following information for questions:
The result of an Internet poll was reported as evidence that most people believe the pledge of allegiance is constitutional. The poll was conducted by posting a notice on a website and asking people to respond. The results were based on 235 people who responded. Of the 235 people, 172 (73%) believed that the pledge is constitutional, while 63 (27%) believed that the pledge is unconstitutional.
-The results of this poll
A) are convincing, because 73% is an overwhelming majority.
B) are unreliable, because the sample size was too small.
C) are reliable, because the sample size was large enough.
D) cannot be generalized, because the results are based on a self-selected sample.
Unlock Deck
Unlock for access to all 79 flashcards in this deck.
Unlock Deck
k this deck
22
Use the following information for questions:
The result of an Internet poll was reported as evidence that most people believe the pledge of allegiance is constitutional. The poll was conducted by posting a notice on a website and asking people to respond. The results were based on 235 people who responded. Of the 235 people, 172 (73%) believed that the pledge is constitutional, while 63 (27%) believed that the pledge is unconstitutional.
-Assuming the poll had been based on a random sample with a sample size of 235, the reported margin of error of 3%
A) was correct.
B) was incorrect; the margin of error should be less than 1.0%
C) was incorrect; the margin of error should be about 6.5%
D) was incorrect; the margin of error should be about 3.5%.
Unlock Deck
Unlock for access to all 79 flashcards in this deck.
Unlock Deck
k this deck
23
A newspaper reported that 41% of students who had taken calculus in high school had a college freshman year GPA (grade point average) of 3.2 or higher. The headline was "High School Courses Key to College Grades". One potential problem with this headline is
A) motivated students could have both taken calculus in high school and have a high GPA (3.2 or higher) in their freshman year in college.
B) the margin of error was not reported in the article, so the figure 41% may be very uncertain.
C) not all students with a freshman GPA of 3.2 or higher had taken calculus.
D) not all students who had taken calculus in high school had a freshman GPA of 3.2 or higher.
Unlock Deck
Unlock for access to all 79 flashcards in this deck.
Unlock Deck
k this deck
24
To investigate how trans fat consumption might affect fertility, researchers analyzed data available from 18,555 healthy women who participated in the Nurses' Health Study between 1991 and 1999. All were married and trying to get pregnant. It was reported that for every 2 percent increase in the amount of calories a woman got from trans fats instead of carbohydrates, her risk of infertility increased by 73 percent.
"Even though this was an observational study, a cause and affect relationship between the consumption of trans fat and fertility has been established because the increase in risk is significantly more than 50 percent."
"Even though this was an observational study, a cause and affect relationship between the consumption of trans fat and fertility has been established because the increase in risk is significantly more than 50 percent."
Unlock Deck
Unlock for access to all 79 flashcards in this deck.
Unlock Deck
k this deck
25
To investigate how trans fat consumption might affect fertility, researchers analyzed data available from 18,555 healthy women who participated in the Nurses' Health Study between 1991 and 1999. All were married and trying to get pregnant. It was reported that for every 2 percent increase in the amount of calories a woman got from trans fats instead of carbohydrates, her risk of infertility increased by 73 percent.
"The relationship between the consumption of trans fat and fertility may not be there at all, since it could all be affected by a confounding variable such as exercise or environmental variables."
"The relationship between the consumption of trans fat and fertility may not be there at all, since it could all be affected by a confounding variable such as exercise or environmental variables."
Unlock Deck
Unlock for access to all 79 flashcards in this deck.
Unlock Deck
k this deck
26
A news article with the headline "Arming commercial pilots" reported that 50% of first class and business travelers believe that pilots should be armed as an additional security measure, while 50% believed that pilots should not be armed. The results of the study
A) show that the American public was evenly divided on whether pilots should be armed or not.
B) does not show anything about the opinion of the American public because the sample was not representative of the general public.
C) show that security was a concern for the American public.
D) does not show that security was a concern for the American public.
Unlock Deck
Unlock for access to all 79 flashcards in this deck.
Unlock Deck
k this deck
27
In a study of advanced colorectal cancer, 100 patients were randomly assigned to receive either a high dose of Vitamin C or placebo. The study concluded that Vitamin C was not effective in the treatment of advanced colorectal cancer because none of the patients with disease showed any improvement in the two groups. The cause and effect conclusion
A) might be justified because randomization was used.
B) cannot be justified because anecdotal evidence from other patients not in the study, shows that some people who take Vitamin C do recover from their disease.
C) cannot be justified because there could have been other systematic differences between the two treatment groups, such as age and gender, so that the two groups cannot be compared to each other.
D) could be justified because the sample size was fairly large (100 patients).
Unlock Deck
Unlock for access to all 79 flashcards in this deck.
Unlock Deck
k this deck
28
Use the following information for questions:
In a study of patients who had a heart attack, 3630 patients were randomly assigned to receive one of three treatments: aspirin alone, warfarin alone, or aspirin plus warfarin. The results showed that 20.0% of the aspirin group had another heart attack, stroke, or died, compared with 16.7% of the warfarin group and 15.0% of the aspirin plus warfarin group. The difference between the aspirin and warfarin groups was statistically significant, while the difference between the warfarin and aspirin plus warfarin group was not statistically significant.
-The statistically significant difference between the aspirin group (20.0%) and the warfarin group (16.7%) means that
A) the difference between the two rates, 20.0% and 16.7%, is unlikely to have resulted from two groups whose true rates of heart attack, stroke, or death were identical.
B) the difference between the two rates, 20.0% and 16.7%, is likely to have resulted from two groups whose true rates were identical.
C) the difference between the two rates, 20.0% and 16.7%, is likely to have resulted from the difference in sample sizes between the two groups.
D) the difference in the two rates, 20.0% and 16.7%, is likely to have resulted from other factors, such as age and gender, on which the two groups differed.
Unlock Deck
Unlock for access to all 79 flashcards in this deck.
Unlock Deck
k this deck
29
Use the following information for questions:
In a study of patients who had a heart attack, 3630 patients were randomly assigned to receive one of three treatments: aspirin alone, warfarin alone, or aspirin plus warfarin. The results showed that 20.0% of the aspirin group had another heart attack, stroke, or died, compared with 16.7% of the warfarin group and 15.0% of the aspirin plus warfarin group. The difference between the aspirin and warfarin groups was statistically significant, while the difference between the warfarin and aspirin plus warfarin group was not statistically significant.
-The non-statistically significant difference between the warfarin alone group (16.7%) and the aspirin plus warfarin group (15.0%) means that
A) the difference between the two rates, 16.7% and 15.0%, is not medically important.
B) the difference between the two rates, 16.7% and 15.0%, is medically important.
C) the difference between the two rates, 16.7% and 15.0%, is unlikely to have resulted from two groups whose true rates were identical.
D) the difference between the two rates, 16.7% and 15.0%, may have occurred by chance between two groups whose true rates were identical.
Unlock Deck
Unlock for access to all 79 flashcards in this deck.
Unlock Deck
k this deck
30
An Islamic survey conducted by the Gallup organization consisted of a random sample of 10,004 people living in 9 predominantly Islamic countries. The sample was collected by interviewers going to people's homes in randomly chosen areas in each of the 9 countries. The population represented by this sample was
A) all Muslims in the world.
B) all Muslims who live in any Islamic country.
C) all people, Muslim and non-Muslim, living in homes in any of the 9 countries.
D) all people, Muslim and non-Muslim, who live in the same cities and villages as the people in the sample.
A) all Muslims in the world.
B) all Muslims who live in any Islamic country.
C) all people, Muslim and non-Muslim, living in homes in any of the 9 countries.
D) all people, Muslim and non-Muslim, who live in the same cities and villages as the people in the sample.
Unlock Deck
Unlock for access to all 79 flashcards in this deck.
Unlock Deck
k this deck
31
A random sample of 1,002 adults aged at least 18 years and living in the 48 contiguous states (i.e. any state in the United States excluding Alaska and Hawaii) was conducted by the Gallup Organization. The interviews were done over the telephone. The population represented by this sample was
A) all adult Americans in the 48 contiguous states living in a household with a phone.
B) all adult Americans living in the same cities as people who were actually sampled.
C) all adult Americans.
D) all Americans.
A) all adult Americans in the 48 contiguous states living in a household with a phone.
B) all adult Americans living in the same cities as people who were actually sampled.
C) all adult Americans.
D) all Americans.
Unlock Deck
Unlock for access to all 79 flashcards in this deck.
Unlock Deck
k this deck
32
If the sample size for a poll increases from 100 people to 400 people, the margin of error
A) increases by a factor of 4, i.e. is multiplied by 4.
B) increases by a factor of 2, i.e. is multiplied by 2.
C) decreases by a factor of ½, i.e. is multiplied by ½.
D) decreases by a factor of ¼, i.e. is multiplied by ¼.
A) increases by a factor of 4, i.e. is multiplied by 4.
B) increases by a factor of 2, i.e. is multiplied by 2.
C) decreases by a factor of ½, i.e. is multiplied by ½.
D) decreases by a factor of ¼, i.e. is multiplied by ¼.
Unlock Deck
Unlock for access to all 79 flashcards in this deck.
Unlock Deck
k this deck
33
According to the CIRP Freshman Survey, UCLA's annual survey of the nation's entering students at four-year colleges and universities, conducted in 2010, female students were far less likely to report high levels of emotional health than male students (45.9 percent versus 59.1 percent), a 13.2 percentage-point difference. This difference was reported as statistically significant. The statistically significant difference between male and female students means that
A) the difference between the two rates (45.9 percent versus 59.1 percent) is likely to have resulted from two groups whose true rates of high levels of emotional health were identical.
B) the difference between the two rates (45.9 percent versus 59.1 percent) is unlikely to have resulted from two groups whose true rates of high levels of emotional health were identical.
C) the difference between the two rates (45.9 percent versus 59.1 percent) is likely to have resulted from the difference in sample sizes between male and female students.
D) the difference in the two rates (45.9 percent versus 59.1 percent) is likely to have resulted from other factors, such as age and major, on which the two groups differed.
Unlock Deck
Unlock for access to all 79 flashcards in this deck.
Unlock Deck
k this deck
34
Use the following information for questions:
A five number summary for hours studied in a week were 5, 12, 14, 18, and 20.
-What is the value such that 50% or more of the students studied longer than that value?
A) 5 hours
B) 12 hours
C) 14 hours
D) 18 hours
A five number summary for hours studied in a week were 5, 12, 14, 18, and 20.
-What is the value such that 50% or more of the students studied longer than that value?
A) 5 hours
B) 12 hours
C) 14 hours
D) 18 hours
Unlock Deck
Unlock for access to all 79 flashcards in this deck.
Unlock Deck
k this deck
35
Use the following information for questions:
A five number summary for hours studied in a week were 5, 12, 14, 18, and 20.
-What was the longest number of hours studied by anyone?
A) 12 hours
B) 14 hours
C) 18 hours
D) 20 hours
A five number summary for hours studied in a week were 5, 12, 14, 18, and 20.
-What was the longest number of hours studied by anyone?
A) 12 hours
B) 14 hours
C) 18 hours
D) 20 hours
Unlock Deck
Unlock for access to all 79 flashcards in this deck.
Unlock Deck
k this deck
36
Use the following information for questions:
A five number summary for hours studied in a week were 5, 12, 14, 18, and 20.
-What was the shortest number of hours studied by anyone?
A) 5 hours
B) 12 hours
C) 14 hours
D) 18 hours
A five number summary for hours studied in a week were 5, 12, 14, 18, and 20.
-What was the shortest number of hours studied by anyone?
A) 5 hours
B) 12 hours
C) 14 hours
D) 18 hours
Unlock Deck
Unlock for access to all 79 flashcards in this deck.
Unlock Deck
k this deck
37
Use the following information for questions:
A five number summary for hours studied in a week were 5, 12, 14, 18, and 20.
-What is the value such that 75% or more of the students studied longer than that value?
A) 5 hours
B) 12 hours
C) 14 hours
D) 18 hours
A five number summary for hours studied in a week were 5, 12, 14, 18, and 20.
-What is the value such that 75% or more of the students studied longer than that value?
A) 5 hours
B) 12 hours
C) 14 hours
D) 18 hours
Unlock Deck
Unlock for access to all 79 flashcards in this deck.
Unlock Deck
k this deck
38
Use the following information for questions:
A five number summary for hours studied in a week were 5, 12, 14, 18, and 20.
-What is the value such that 25% or more of the students studied longer than that value?
A) 5 hours
B) 12 hours
C) 14 hours
D) 18 hours
A five number summary for hours studied in a week were 5, 12, 14, 18, and 20.
-What is the value such that 25% or more of the students studied longer than that value?
A) 5 hours
B) 12 hours
C) 14 hours
D) 18 hours
Unlock Deck
Unlock for access to all 79 flashcards in this deck.
Unlock Deck
k this deck
39
A sociologist has been studying college instructors and is especially interested in those instructors who teach night classes. He has been collecting data for years. Some of the variables are the course grade from the student evaluations, the number of students who take the course, the age of the instructor, the income of the instructor, the field of the course (social sciences, natural sciences, humanities, music/arts), the highest level of education the instructor has completed (Bachelor, Master, Ph.D.). The sociologist has looked at relationships between many of the variables and tested if there were differences between the different fields. The only difference that was found to be significant was the mean age of social science instructors and the mean age of natural science instructors. What is most likely the cause of this one significant result?
A) a false negative
B) data snooping
C) a confounding variable
D) the wrong question was asked
A) a false negative
B) data snooping
C) a confounding variable
D) the wrong question was asked
Unlock Deck
Unlock for access to all 79 flashcards in this deck.
Unlock Deck
k this deck
40
Which of the statistical principles stated below is false?
A) A statistically significant finding does not necessarily have practical significance or importance. When a study reports a statistically significant finding, we also need to find out the magnitude of the result.
B) A change in the rate or risk of occurrence of something is only useful when the base rate or baseline risk is reported as well.
C) When you read about a reported relationship or difference, you also need to find out how many different things were tested. The more tests that are done, the more likely it is that a statistically significant difference is a false positive that can be explained by chance.
D) Sample sizes are dependent on population sizes. So, in order to give reasonably accurate information about a population of many millions, we have to take a sample of many thousands.
Unlock Deck
Unlock for access to all 79 flashcards in this deck.
Unlock Deck
k this deck
41
In 2001 the baseball player Barry Bonds hit a record 73 home runs. During that year, he was at bat 476 times. In 1986, Bond's first season, he hit 16 home runs out of 413 at bats. Calculate Bond's rate of home runs for the 2001 and 1986 seasons.
Unlock Deck
Unlock for access to all 79 flashcards in this deck.
Unlock Deck
k this deck
42
In 2001 the baseball player Barry Bonds had 156 base hits out of 476 at bats. In 1986, Bond's first season, he had 92 hits out of 413 at bats. Calculate Bond's batting average (ratio of base hits to times at bat) for the 2001 and 1986 seasons.
Unlock Deck
Unlock for access to all 79 flashcards in this deck.
Unlock Deck
k this deck
43
In 1992, the total number of deaths among American men aged 15-19 was 10,747, with 3,664 deaths among American women aged 15-19 years. The total numbers of 15-19 year olds were 8.78 million men and 8.33 million women. Calculate the death rates per 100,000 for 15-19 year old men and women. Was the rate for men higher or lower than for women?
Unlock Deck
Unlock for access to all 79 flashcards in this deck.
Unlock Deck
k this deck
44
An Islamic survey conducted by the Gallup organization consisted of a random sample of 10,004 people living in 9 predominantly Islamic countries. Calculate the approximate margin of error for the survey.
Unlock Deck
Unlock for access to all 79 flashcards in this deck.
Unlock Deck
k this deck
45
Use the following information for questions:
In a 1994 Census Bureau report, the total number of households and the number of households with a married couple and their own children were reported for the years 1990 and for 1994. The results are given below:
One newspaper reported these results with the following headline: "Number of Two-Parent Families Up." Another newspaper, based on the percentages, reported on the same results with the headline: "Traditional Families Less Common".
-In 1990, what percentage of households consisted of a married couple with children?
In a 1994 Census Bureau report, the total number of households and the number of households with a married couple and their own children were reported for the years 1990 and for 1994. The results are given below:
One newspaper reported these results with the following headline: "Number of Two-Parent Families Up." Another newspaper, based on the percentages, reported on the same results with the headline: "Traditional Families Less Common".-In 1990, what percentage of households consisted of a married couple with children?
Unlock Deck
Unlock for access to all 79 flashcards in this deck.
Unlock Deck
k this deck
46
Use the following information for questions:
In a 1994 Census Bureau report, the total number of households and the number of households with a married couple and their own children were reported for the years 1990 and for 1994. The results are given below:
One newspaper reported these results with the following headline: "Number of Two-Parent Families Up." Another newspaper, based on the percentages, reported on the same results with the headline: "Traditional Families Less Common".
-In 1994, what percentage of households consisted of a married couple with children?
In a 1994 Census Bureau report, the total number of households and the number of households with a married couple and their own children were reported for the years 1990 and for 1994. The results are given below:
One newspaper reported these results with the following headline: "Number of Two-Parent Families Up." Another newspaper, based on the percentages, reported on the same results with the headline: "Traditional Families Less Common".-In 1994, what percentage of households consisted of a married couple with children?
Unlock Deck
Unlock for access to all 79 flashcards in this deck.
Unlock Deck
k this deck
47
Use the following information for questions:
In a 1994 Census Bureau report, the total number of households and the number of households with a married couple and their own children were reported for the years 1990 and for 1994. The results are given below:
One newspaper reported these results with the following headline: "Number of Two-Parent Families Up." Another newspaper, based on the percentages, reported on the same results with the headline: "Traditional Families Less Common".
-Both newspapers reported correct figures; explain why it was possible for them to come to opposite conclusions. Which conclusion do you think is more descriptive of the trend?
In a 1994 Census Bureau report, the total number of households and the number of households with a married couple and their own children were reported for the years 1990 and for 1994. The results are given below:
One newspaper reported these results with the following headline: "Number of Two-Parent Families Up." Another newspaper, based on the percentages, reported on the same results with the headline: "Traditional Families Less Common".-Both newspapers reported correct figures; explain why it was possible for them to come to opposite conclusions. Which conclusion do you think is more descriptive of the trend?
Unlock Deck
Unlock for access to all 79 flashcards in this deck.
Unlock Deck
k this deck
48
Use the following information for questions:
The results of 2,475 people on trial for murder are shown below by the race of the victim (black or white) and the verdict (death penalty yes or no). These results were used in a Supreme Court trial on behalf of a defendant.
-Calculate the percentage of death penalties for cases where the race of the victim was white, and the percentage where the race of the victim was black.
Unlock Deck
Unlock for access to all 79 flashcards in this deck.
Unlock Deck
k this deck
49
Use the following information for questions:
The results of 2,475 people on trial for murder are shown below by the race of the victim (black or white) and the verdict (death penalty yes or no). These results were used in a Supreme Court trial on behalf of a defendant.
-What are some confounding variables that might also explain the observed difference in percentages of death penalties for cases where the victim was white versus black?
Unlock Deck
Unlock for access to all 79 flashcards in this deck.
Unlock Deck
k this deck
50
In the Sydney 2000 Olympics, Cathy Freeman (Australia) won the gold medal in the women's 400 meter event. Lorraine Graham (Jamaica) won the silver medal, and Katharine Merry (Great Britain) won the bronze. The times (in seconds) of the 8 finalists are listed below. Calculate the five-number summary for the women's 400 meter final.
49.11 49.58 49.72 49.79 49.96 50.05 50.12 51.04
49.11 49.58 49.72 49.79 49.96 50.05 50.12 51.04
Unlock Deck
Unlock for access to all 79 flashcards in this deck.
Unlock Deck
k this deck
51
In the Sydney 2000 Olympics, Michael Johnson (United States) won the gold medal in the men's 400 meter event. Alvin Harrison (United States) won the silver medal, and Gregory Haughton (Jamaica) won the bronze. The times (in seconds) of the 8 finalists are listed below. Calculate the five-number summary for the men's 400 meter final.
43.84 44.40 44.70 45.01 45.14 45.26 45.42 45.55
43.84 44.40 44.70 45.01 45.14 45.26 45.42 45.55
Unlock Deck
Unlock for access to all 79 flashcards in this deck.
Unlock Deck
k this deck
52
Drawn below are two dotplots displaying the heights (in inches) of 94 females and 77 males. Also given are the 5 number summaries. Describe any differences or similarities between the two sets of data.
Unlock Deck
Unlock for access to all 79 flashcards in this deck.
Unlock Deck
k this deck
53
Drawn below are two dotplots displaying the number of letters that could be written in 15 seconds among 63 students using their dominant hand and then using their non-dominant hand. Also given are the 5 number summaries. Describe any differences or similarities between the two sets of data.
Unlock Deck
Unlock for access to all 79 flashcards in this deck.
Unlock Deck
k this deck
54
Drawn below are two dotplots displaying the number of minutes spent talking on the telephone during a typical week for 36 female and 39 male students at Penn State University. Also given are the five number summaries. Describe any differences or similarities between the two sets of data.
Unlock Deck
Unlock for access to all 79 flashcards in this deck.
Unlock Deck
k this deck
55
Drawn below are two dotplots displaying the number of minutes spent exercising during a typical week for 36 female and 39 male students at Penn State University. Also given are the five number summaries. Describe any differences or similarities between the two sets of data.
Unlock Deck
Unlock for access to all 79 flashcards in this deck.
Unlock Deck
k this deck
56
Drawn below are two dotplots displaying the dollar amount spent on textbooks for one semester for 36 female and 39 male students at Penn State University. Also given are the five number summaries. Describe any differences or similarities between the two sets of data.
Unlock Deck
Unlock for access to all 79 flashcards in this deck.
Unlock Deck
k this deck
57
Use the following information for questions:
The next three questions are based on a study (part of the Women's Health Initiative) of healthy women volunteers. A total of 16,608 women were randomly assigned to take either placebo or a popular hormone replacement therapy (HRT) for eight years. The study was stopped after 5 years in part because the women on HRT had a higher rate of heart attacks than the placebo group.
-The rate of heart attacks for women on HRT was 29% higher than the rate in the placebo group. The baseline rate of heart attacks in the placebo group was 30 per 10,000 women. What was the rate of heart attacks in the HRT group?
Unlock Deck
Unlock for access to all 79 flashcards in this deck.
Unlock Deck
k this deck
58
Use the following information for questions:
The next three questions are based on a study (part of the Women's Health Initiative) of healthy women volunteers. A total of 16,608 women were randomly assigned to take either placebo or a popular hormone replacement therapy (HRT) for eight years. The study was stopped after 5 years in part because the women on HRT had a higher rate of heart attacks than the placebo group.
-The rate of strokes for women in the HRT group was 41% higher than the rate of strokes for women in the placebo group. The baseline rate of strokes in the placebo group was 21 per 10,000 women. What was the rate of strokes in the HRT group?
Unlock Deck
Unlock for access to all 79 flashcards in this deck.
Unlock Deck
k this deck
59
Use the following information for questions:
The next three questions are based on a study (part of the Women's Health Initiative) of healthy women volunteers. A total of 16,608 women were randomly assigned to take either placebo or a popular hormone replacement therapy (HRT) for eight years. The study was stopped after 5 years in part because the women on HRT had a higher rate of heart attacks than the placebo group.
-The rate of invasive breast cancer was 30 per 10,000 women in the placebo group and 38 per 10,000 women in the HRT group. What was the increase in the rate of breast cancers in the HRT group compared to the rate in the placebo group?
Unlock Deck
Unlock for access to all 79 flashcards in this deck.
Unlock Deck
k this deck
60
In a National Cancer Institute study of the potential benefits of breast self-exams, 226,064 Chinese women in Shanghai were randomly assigned to a breast self-exam instruction group (132,979 women) or a control group (133,085 women). Over the next 10 to 11 years, there were 131 breast cancer deaths in the self-exam group, and 135 breast cancer deaths in the control group. The authors concluded that "intensive instruction in breast self-exam did not reduce mortality from breast cancer." What were the rates of breast cancer deaths in the two groups per 100,000 women?
Unlock Deck
Unlock for access to all 79 flashcards in this deck.
Unlock Deck
k this deck
61
Use the following information for questions:
According to a CNN poll released in January of 2010, 56 percent of the public opposed the stimulus bill, with 42 percent supportive of the plan. The CNN/Opinion Research Corporation poll was conducted January 8-10, with 1,021 adult Americans questioned by telephone. The survey's sampling error was reported as plus or minus 3 percentage points.
-How many people in the sample opposed the stimulus bill?
Unlock Deck
Unlock for access to all 79 flashcards in this deck.
Unlock Deck
k this deck
62
Use the following information for questions:
According to a CNN poll released in January of 2010, 56 percent of the public opposed the stimulus bill, with 42 percent supportive of the plan. The CNN/Opinion Research Corporation poll was conducted January 8-10, with 1,021 adult Americans questioned by telephone. The survey's sampling error was reported as plus or minus 3 percentage points.
-In March of 2009, just weeks after the stimulus was signed into law by President Obama, a CNN survey indicated that 54 percent supported the program, with 44 percent opposed. If we wish to compare the supporting rates between 2010 and 2009, what would be the base rate?
Unlock Deck
Unlock for access to all 79 flashcards in this deck.
Unlock Deck
k this deck
63
Use the following information for questions:
According to a CNN poll released in January of 2010, 56 percent of the public opposed the stimulus bill, with 42 percent supportive of the plan. The CNN/Opinion Research Corporation poll was conducted January 8-10, with 1,021 adult Americans questioned by telephone. The survey's sampling error was reported as plus or minus 3 percentage points.
-What is the approximate margin of error for this survey? Did the story report the correct margin of error?
Unlock Deck
Unlock for access to all 79 flashcards in this deck.
Unlock Deck
k this deck
64
Use the following information for questions:
According to a CNN poll released in January of 2010, 56 percent of the public opposed the stimulus bill, with 42 percent supportive of the plan. The CNN/Opinion Research Corporation poll was conducted January 8-10, with 1,021 adult Americans questioned by telephone. The survey's sampling error was reported as plus or minus 3 percentage points.
-Provide an interval of numbers that is 95% certain to cover the true percentage of Americans who supported the bill in 2010.
Unlock Deck
Unlock for access to all 79 flashcards in this deck.
Unlock Deck
k this deck
65
A survey of people applying for a mortgage showed that among white people with a bad credit rating, 90% were approved for mortgages, whereas among black people with a bad credit rating, 81% were approved. What confounding variable could also explain the apparent racial difference in the percentage of approved mortgages?
Unlock Deck
Unlock for access to all 79 flashcards in this deck.
Unlock Deck
k this deck
66
In a poll of students in grades 6 through 12, 13% reported that someone had seriously threatened to shoot them in the past year. This percentage was based on a sample of 2,508 students in 96 schools for which the principal had to give consent before the students could be surveyed. Give one possible explanation of why the sample may not have been representative of the population of all students in grades 6 through 12.
Unlock Deck
Unlock for access to all 79 flashcards in this deck.
Unlock Deck
k this deck
67
Over a 30-year period, the rate of the number of people killed by lightning compared to people killed by hurricanes was 350%. If the number of people killed by hurricanes was 16, what was the number of people killed by lightning? Is lightning a major cause of death?
Unlock Deck
Unlock for access to all 79 flashcards in this deck.
Unlock Deck
k this deck
68
Use the following information for questions:
The table below shows the results of a survey of students who took college prep courses who were asked to rate their high school education.
-Calculate the percentage of students who gave an excellent rating to their high schools.
The table below shows the results of a survey of students who took college prep courses who were asked to rate their high school education.
-Calculate the percentage of students who gave an excellent rating to their high schools.
Unlock Deck
Unlock for access to all 79 flashcards in this deck.
Unlock Deck
k this deck
69
Use the following information for questions:
The table below shows the results of a survey of students who took college prep courses who were asked to rate their high school education.
-Calculate the percentage of students who gave a good rating to their high schools.
The table below shows the results of a survey of students who took college prep courses who were asked to rate their high school education.
-Calculate the percentage of students who gave a good rating to their high schools.
Unlock Deck
Unlock for access to all 79 flashcards in this deck.
Unlock Deck
k this deck
70
Suppose that a survey of 20,000 high school students (10,000 girls and 10,000 boys) was done. Students were asked if they had used cocaine during the last 30 days. 4.9% of the boys and 4.2% of the girls reported using cocaine. The difference between the two percentages is statistically significant. Explain why this difference may not be practically significant.
Unlock Deck
Unlock for access to all 79 flashcards in this deck.
Unlock Deck
k this deck
71
In the presidential election of 1936, the Democratic incumbent Franklin Roosevelt was re-elected over the Republican challenger Alf Landon. Before the election, the magazine Literary Digest had published the results of a questionnaire sent to 10 million people: 2.3 million people chose to reply to the survey. The poll incorrectly predicted that Landon would win the election. Explain why this prediction was inherently unreliable.
Unlock Deck
Unlock for access to all 79 flashcards in this deck.
Unlock Deck
k this deck
72
In 1936, George Gallup correctly predicted the winner of the presidential election to be Franklin Roosevelt. His prediction was based on a random sample of 50,000 people. What was the margin of error for Gallup's survey?
Unlock Deck
Unlock for access to all 79 flashcards in this deck.
Unlock Deck
k this deck
73
A newspaper reported that 41% of students who had taken calculus in high school had a first year college GPA (grade point average) of 3.2 or higher. Explain why it would also have been useful to know what the baseline rate was (i.e. the proportion of students without calculus who had a GPA of 3.2 or higher).
Unlock Deck
Unlock for access to all 79 flashcards in this deck.
Unlock Deck
k this deck
74
Use the following information for questions:
First-year college students' self-ratings of their emotional health dropped to record low levels in 2010, according to the CIRP Freshman Survey, UCLA's annual survey of the nation's entering students at four-year colleges and universities. The rate of students who reported that their emotional health was in the "highest 10 percent" or "above average" was 519 per 1000 student. This was a drop of 34 per 1000 students from 2009 and a significant decline from the rate of students who placed themselves in those categories when self-ratings of emotional health were first measured in 1985.
-What was the rate of students who reported that their emotional health was in the "highest 10 percent" or "above average" in 2009?
Unlock Deck
Unlock for access to all 79 flashcards in this deck.
Unlock Deck
k this deck
75
Use the following information for questions:
First-year college students' self-ratings of their emotional health dropped to record low levels in 2010, according to the CIRP Freshman Survey, UCLA's annual survey of the nation's entering students at four-year colleges and universities. The rate of students who reported that their emotional health was in the "highest 10 percent" or "above average" was 519 per 1000 student. This was a drop of 34 per 1000 students from 2009 and a significant decline from the rate of students who placed themselves in those categories when self-ratings of emotional health were first measured in 1985.
-Consider the rate in 1985 as the baseline rate. This rate was 636 per 1000 students. What was the decrease in the rate of students who reported that their emotional health was in the "highest 10 percent" or "above average" as compared to this baseline rate?
Unlock Deck
Unlock for access to all 79 flashcards in this deck.
Unlock Deck
k this deck
76
Use the following information for questions:
According to statistics published by the Centers for Disease Control and Prevention in January of 2011, 25.8 million people, or 8.3% of the U.S. population, are affected by either type 1 or type 2 diabetes.
-Based on the numbers published by the CDCP, roughly how many people lived in the U.S. in January of 2011?
Unlock Deck
Unlock for access to all 79 flashcards in this deck.
Unlock Deck
k this deck
77
Use the following information for questions:
According to statistics published by the Centers for Disease Control and Prevention in January of 2011, 25.8 million people, or 8.3% of the U.S. population, are affected by either type 1 or type 2 diabetes.
-Suppose these results are based on hospital records of 10,000 patients. Provide an interval of numbers that is 95% certain to cover the true percentage of Americans who are affected by either type 1 or type 2 diabetes.
Unlock Deck
Unlock for access to all 79 flashcards in this deck.
Unlock Deck
k this deck
78
Use the following information for questions:
Gallup's standard of living measure reports the percentage of Americans who say their standard of living is getting better versus the percentage who say their standard of living is getting worse. Results are based on telephone interviews with approximately 3,000 national adults. The margin of error is reported as ±2 percentage points. In January of 2011, 49% reported that their standard of living is getting better.
-What is the approximate margin of error for this survey? Did the story report the correct margin of error?
Unlock Deck
Unlock for access to all 79 flashcards in this deck.
Unlock Deck
k this deck
79
Use the following information for questions:
Gallup's standard of living measure reports the percentage of Americans who say their standard of living is getting better versus the percentage who say their standard of living is getting worse. Results are based on telephone interviews with approximately 3,000 national adults. The margin of error is reported as ±2 percentage points. In January of 2011, 49% reported that their standard of living is getting better.
-Provide an interval of numbers that is 95% certain to cover the true percentage of Americans who report that their standard of living is getting better.
Unlock Deck
Unlock for access to all 79 flashcards in this deck.
Unlock Deck
k this deck
Unlock Deck
Unlock for access to all 79 flashcards in this deck.


