Deck 17: Public Choice, Taxes, and the Distribution of Income
Full screen (f)
Question
Question
Question
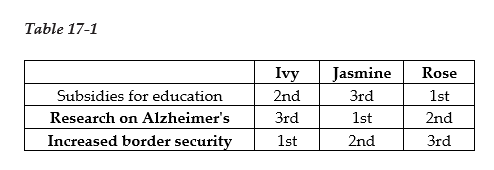
Suppose $1 billion is available in the budget and Congress is considering allocating the funds to one of the following three alternatives: 1) Subsidies for education, 2) Research on Alzheimer's or 3) Increased border security. Table 17-1 shows three voters' rankings of the alternatives.
-Refer to Table 17-1. Suppose a series of votes are taken in which each pair of alternatives is considered in turn. If the vote is between allocating funds to subsidies for education and research on Alzheimer's
A) Ivy and Jasmine vote for education subsidies, Rose votes for Alzheimer's research, and education subsidies wins.
B) Ivy and Rose vote for education subsidies, Jasmine votes for Alzheimer's research, and education subsidies wins.
C) Jasmine and Rose vote for Alzheimer's research, Ivy votes for education subsidies, and Alzheimer's research wins.
D) Jasmine and Ivy vote for Alzheimer's research, Rose votes for education subsidies, and Alzheimer's research wins.
Question
Suppose $1 billion is available in the budget and Congress is considering allocating the funds to one of the following three alternatives: 1) Subsidies for education, 2) Research on Alzheimer's or 3) Increased border security. Table 17-1 shows three voters' rankings of the alternatives.
-Refer to Table 17-1. Suppose a series of votes are taken in which each pair of alternatives is considered in turn. If the vote is between allocating funds to research on Alzheimer's and increased border security
A) Ivy and Jasmine vote for Alzheimer's research, Rose votes for increased border security, and Alzheimer's research wins.
B) Ivy and Rose vote for increased border security, Jasmine votes for Alzheimer's research, and increased border security wins.
C) Jasmine and Rose vote for Alzheimer's research, Ivy votes for increased border security, and Alzheimer's research wins.
D) Jasmine and Ivy vote for increased border security, Rose votes for Alzheimer's research, and increased border security wins.
Question
Suppose $1 billion is available in the budget and Congress is considering allocating the funds to one of the following three alternatives: 1) Subsidies for education, 2) Research on Alzheimer's or 3) Increased border security. Table 17-1 shows three voters' rankings of the alternatives.
-Refer to Table 17-1. Suppose a series of votes are taken in which each pair of alternatives is considered in turn. If the vote is between allocating funds to education subsidies and increased border security
A) Ivy and Jasmine vote for education subsidies, Rose votes for increased border security, and education subsidies wins.
B) Ivy and Rose vote for increased border security, Jasmine votes for education subsidies, and increased border security wins.
C) Jasmine and Rose vote for education subsidies, Rose votes for increased border security, and education subsidies wins.
D) Jasmine and Ivy vote for increased border security, Rose votes for education subsidies, and increased border security wins.
Question
Suppose $1 billion is available in the budget and Congress is considering allocating the funds to one of the following three alternatives: 1) Subsidies for education, 2) Research on Alzheimer's or 3) Increased border security. Table 17-1 shows three voters' rankings of the alternatives.
-Refer to Table 17-1. Suppose a series of votes are taken in which each pair of alternatives is considered in turn. The first pair considered is between subsidies for education and research on Alzheimer's. The second pair considered is between Alzheimer's research and increased border security. The third pair considered is between education subsidies and increased border security. In this case, the collective preferences of the voters
A) turn out to be transitive and will yield a consistent outcome.
B) turn out to be transitive but will not result in a consistent outcome.
C) turn out not to be transitive and will not result in a consistent outcome.
D) turn out not to be transitive but will yield a consistent outcome.
Question
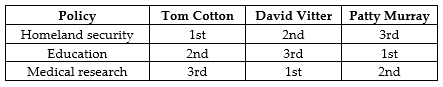
-Refer to Table 17-2. The table above lists three policy alternatives that the U.S. Senate will vote on, along with the ranking of these alternates. The Senate must decide which of these alternatives should receive an additional $1 billion of funding, and there is enough money in the federal budget for only one of these alternatives. If a series of votes is taken in which each pair of alternatives is considered (homeland security and education; homeland security and medical research; education and medical research) which of the following will result from these votes?
A) When the vote is between homeland security and education, the Senators will vote for education to receive funding.
B) The Senators' votes will demonstrate transitivity.
C) The results will illustrate the voting paradox.
D) The results from the voting will illustrate the median voter theorem.
Question
Question
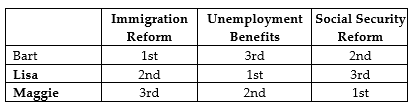
-Refer to Table 17-3. The table above outlines the rankings of three members of the U.S. Senate on three spending alternatives. Assume that Congress can spend additional revenue on only one of the three spending alternatives and that Bart, Lisa, and Maggie, all members of the Senate, participate in a series of votes in which they are to determine which of the spending alternatives should receive funding. Three votes will be taken: (1) Immigration Reform and Unemployment Benefits (2) Immigration Reform and Social Security Reform and (3) Unemployment Benefits and Social Security Reform.
Show the results of each vote and determine whether the voting paradox will occur as a result of these votes.
Question
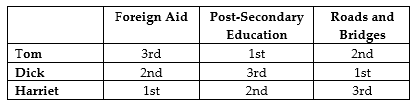
-Refer to Table 17-4. The table above outlines the rankings of three members of the U.S. House of Representatives on three spending alternatives. Assume that Congress can spend additional revenue on only one of the three spending alternatives and that Tom, Dick, and Harriet, all members of the House of Representatives, participate in a series of votes in which they are to determine which of the spending alternatives should receive funding. Three votes will be taken: (1) Foreign Aid and Post-Secondary Education (2) Foreign Aid and Roads and Bridges and (3) Post-Secondary Education and Roads and Bridges.
Determine whether the voting paradox will occur as a result of these votes.
Question
Question
Question
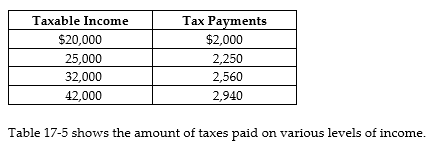
-Refer to Table 17-5. The tax system is
A) progressive throughout all levels of income.
B) proportional throughout all levels of income.
C) regressive throughout all levels of income.
D) regressive between $20,000 and $25,000 of income and progressive between $32,000 and $42,000.
Question
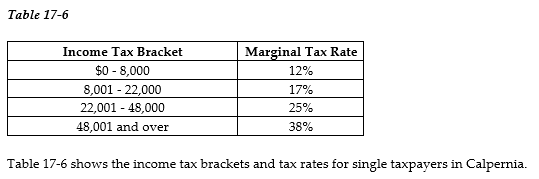
-Refer to Table 17-6. How much income tax does Sasha pay if she is a single taxpayer with an income of $60,000?
A) $22,800
B) $14,400
C) $13,800
D) $13,642
Question
-Refer to Table 17-6. Sasha is a single taxpayer with an income of $60,000. What is his marginal tax rate and what is his average tax rate?
A) marginal tax rate = 38%; average tax rate = 23%
B) marginal tax rate = 17%; average tax rate = 21%
C) marginal tax rate = 38%; average tax rate = 24%
D) marginal tax rate = 23%; average tax rate = 38%
Question
Question
Question
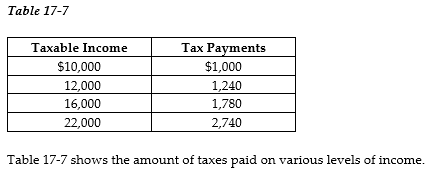
-Refer to Table 17-7. The tax system is
A) progressive throughout all levels of income.
B) proportional throughout all levels of income.
C) regressive throughout all levels of income.
D) progressive between $10,000 and $12,000 of income and regressive between $16,000 and $22,000.
Question
Question
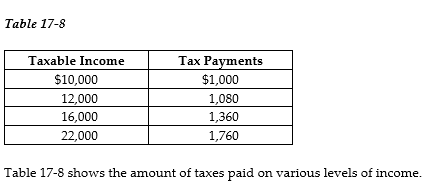
-Refer to Table 17-8. The tax system is
A) progressive throughout all levels of income.
B) proportional throughout all levels of income.
C) regressive throughout all levels of income.
D) progressive between $10,000 and $12,000 of income and regressive between $12,000 and $22,000.
Question
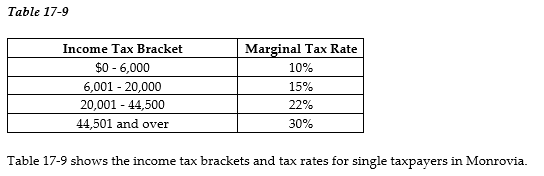
-Refer to Table 17-9. How much income tax does Sylvia pay if she is a single taxpayer with an income of $70,000?
A) $21,000
B) $15,740
C) $15,400
D) $13,475
Question
-Refer to Table 17-9. Sylvia is a single taxpayer with an income of $70,000. What is her marginal tax rate and what is her average tax rate?
A) marginal tax rate = 30%; average tax rate = 30%
B) marginal tax rate = 8%; average tax rate = 19.3%
C) marginal tax rate = 30%; average tax rate = 22.5%
D) marginal tax rate = 20%; average tax rate = 30%
Question
Question
Question
Question
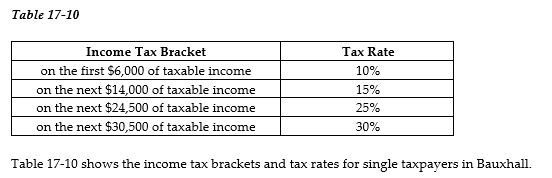
-Refer to Table 17-10. A tax exemption is granted for the first $10,000 earned per year. Suppose you earn $75,000.
a. What is the amount of taxes you will pay?
b. What is your average tax rate?
c. What is your marginal tax rate?
Question
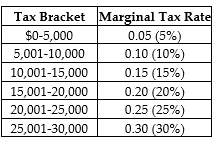
Last year, Anthony Millanti earned exactly $30,000 of taxable income. Assume that the income tax system used to determine Anthony's tax liability is progressive. The table below lists the tax brackets and the marginal tax rates that apply to each bracket.
a. Draw a new table that lists the amounts of income tax that Anthony is obligated to pay for each tax bracket, and the total tax he owes the government. (Assume that there are no allowable tax deductions, tax credits, personal exemptions, or any other deductions that Anthony can use to reduce his tax liability).
b. Determine Anthony's average tax rate.
Question
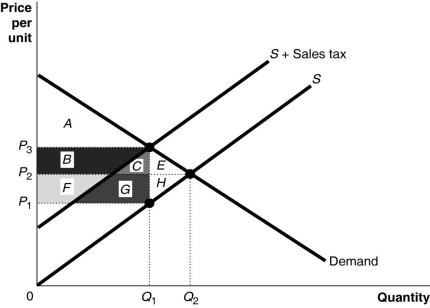
-Refer to Figure 17-1. The sales tax revenue collected by the government is represented by the area
A) B + C.
B) F + G.
C) E + H.
D) B + C + F + G.
Question
-Refer to Figure 17-1. Of the tax revenue collected by the government, the portion borne by consumers is represented by the area
A) B + C.
B) F + G.
C) E + H.
D) B + C + F + G.
Question
-Refer to Figure 17-1. Of the tax revenue collected by the government, the portion borne by producers is represented by the area
A) B + C.
B) F + G.
C) E + H.
D) B + C + F + G.
Question
-Refer to Figure 17-1. The excess burden of the tax is represented by the area
A) B + C.
B) F + G.
C) E + H.
D) B + C + F + G.
Question
-Refer to Figure 17-1. Area B + C + F + G represents
A) the portion of sales tax revenue borne by consumers.
B) the portion of sales tax revenue borne by producers.
C) the excess burden of the sales tax.
D) sales tax revenue collected by the government.
Question
-Refer to Figure 17-1. Area B + C represents
A) the portion of sales tax revenue borne by consumers.
B) the portion of sales tax revenue borne by producers.
C) the excess burden of the sales tax.
D) sales tax revenue collected by the government.
Question
-Refer to Figure 17-1. Area F + G represents
A) the portion of sales tax revenue borne by consumers.
B) the portion of sales tax revenue borne by producers.
C) the excess burden of the sales tax.
D) sales tax revenue collected by the government.
Question
-Refer to Figure 17-1. Area E + H represents
A) the portion of sales tax revenue borne by consumers.
B) the portion of sales tax revenue borne by producers.
C) the excess burden of the sales tax.
D) sales tax revenue collected by the government.
Question
Question
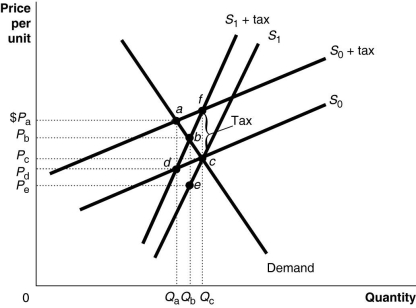
Figure 17-2 shows a demand curve and two sets of supply curves, one set more elastic than the other.
-Refer to Figure 17-2. If the government imposes an excise tax of $1.00 on every unit sold, the consumer's burden of the tax
A) is Pa - Pc under either supply curve.
B) is Pb - Pc under either supply curve.
C) is Pa - Pc if the supply curve is S0 and Pb - Pc if the supply curve is S1.
D) is Pa - Pd if the supply curve is S0 and Pb - Pe if the supply curve is S1.
Question
Figure 17-2 shows a demand curve and two sets of supply curves, one set more elastic than the other.
-Refer to Figure 17-2. If the government imposes an excise tax of $1.00 on every unit sold, the consumer's burden of the tax
A) is greater under the more elastic supply curve S0.
B) is greater under the less elastic supply curve S0.
C) is greater under the less elastic supply curve S1.
D) is the same under either supply curve because there is a single demand curve that captures buyers' market behavior.
Question
Figure 17-2 shows a demand curve and two sets of supply curves, one set more elastic than the other.
-Refer to Figure 17-2. If the government imposes an excise tax of $1.00 on every unit sold, the producer's burden of the tax
A) is Pa - Pd under either supply curve.
B) is Pb - Pe under either supply curve.
C) is Pa - Pd if the supply curve is S0 and Pb - Pe if the supply curve is S1.
D) is Pc - Pd if the supply curve is S0 and Pc - Pe if the supply curve is S1.
Question
Figure 17-2 shows a demand curve and two sets of supply curves, one set more elastic than the other.
-Refer to Figure 17-2. If the government imposes an excise tax of $1.00 on every unit sold, the producer's burden of the tax
A) is greater under the more elastic supply curve S0.
B) is greater under the less elastic supply curve S0.
C) is greater under the less elastic supply curve S1.
D) is the same under either supply curve because there is a single demand curve that captures buyers' market behavior.
Question
Figure 17-2 shows a demand curve and two sets of supply curves, one set more elastic than the other.
-Refer to Figure 17-2. If the government imposes an excise tax of $1.00 on every unit sold, the government's revenue from the tax is represented by the area
A) (PaPc × Qa) if the supply curve is S0 and (PbPc × Qb) if the supply curve is S1.
B) (PaPd × Qa) if the supply curve is S0 and (PbPe × Qb) if the supply curve is S1.
C) (PaPe × Qa) under either supply curve.
D) (PbPe × Qb) under either supply curve.
Question
Figure 17-2 shows a demand curve and two sets of supply curves, one set more elastic than the other.
-Refer to Figure 17-2. If the government imposes an excise tax of $1.00 on every unit sold, the government's revenue from the tax
A) is larger if the supply curve is S0.
B) is larger if the supply curve is S1.
C) is identical under either supply curve.
D) is not maximized.
Question
Figure 17-2 shows a demand curve and two sets of supply curves, one set more elastic than the other.
-Refer to Figure 17-2. If the government imposes an excise tax of $1.00 on every unit sold, what is the size of the deadweight loss, if there is any?
A) the area adc if the supply curve is S0 and the area bec if the supply curve is S1.
B) the area afcd if the supply curve is S0 and the area bfce if the supply curve is S1.
C) the area becf under either supply curve.
D) There is no deadweight loss; revenue raised is used to fund government projects.
Question
Figure 17-2 shows a demand curve and two sets of supply curves, one set more elastic than the other.
-Refer to Figure 17-2. If the government imposes an excise tax of $1.00 on every unit sold
A) the deadweight loss is identical under either supply curve.
B) the deadweight loss is greater under the supply curve S1.
C) the deadweight loss is greater under the supply curve S0.
D) there is no deadweight loss since revenue raised is used to fund government projects.
Question
Question
Question
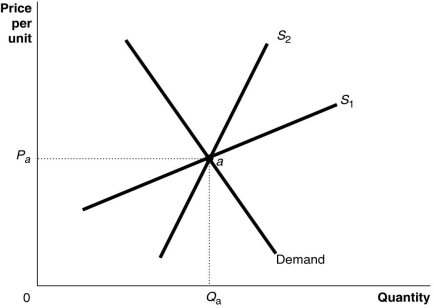
-Refer to Figure 17-3. The figure above shows a demand curve and two supply curves, one more elastic than the other. Use Figure 17-3 to answer the following questions.
a. Suppose the government imposes an excise tax of $1.00 on every unit sold. Use the graph to illustrate the impact of this tax when the supply curve is S1 and when the supply curve is S2.
b. If the government imposes an excise tax of $1.00 on every unit sold, will the consumer pay more of the tax if the supply curve is S1 or S2? Refer to the graphs in your answer.
c. If an excise tax of $1.00 on every unit sold is imposed, will the revenue collected by the government be greater if the supply curve is S1 or S2?
d. If the government imposes an excise tax of $1.00 on every unit sold, will the deadweight loss be greater if the supply curve is S1 or S2?
Question
Question
Question
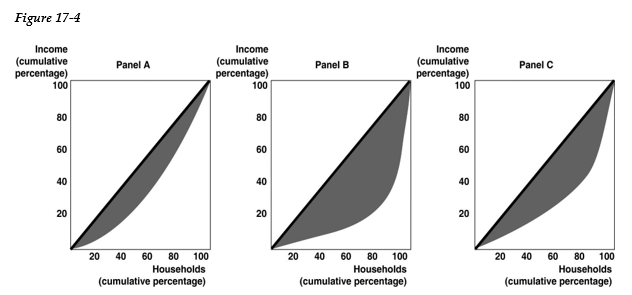
-Refer to Figure 17-4. Rank the above panels in terms of most unequal income distribution to least unequal income distribution.
A) Panel A, Panel B, Panel C
B) Panel B, Panel C, Panel A
C) Panel A, Panel C, Panel B
D) Panel C, Panel B, Panel A
Question

Figure 17-5 shows the Lorenz curve for a hypothetical country.
-Refer to Figure 17-5. The middle 20 percent of households
A) earn 20 percent of the society's total income.
B) earn 36 percent of the society's total income.
C) earn 48 percent of the society's total income.
D) earn 50 percent of the society's total income.
Question
Figure 17-5 shows the Lorenz curve for a hypothetical country.
-Refer to Figure 17-5. The highest 20 percent of households
A) earn 24 percent of the society's total income.
B) earn 28 percent of the society's total income.
C) earn 42 percent of the society's total income.
D) earn 72 percent of the society's total income.
Question
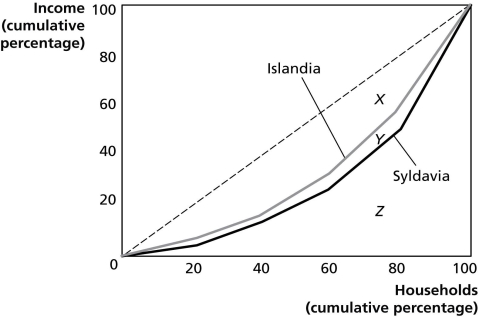
Figure 17-6 shows the Lorenz curves for Islandia and Syldavia.
-Refer to Figure 17-6. Which country has the more unequal distribution of income?
A) Islandia
B) Syldavia
C) They may have the same absolute income distribution although their relative income distribution is different.
D) There is insufficient information to answer the question.
Question
Figure 17-6 shows the Lorenz curves for Islandia and Syldavia.
-Refer to Figure 17-6. If area X = 2,060, area Y = 240, and area Z = 2,700, calculate the Gini coefficient for Islandia.
A) 0.41
B) 0.45
C) 0.70
D) 0.76
Question
Figure 17-6 shows the Lorenz curves for Islandia and Syldavia.
-Refer to Figure 17-6. If area X = 2,060, area Y = 240, and area Z= 2,700, calculate the Gini coefficient for Syldavia.
A) 0.05
B) 0.12
C) 0.46
D) 0.85
Question
Question
Question
Question
Question
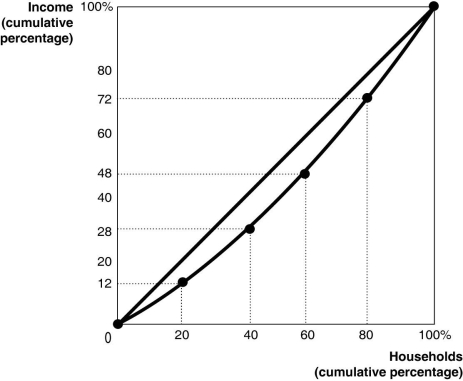
Figure 17-7 shows the Lorenz curve for a hypothetical country.
-Refer to Figure 17-7. The second lowest 20 percent of households
A) earn 12 percent of the society's total income.
B) earn 16 percent of the society's total income.
C) earn 28 percent of the society's total income.
D) earn 40 percent of the society's total income.
Question
Figure 17-7 shows the Lorenz curve for a hypothetical country.
-Refer to Figure 17-7. The second highest 20 percent of households
A) earn 24 percent of the society's total income.
B) earn 28 percent of the society's total income.
C) earn 42 percent of the society's total income.
D) earn 72 percent of the society's total income.
Question
Question
Question
Question
Question
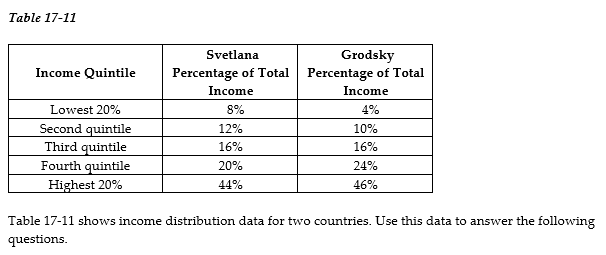
-Refer to Table 17-11.
a. Draw a Lorenz curve for each country.
b. Which country has the more equal distribution of income?
c. Based on the Lorenz curves for the two countries, can you determine which country has the more progressive tax system? Explain your answer.
Question
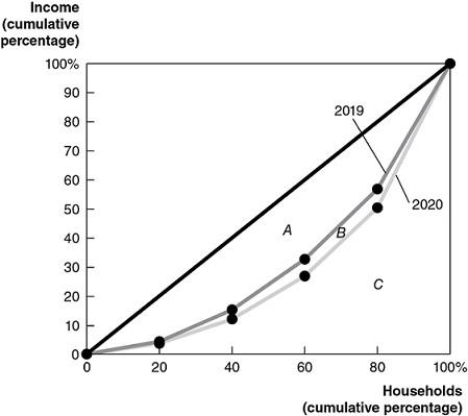
-Refer to Figure 17-8 to answer the following questions.
a. Did the distribution of income become more equal in 2020 than it was in 2019, or did it become less equal? Explain.
b. If area A = 1,900, area B = 450, and area C = 2,650, calculate the Gini coefficient for 2019 and the Gini coefficient for 2020.
Question
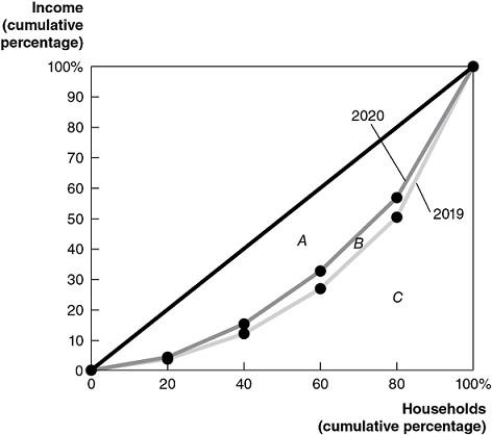
-Refer to Figure 17-9 to answer the following questions.
a. Did the distribution of income become more equal in 2020 that it was in 2019, or did it become less equal? Explain.
b. If area A = 1,600, area B = 200, and area C = 3,200, calculate the Gini coefficient for 2019 and the Gini coefficient for 2020.
Question
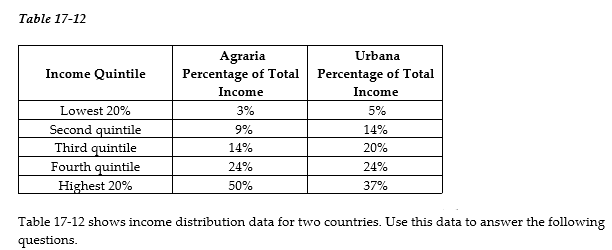
-Refer to Table 17-12.
a. Draw a Lorenz curve for each country.
b. Which country has the more equal distribution of income?
c. Based on the Lorenz curves for the two countries, can you determine which country has the more progressive tax system? Explain your answer.

Unlock Deck
Sign up to unlock the cards in this deck!
Unlock Deck
Unlock Deck
1/69
Play
Full screen (f)
Deck 17: Public Choice, Taxes, and the Distribution of Income
1
Prior to the passage of the Tax Cuts and Jobs Act of 2017, the owners of sole proprietorships would pay ________ on their profits.
A) the corporate income tax
B) the federal personal income tax
C) the progressive excise tax
D) no tax
A) the corporate income tax
B) the federal personal income tax
C) the progressive excise tax
D) no tax
the federal personal income tax
2
When Congress and President Trump enacted the Tax Cuts and Jobs Act of 2017, they
A) raised the top corporate income tax rate from 12 percent to 21 percent and cut the highest personal tax rate from 39.6 percent to 21 percent.
B) cut the top corporate income tax rate from 35 percent to 10 percent and raised the top rate for "income pass-through businesses" from 12 percent to 39.6 percent.
C) cut personal income tax rates and raised corporate income tax rates.
D) cut the top corporate income tax rate from 35 percent to 21 percent.
cut the top corporate income tax rate from 35 percent to 21 percent.
3
Suppose $1 billion is available in the budget and Congress is considering allocating the funds to one of the following three alternatives: 1) Subsidies for education, 2) Research on Alzheimer's or 3) Increased border security. Table 17-1 shows three voters' rankings of the alternatives.
-Refer to Table 17-1. Suppose a series of votes are taken in which each pair of alternatives is considered in turn. If the vote is between allocating funds to subsidies for education and research on Alzheimer's
A) Ivy and Jasmine vote for education subsidies, Rose votes for Alzheimer's research, and education subsidies wins.
B) Ivy and Rose vote for education subsidies, Jasmine votes for Alzheimer's research, and education subsidies wins.
C) Jasmine and Rose vote for Alzheimer's research, Ivy votes for education subsidies, and Alzheimer's research wins.
D) Jasmine and Ivy vote for Alzheimer's research, Rose votes for education subsidies, and Alzheimer's research wins.
Ivy and Rose vote for education subsidies, Jasmine votes for Alzheimer's research, and education subsidies wins.
4
Suppose $1 billion is available in the budget and Congress is considering allocating the funds to one of the following three alternatives: 1) Subsidies for education, 2) Research on Alzheimer's or 3) Increased border security. Table 17-1 shows three voters' rankings of the alternatives.
-Refer to Table 17-1. Suppose a series of votes are taken in which each pair of alternatives is considered in turn. If the vote is between allocating funds to research on Alzheimer's and increased border security
A) Ivy and Jasmine vote for Alzheimer's research, Rose votes for increased border security, and Alzheimer's research wins.
B) Ivy and Rose vote for increased border security, Jasmine votes for Alzheimer's research, and increased border security wins.
C) Jasmine and Rose vote for Alzheimer's research, Ivy votes for increased border security, and Alzheimer's research wins.
D) Jasmine and Ivy vote for increased border security, Rose votes for Alzheimer's research, and increased border security wins.
Unlock Deck
Unlock for access to all 69 flashcards in this deck.
Unlock Deck
k this deck
5
Suppose $1 billion is available in the budget and Congress is considering allocating the funds to one of the following three alternatives: 1) Subsidies for education, 2) Research on Alzheimer's or 3) Increased border security. Table 17-1 shows three voters' rankings of the alternatives.
-Refer to Table 17-1. Suppose a series of votes are taken in which each pair of alternatives is considered in turn. If the vote is between allocating funds to education subsidies and increased border security
A) Ivy and Jasmine vote for education subsidies, Rose votes for increased border security, and education subsidies wins.
B) Ivy and Rose vote for increased border security, Jasmine votes for education subsidies, and increased border security wins.
C) Jasmine and Rose vote for education subsidies, Rose votes for increased border security, and education subsidies wins.
D) Jasmine and Ivy vote for increased border security, Rose votes for education subsidies, and increased border security wins.
Unlock Deck
Unlock for access to all 69 flashcards in this deck.
Unlock Deck
k this deck
6
Suppose $1 billion is available in the budget and Congress is considering allocating the funds to one of the following three alternatives: 1) Subsidies for education, 2) Research on Alzheimer's or 3) Increased border security. Table 17-1 shows three voters' rankings of the alternatives.
-Refer to Table 17-1. Suppose a series of votes are taken in which each pair of alternatives is considered in turn. The first pair considered is between subsidies for education and research on Alzheimer's. The second pair considered is between Alzheimer's research and increased border security. The third pair considered is between education subsidies and increased border security. In this case, the collective preferences of the voters
A) turn out to be transitive and will yield a consistent outcome.
B) turn out to be transitive but will not result in a consistent outcome.
C) turn out not to be transitive and will not result in a consistent outcome.
D) turn out not to be transitive but will yield a consistent outcome.
Unlock Deck
Unlock for access to all 69 flashcards in this deck.
Unlock Deck
k this deck
7
-Refer to Table 17-2. The table above lists three policy alternatives that the U.S. Senate will vote on, along with the ranking of these alternates. The Senate must decide which of these alternatives should receive an additional $1 billion of funding, and there is enough money in the federal budget for only one of these alternatives. If a series of votes is taken in which each pair of alternatives is considered (homeland security and education; homeland security and medical research; education and medical research) which of the following will result from these votes?
A) When the vote is between homeland security and education, the Senators will vote for education to receive funding.
B) The Senators' votes will demonstrate transitivity.
C) The results will illustrate the voting paradox.
D) The results from the voting will illustrate the median voter theorem.
Unlock Deck
Unlock for access to all 69 flashcards in this deck.
Unlock Deck
k this deck
8
Is a typical person likely to gather more information when buying a new computer or when voting for a member of the U.S. Senate? Why?
Unlock Deck
Unlock for access to all 69 flashcards in this deck.
Unlock Deck
k this deck
9
-Refer to Table 17-3. The table above outlines the rankings of three members of the U.S. Senate on three spending alternatives. Assume that Congress can spend additional revenue on only one of the three spending alternatives and that Bart, Lisa, and Maggie, all members of the Senate, participate in a series of votes in which they are to determine which of the spending alternatives should receive funding. Three votes will be taken: (1) Immigration Reform and Unemployment Benefits (2) Immigration Reform and Social Security Reform and (3) Unemployment Benefits and Social Security Reform.
Show the results of each vote and determine whether the voting paradox will occur as a result of these votes.
Unlock Deck
Unlock for access to all 69 flashcards in this deck.
Unlock Deck
k this deck
10
-Refer to Table 17-4. The table above outlines the rankings of three members of the U.S. House of Representatives on three spending alternatives. Assume that Congress can spend additional revenue on only one of the three spending alternatives and that Tom, Dick, and Harriet, all members of the House of Representatives, participate in a series of votes in which they are to determine which of the spending alternatives should receive funding. Three votes will be taken: (1) Foreign Aid and Post-Secondary Education (2) Foreign Aid and Roads and Bridges and (3) Post-Secondary Education and Roads and Bridges.
Determine whether the voting paradox will occur as a result of these votes.
Unlock Deck
Unlock for access to all 69 flashcards in this deck.
Unlock Deck
k this deck
11
If you pay $2,000 in taxes on an income of $20,000, and a tax of $3,000 on an income of $30,000, then over this range of income the tax is
A) regressive.
B) proportional.
C) progressive.
D) There is insufficient information to answer the question.
A) regressive.
B) proportional.
C) progressive.
D) There is insufficient information to answer the question.
Unlock Deck
Unlock for access to all 69 flashcards in this deck.
Unlock Deck
k this deck
12
If you pay $2,000 in taxes on an income of $20,000, and a tax of $3,500 on an income of $30,000, then over this range of income the tax is
A) regressive.
B) proportional.
C) progressive.
D) There is insufficient information to answer the question.
A) regressive.
B) proportional.
C) progressive.
D) There is insufficient information to answer the question.
Unlock Deck
Unlock for access to all 69 flashcards in this deck.
Unlock Deck
k this deck
13
-Refer to Table 17-5. The tax system is
A) progressive throughout all levels of income.
B) proportional throughout all levels of income.
C) regressive throughout all levels of income.
D) regressive between $20,000 and $25,000 of income and progressive between $32,000 and $42,000.
Unlock Deck
Unlock for access to all 69 flashcards in this deck.
Unlock Deck
k this deck
14
-Refer to Table 17-6. How much income tax does Sasha pay if she is a single taxpayer with an income of $60,000?
A) $22,800
B) $14,400
C) $13,800
D) $13,642
Unlock Deck
Unlock for access to all 69 flashcards in this deck.
Unlock Deck
k this deck
15
-Refer to Table 17-6. Sasha is a single taxpayer with an income of $60,000. What is his marginal tax rate and what is his average tax rate?
A) marginal tax rate = 38%; average tax rate = 23%
B) marginal tax rate = 17%; average tax rate = 21%
C) marginal tax rate = 38%; average tax rate = 24%
D) marginal tax rate = 23%; average tax rate = 38%
Unlock Deck
Unlock for access to all 69 flashcards in this deck.
Unlock Deck
k this deck
16
In 2018, over 80 percent of the revenue of the U.S. federal government was raised through
A) individual income and social insurance taxes.
B) property and social insurance taxes.
C) sales and corporate income taxes.
D) individual income and property taxes.
A) individual income and social insurance taxes.
B) property and social insurance taxes.
C) sales and corporate income taxes.
D) individual income and property taxes.
Unlock Deck
Unlock for access to all 69 flashcards in this deck.
Unlock Deck
k this deck
17
Of the following sources of tax revenue for state and local governments, which was the smallest in 2018?
A) sales taxes.
B) the corporate income tax.
C) the property tax.
D) the individual income tax.
A) sales taxes.
B) the corporate income tax.
C) the property tax.
D) the individual income tax.
Unlock Deck
Unlock for access to all 69 flashcards in this deck.
Unlock Deck
k this deck
18
-Refer to Table 17-7. The tax system is
A) progressive throughout all levels of income.
B) proportional throughout all levels of income.
C) regressive throughout all levels of income.
D) progressive between $10,000 and $12,000 of income and regressive between $16,000 and $22,000.
Unlock Deck
Unlock for access to all 69 flashcards in this deck.
Unlock Deck
k this deck
19
According to projections for 2019 by the Tax Policy Center, the 20 percent of U.S. taxpayers who make the highest incomes
A) use loopholes and tax exemptions to reduce their share of federal income taxes to less than 20 percent.
B) pay about 67 percent of federal income taxes.
C) pay about 92 percent of federal income taxes but only about 20 percent of Social Security and Medicare payroll taxes.
D) pay more in excise and other taxes than they pay in Social Security and Medicare payroll taxes.
Unlock Deck
Unlock for access to all 69 flashcards in this deck.
Unlock Deck
k this deck
20
-Refer to Table 17-8. The tax system is
A) progressive throughout all levels of income.
B) proportional throughout all levels of income.
C) regressive throughout all levels of income.
D) progressive between $10,000 and $12,000 of income and regressive between $12,000 and $22,000.
Unlock Deck
Unlock for access to all 69 flashcards in this deck.
Unlock Deck
k this deck
21
-Refer to Table 17-9. How much income tax does Sylvia pay if she is a single taxpayer with an income of $70,000?
A) $21,000
B) $15,740
C) $15,400
D) $13,475
Unlock Deck
Unlock for access to all 69 flashcards in this deck.
Unlock Deck
k this deck
22
-Refer to Table 17-9. Sylvia is a single taxpayer with an income of $70,000. What is her marginal tax rate and what is her average tax rate?
A) marginal tax rate = 30%; average tax rate = 30%
B) marginal tax rate = 8%; average tax rate = 19.3%
C) marginal tax rate = 30%; average tax rate = 22.5%
D) marginal tax rate = 20%; average tax rate = 30%
Unlock Deck
Unlock for access to all 69 flashcards in this deck.
Unlock Deck
k this deck
23
A wealth tax like the one proposed by Senator Elizabeth Warren would perform best in meeting which of the following principles?
A) the benefits-received principle
B) the social equity principle
C) the ability-to-pay principle
D) the horizontal-equity principle
A) the benefits-received principle
B) the social equity principle
C) the ability-to-pay principle
D) the horizontal-equity principle
Unlock Deck
Unlock for access to all 69 flashcards in this deck.
Unlock Deck
k this deck
24
Perhaps the greatest efficiency loss from a wealth tax would result from the ________ as a result of the tax.
A) disincentive to accumulate wealth
B) decrease in spending
C) decrease in charitable giving
D) increase in spending on capital
A) disincentive to accumulate wealth
B) decrease in spending
C) decrease in charitable giving
D) increase in spending on capital
Unlock Deck
Unlock for access to all 69 flashcards in this deck.
Unlock Deck
k this deck
25
In 2018, which type of tax raised the most revenue for the U.S. federal government? Which type of tax raised the most revenue for state and local governments?
Unlock Deck
Unlock for access to all 69 flashcards in this deck.
Unlock Deck
k this deck
26
-Refer to Table 17-10. A tax exemption is granted for the first $10,000 earned per year. Suppose you earn $75,000.
a. What is the amount of taxes you will pay?
b. What is your average tax rate?
c. What is your marginal tax rate?
Unlock Deck
Unlock for access to all 69 flashcards in this deck.
Unlock Deck
k this deck
27
Last year, Anthony Millanti earned exactly $30,000 of taxable income. Assume that the income tax system used to determine Anthony's tax liability is progressive. The table below lists the tax brackets and the marginal tax rates that apply to each bracket.
a. Draw a new table that lists the amounts of income tax that Anthony is obligated to pay for each tax bracket, and the total tax he owes the government. (Assume that there are no allowable tax deductions, tax credits, personal exemptions, or any other deductions that Anthony can use to reduce his tax liability).
b. Determine Anthony's average tax rate.
a. Draw a new table that lists the amounts of income tax that Anthony is obligated to pay for each tax bracket, and the total tax he owes the government. (Assume that there are no allowable tax deductions, tax credits, personal exemptions, or any other deductions that Anthony can use to reduce his tax liability).
b. Determine Anthony's average tax rate.
Unlock Deck
Unlock for access to all 69 flashcards in this deck.
Unlock Deck
k this deck
28
-Refer to Figure 17-1. The sales tax revenue collected by the government is represented by the area
A) B + C.
B) F + G.
C) E + H.
D) B + C + F + G.
Unlock Deck
Unlock for access to all 69 flashcards in this deck.
Unlock Deck
k this deck
29
-Refer to Figure 17-1. Of the tax revenue collected by the government, the portion borne by consumers is represented by the area
A) B + C.
B) F + G.
C) E + H.
D) B + C + F + G.
Unlock Deck
Unlock for access to all 69 flashcards in this deck.
Unlock Deck
k this deck
30
-Refer to Figure 17-1. Of the tax revenue collected by the government, the portion borne by producers is represented by the area
A) B + C.
B) F + G.
C) E + H.
D) B + C + F + G.
Unlock Deck
Unlock for access to all 69 flashcards in this deck.
Unlock Deck
k this deck
31
-Refer to Figure 17-1. The excess burden of the tax is represented by the area
A) B + C.
B) F + G.
C) E + H.
D) B + C + F + G.
Unlock Deck
Unlock for access to all 69 flashcards in this deck.
Unlock Deck
k this deck
32
-Refer to Figure 17-1. Area B + C + F + G represents
A) the portion of sales tax revenue borne by consumers.
B) the portion of sales tax revenue borne by producers.
C) the excess burden of the sales tax.
D) sales tax revenue collected by the government.
Unlock Deck
Unlock for access to all 69 flashcards in this deck.
Unlock Deck
k this deck
33
-Refer to Figure 17-1. Area B + C represents
A) the portion of sales tax revenue borne by consumers.
B) the portion of sales tax revenue borne by producers.
C) the excess burden of the sales tax.
D) sales tax revenue collected by the government.
Unlock Deck
Unlock for access to all 69 flashcards in this deck.
Unlock Deck
k this deck
34
-Refer to Figure 17-1. Area F + G represents
A) the portion of sales tax revenue borne by consumers.
B) the portion of sales tax revenue borne by producers.
C) the excess burden of the sales tax.
D) sales tax revenue collected by the government.
Unlock Deck
Unlock for access to all 69 flashcards in this deck.
Unlock Deck
k this deck
35
-Refer to Figure 17-1. Area E + H represents
A) the portion of sales tax revenue borne by consumers.
B) the portion of sales tax revenue borne by producers.
C) the excess burden of the sales tax.
D) sales tax revenue collected by the government.
Unlock Deck
Unlock for access to all 69 flashcards in this deck.
Unlock Deck
k this deck
36
A CBO study estimated that the excess burden from the corporate income tax ________ of the revenues raised by the tax. This estimate would make the corporate income tax ________ imposed by the federal government.
A) could equal more than half; one of the most inefficient taxes
B) equals about 25 percent; one of the most efficient taxes
C) equals less than 3 percent; the most efficient tax
D) equals more than 90 percent; the most inefficient tax
A) could equal more than half; one of the most inefficient taxes
B) equals about 25 percent; one of the most efficient taxes
C) equals less than 3 percent; the most efficient tax
D) equals more than 90 percent; the most inefficient tax
Unlock Deck
Unlock for access to all 69 flashcards in this deck.
Unlock Deck
k this deck
37
Figure 17-2 shows a demand curve and two sets of supply curves, one set more elastic than the other.
-Refer to Figure 17-2. If the government imposes an excise tax of $1.00 on every unit sold, the consumer's burden of the tax
A) is Pa - Pc under either supply curve.
B) is Pb - Pc under either supply curve.
C) is Pa - Pc if the supply curve is S0 and Pb - Pc if the supply curve is S1.
D) is Pa - Pd if the supply curve is S0 and Pb - Pe if the supply curve is S1.
Unlock Deck
Unlock for access to all 69 flashcards in this deck.
Unlock Deck
k this deck
38
Figure 17-2 shows a demand curve and two sets of supply curves, one set more elastic than the other.
-Refer to Figure 17-2. If the government imposes an excise tax of $1.00 on every unit sold, the consumer's burden of the tax
A) is greater under the more elastic supply curve S0.
B) is greater under the less elastic supply curve S0.
C) is greater under the less elastic supply curve S1.
D) is the same under either supply curve because there is a single demand curve that captures buyers' market behavior.
Unlock Deck
Unlock for access to all 69 flashcards in this deck.
Unlock Deck
k this deck
39
Figure 17-2 shows a demand curve and two sets of supply curves, one set more elastic than the other.
-Refer to Figure 17-2. If the government imposes an excise tax of $1.00 on every unit sold, the producer's burden of the tax
A) is Pa - Pd under either supply curve.
B) is Pb - Pe under either supply curve.
C) is Pa - Pd if the supply curve is S0 and Pb - Pe if the supply curve is S1.
D) is Pc - Pd if the supply curve is S0 and Pc - Pe if the supply curve is S1.
Unlock Deck
Unlock for access to all 69 flashcards in this deck.
Unlock Deck
k this deck
40
Figure 17-2 shows a demand curve and two sets of supply curves, one set more elastic than the other.
-Refer to Figure 17-2. If the government imposes an excise tax of $1.00 on every unit sold, the producer's burden of the tax
A) is greater under the more elastic supply curve S0.
B) is greater under the less elastic supply curve S0.
C) is greater under the less elastic supply curve S1.
D) is the same under either supply curve because there is a single demand curve that captures buyers' market behavior.
Unlock Deck
Unlock for access to all 69 flashcards in this deck.
Unlock Deck
k this deck
41
Figure 17-2 shows a demand curve and two sets of supply curves, one set more elastic than the other.
-Refer to Figure 17-2. If the government imposes an excise tax of $1.00 on every unit sold, the government's revenue from the tax is represented by the area
A) (PaPc × Qa) if the supply curve is S0 and (PbPc × Qb) if the supply curve is S1.
B) (PaPd × Qa) if the supply curve is S0 and (PbPe × Qb) if the supply curve is S1.
C) (PaPe × Qa) under either supply curve.
D) (PbPe × Qb) under either supply curve.
Unlock Deck
Unlock for access to all 69 flashcards in this deck.
Unlock Deck
k this deck
42
Figure 17-2 shows a demand curve and two sets of supply curves, one set more elastic than the other.
-Refer to Figure 17-2. If the government imposes an excise tax of $1.00 on every unit sold, the government's revenue from the tax
A) is larger if the supply curve is S0.
B) is larger if the supply curve is S1.
C) is identical under either supply curve.
D) is not maximized.
Unlock Deck
Unlock for access to all 69 flashcards in this deck.
Unlock Deck
k this deck
43
Figure 17-2 shows a demand curve and two sets of supply curves, one set more elastic than the other.
-Refer to Figure 17-2. If the government imposes an excise tax of $1.00 on every unit sold, what is the size of the deadweight loss, if there is any?
A) the area adc if the supply curve is S0 and the area bec if the supply curve is S1.
B) the area afcd if the supply curve is S0 and the area bfce if the supply curve is S1.
C) the area becf under either supply curve.
D) There is no deadweight loss; revenue raised is used to fund government projects.
Unlock Deck
Unlock for access to all 69 flashcards in this deck.
Unlock Deck
k this deck
44
Figure 17-2 shows a demand curve and two sets of supply curves, one set more elastic than the other.
-Refer to Figure 17-2. If the government imposes an excise tax of $1.00 on every unit sold
A) the deadweight loss is identical under either supply curve.
B) the deadweight loss is greater under the supply curve S1.
C) the deadweight loss is greater under the supply curve S0.
D) there is no deadweight loss since revenue raised is used to fund government projects.
Unlock Deck
Unlock for access to all 69 flashcards in this deck.
Unlock Deck
k this deck
45
State tax revenue from marijuana sales in Colorado have surpassed $1 billion since its legalization in 2014. Total sales from licensed retailers in Colorado have exceeded $6.5 billion since the state became the first to legalize recreational marijuana. Retail customers pay a 2.9% standard sales tax and a 15% state marijuana sales tax, on top of local taxes. In addition to paying for industry regulation and enforcement, state revenue is used used to fund several state initiatives, including a public school construction fund, youth drug use prevention, and affordable housing.
Source: Claire Hansen, "State Revenue from Pot Tops $1 Billion in Colorado," usnews.com, June 13, 2019.
-Refer to the Article Summary. Colorado taxes marijuana with a 2.9% standard sales tax and a 15% state marijuana sales tax, in addition to local taxes. All of these taxes are paid by consumers at the time of purchase. Does this necessarily mean that consumers bear 100 percent of the burden of these taxes?
A) Yes, the percentage of taxes paid by consumers represents the burden of the tax.
B) No, because consumers and producers always bear equal burdens of a tax.
C) No, the burden of a tax is always 100 percent on the producer.
D) No, the burden of the tax will depend on the elasticity of demand and supply.
Unlock Deck
Unlock for access to all 69 flashcards in this deck.
Unlock Deck
k this deck
46
State tax revenue from marijuana sales in Colorado have surpassed $1 billion since its legalization in 2014. Total sales from licensed retailers in Colorado have exceeded $6.5 billion since the state became the first to legalize recreational marijuana. Retail customers pay a 2.9% standard sales tax and a 15% state marijuana sales tax, on top of local taxes. In addition to paying for industry regulation and enforcement, state revenue is used used to fund several state initiatives, including a public school construction fund, youth drug use prevention, and affordable housing.
Source: Claire Hansen, "State Revenue from Pot Tops $1 Billion in Colorado," usnews.com, June 13, 2019.
-Refer to the Article Summary. Refer to the Article Summary. Colorado taxes marijuana with a 2.9% standard sales tax and a 15% state marijuana sales tax, in addition to local taxes. Assume local taxes total 7.1%, so the total tax is 25% based on the initial selling price. Suppose the actual burden of the tax falls 70 percent on consumers and 30 percent on producers. In this case, consumers will actually bear the tax burden of ________ percent of the selling price and producers will actually bear the tax burden of ________ percent of the selling price.
A) 17.5; 7.5
B) 75; 25
C) 15; 10
D) 70; 30
Unlock Deck
Unlock for access to all 69 flashcards in this deck.
Unlock Deck
k this deck
47
-Refer to Figure 17-3. The figure above shows a demand curve and two supply curves, one more elastic than the other. Use Figure 17-3 to answer the following questions.
a. Suppose the government imposes an excise tax of $1.00 on every unit sold. Use the graph to illustrate the impact of this tax when the supply curve is S1 and when the supply curve is S2.
b. If the government imposes an excise tax of $1.00 on every unit sold, will the consumer pay more of the tax if the supply curve is S1 or S2? Refer to the graphs in your answer.
c. If an excise tax of $1.00 on every unit sold is imposed, will the revenue collected by the government be greater if the supply curve is S1 or S2?
d. If the government imposes an excise tax of $1.00 on every unit sold, will the deadweight loss be greater if the supply curve is S1 or S2?
Unlock Deck
Unlock for access to all 69 flashcards in this deck.
Unlock Deck
k this deck
48
According to research by Jon Bakija, Adam Cole, and Bradley T. Heim, the occupation that makes up the largest group of the top 1 percent of income distribution in the United States is
A) doctors and other medical professionals.
B) lawyers.
C) financial professions.
D) non-finance executives.
A) doctors and other medical professionals.
B) lawyers.
C) financial professions.
D) non-finance executives.
Unlock Deck
Unlock for access to all 69 flashcards in this deck.
Unlock Deck
k this deck
49
An analysis from the Congressional Budget Office showed that the primary source of income of the top 1 percent of income earners is
A) capital gains.
B) family inheritance.
C) wages and salaries.
D) stock market trades.
A) capital gains.
B) family inheritance.
C) wages and salaries.
D) stock market trades.
Unlock Deck
Unlock for access to all 69 flashcards in this deck.
Unlock Deck
k this deck
50
-Refer to Figure 17-4. Rank the above panels in terms of most unequal income distribution to least unequal income distribution.
A) Panel A, Panel B, Panel C
B) Panel B, Panel C, Panel A
C) Panel A, Panel C, Panel B
D) Panel C, Panel B, Panel A
Unlock Deck
Unlock for access to all 69 flashcards in this deck.
Unlock Deck
k this deck
51
Figure 17-5 shows the Lorenz curve for a hypothetical country.
-Refer to Figure 17-5. The middle 20 percent of households
A) earn 20 percent of the society's total income.
B) earn 36 percent of the society's total income.
C) earn 48 percent of the society's total income.
D) earn 50 percent of the society's total income.
Unlock Deck
Unlock for access to all 69 flashcards in this deck.
Unlock Deck
k this deck
52
Figure 17-5 shows the Lorenz curve for a hypothetical country.
-Refer to Figure 17-5. The highest 20 percent of households
A) earn 24 percent of the society's total income.
B) earn 28 percent of the society's total income.
C) earn 42 percent of the society's total income.
D) earn 72 percent of the society's total income.
Unlock Deck
Unlock for access to all 69 flashcards in this deck.
Unlock Deck
k this deck
53
Figure 17-6 shows the Lorenz curves for Islandia and Syldavia.
-Refer to Figure 17-6. Which country has the more unequal distribution of income?
A) Islandia
B) Syldavia
C) They may have the same absolute income distribution although their relative income distribution is different.
D) There is insufficient information to answer the question.
Unlock Deck
Unlock for access to all 69 flashcards in this deck.
Unlock Deck
k this deck
54
Figure 17-6 shows the Lorenz curves for Islandia and Syldavia.
-Refer to Figure 17-6. If area X = 2,060, area Y = 240, and area Z = 2,700, calculate the Gini coefficient for Islandia.
A) 0.41
B) 0.45
C) 0.70
D) 0.76
Unlock Deck
Unlock for access to all 69 flashcards in this deck.
Unlock Deck
k this deck
55
Figure 17-6 shows the Lorenz curves for Islandia and Syldavia.
-Refer to Figure 17-6. If area X = 2,060, area Y = 240, and area Z= 2,700, calculate the Gini coefficient for Syldavia.
A) 0.05
B) 0.12
C) 0.46
D) 0.85
Unlock Deck
Unlock for access to all 69 flashcards in this deck.
Unlock Deck
k this deck
56
Absolute poverty measures vary from country to country. For example, in 2019, the poverty line in the United States for a family of four was an annual income of $25,750 but economists often use a much lower threshold income of $3.20 per day when calculating the rate of poverty in poor countries. Using this $3.20-per-day threshold, which of the following regions had the largest percentage decrease in the percentage of the population in poverty from 1990 to 2015?
A) Latin America
B) sub-Saharan Africa
C) East Asia
D) the Middle East and North Africa
A) Latin America
B) sub-Saharan Africa
C) East Asia
D) the Middle East and North Africa
Unlock Deck
Unlock for access to all 69 flashcards in this deck.
Unlock Deck
k this deck
57
Absolute poverty measures vary from country to country. For example, in 2019, the poverty line in the United States for a family of four was an annual income of $25,750 but economists often use a much lower threshold income of $3.20 per day when calculating the rate of poverty in poor countries. Using this $3.20-per-day threshold, which of the following regions had the smallest percentage decrease in the percentage of the population in poverty from 1990 to 2015?
A) Latin America
B) sub-Saharan Africa
C) East Asia
D) the Middle East and North Africa
A) Latin America
B) sub-Saharan Africa
C) East Asia
D) the Middle East and North Africa
Unlock Deck
Unlock for access to all 69 flashcards in this deck.
Unlock Deck
k this deck
58
Which of the following groups had the highest poverty rate in 2018 in the United States?
A) Asians
B) blacks
C) Hispanics
D) female heads of families
A) Asians
B) blacks
C) Hispanics
D) female heads of families
Unlock Deck
Unlock for access to all 69 flashcards in this deck.
Unlock Deck
k this deck
59
Income inequality in the United States has increased somewhat over the past 30 years. Two factors that appear to have contributed to this are
A) tax cuts on high-income individuals and large increases in prices of stocks.
B) strong economic growth and low inflation.
C) rapid technological change and expanding international trade.
D) outsourcing of jobs by U.S. firms and cuts in taxes on capital gains.
A) tax cuts on high-income individuals and large increases in prices of stocks.
B) strong economic growth and low inflation.
C) rapid technological change and expanding international trade.
D) outsourcing of jobs by U.S. firms and cuts in taxes on capital gains.
Unlock Deck
Unlock for access to all 69 flashcards in this deck.
Unlock Deck
k this deck
60
Figure 17-7 shows the Lorenz curve for a hypothetical country.
-Refer to Figure 17-7. The second lowest 20 percent of households
A) earn 12 percent of the society's total income.
B) earn 16 percent of the society's total income.
C) earn 28 percent of the society's total income.
D) earn 40 percent of the society's total income.
Unlock Deck
Unlock for access to all 69 flashcards in this deck.
Unlock Deck
k this deck
61
Figure 17-7 shows the Lorenz curve for a hypothetical country.
-Refer to Figure 17-7. The second highest 20 percent of households
A) earn 24 percent of the society's total income.
B) earn 28 percent of the society's total income.
C) earn 42 percent of the society's total income.
D) earn 72 percent of the society's total income.
Unlock Deck
Unlock for access to all 69 flashcards in this deck.
Unlock Deck
k this deck
62
Studies by the U.S. Census Bureau have shown that
A) families remain below the poverty line for an average of five years.
B) there is significant income mobility in the U.S. over time.
C) income mobility in the U.S. is minimal.
D) over half the people below the poverty line never move out of poverty.
A) families remain below the poverty line for an average of five years.
B) there is significant income mobility in the U.S. over time.
C) income mobility in the U.S. is minimal.
D) over half the people below the poverty line never move out of poverty.
Unlock Deck
Unlock for access to all 69 flashcards in this deck.
Unlock Deck
k this deck
63
The Gini coefficient for the United States in 1980 was 0.403. In 2018, the coefficient was equal to 0.486. This means that
A) per capita income in the United States rose from 1980 to 2018.
B) there was a decrease in the amount of government transfer payments from 1980 to 2018.
C) cuts in federal income tax rates in the early 1980s and 2001 helped to reduce income inequality.
D) income inequality increased from 1980 to 2018.
Unlock Deck
Unlock for access to all 69 flashcards in this deck.
Unlock Deck
k this deck
64
Between 1990 and 2015, the poverty rate in East Asia declined dramatically while the poverty rate in sub-Saharan Africa has seen much less of a decline. The main reason for this is that
A) the population growth rate decreased in East Asia and increased in sub-Saharan Africa.
B) Governments in East Asia increased transfer payments to poor families over this period of time. The governments of sub-Saharan Africa had practically no transfer payment programs from 1990 to 2015.
C) The countries of East Asia have progressive income tax systems. The countries of sub-Saharan Africa all have regressive income tax systems.
D) East Asia experienced higher economic growth than sub-Saharan Africa.
Unlock Deck
Unlock for access to all 69 flashcards in this deck.
Unlock Deck
k this deck
65
From 1990 to 2015, the poverty rate in East Asia rose slightly but the level of poverty in sub-Saharan Africa fell dramatically.
Unlock Deck
Unlock for access to all 69 flashcards in this deck.
Unlock Deck
k this deck
66
-Refer to Table 17-11.
a. Draw a Lorenz curve for each country.
b. Which country has the more equal distribution of income?
c. Based on the Lorenz curves for the two countries, can you determine which country has the more progressive tax system? Explain your answer.
Unlock Deck
Unlock for access to all 69 flashcards in this deck.
Unlock Deck
k this deck
67
-Refer to Figure 17-8 to answer the following questions.
a. Did the distribution of income become more equal in 2020 than it was in 2019, or did it become less equal? Explain.
b. If area A = 1,900, area B = 450, and area C = 2,650, calculate the Gini coefficient for 2019 and the Gini coefficient for 2020.
Unlock Deck
Unlock for access to all 69 flashcards in this deck.
Unlock Deck
k this deck
68
-Refer to Figure 17-9 to answer the following questions.
a. Did the distribution of income become more equal in 2020 that it was in 2019, or did it become less equal? Explain.
b. If area A = 1,600, area B = 200, and area C = 3,200, calculate the Gini coefficient for 2019 and the Gini coefficient for 2020.
Unlock Deck
Unlock for access to all 69 flashcards in this deck.
Unlock Deck
k this deck
69
-Refer to Table 17-12.
a. Draw a Lorenz curve for each country.
b. Which country has the more equal distribution of income?
c. Based on the Lorenz curves for the two countries, can you determine which country has the more progressive tax system? Explain your answer.
Unlock Deck
Unlock for access to all 69 flashcards in this deck.
Unlock Deck
k this deck
Unlock Deck
Unlock for access to all 69 flashcards in this deck.


