Deck 11: Technology, Production, and Costs
Full screen (f)
Question
Question
Question
Question
Question
Question
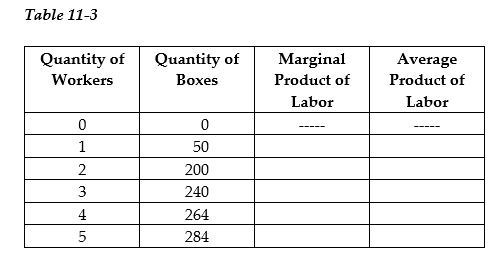
-Refer to Table 11-3. The table above refers to the relationship between the quantity of workers employed and the number of cardboard boxes produced per day by Manny's House of Boxes. The capital used to produce the boxes is fixed. The average product of labor will equal 66 boxes when Manny hires
A) the second worker.
B) the third worker.
C) the fourth worker.
D) the fifth worker.
Question
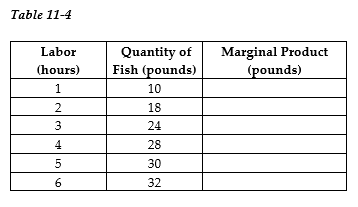
-Refer to Table 11-4. The table above shows the following relationship between hours spent fishing and the quantity of fish caught for Juan, a commercial fisherman.
a. Complete the Marginal Product column in Table 11-4.
b. Characterize the production function, i.e. does the production function display increasing marginal returns, diminishing marginal returns, etc.
c. Using the data above, graph Juan's marginal product curve. Be sure to label the horizontal and vertical axes. Is your graph consistent with your answer to part (b)? Explain.
d. Juan uses the following inputs for fishing - a small wooden boat (B), a fishing pole (P) and of course, his labor (L). Treating the boat and the fishing pole as fixed inputs and using the data above, graph Juan's Total Product of Labor curve. Be sure to label the horizontal and vertical axes.
e. The opportunity cost of Juan's time is $8 per hour. If Juan receives $2 per pound for his fish, what is the optimal number of hours he should spend fishing? Explain how you arrived at your answer. Hint: Recall marginal benefit and marginal cost analysis.
Question
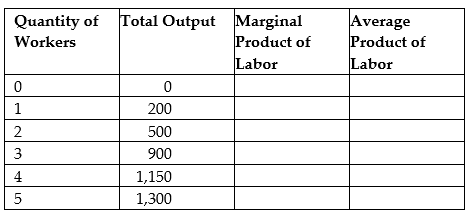
Fill in the missing values in the following table. Draw one graph showing how total output increases with the quantity of workers hired, and another graph showing the marginal product of labor and the average product of labor.
Question
Question
Question
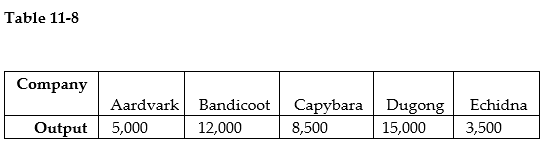
Table 11-8 represents the monthly output of five companies in the electric scooter manufacturing industry.
Minimum efficient scale in this industry is a monthly output of 27,000 electric scooters, and the industry
has a typical U-shaped long-run average cost curve with no constant returns to scale.
-Refer to Table 11-8. Which of these companies are on the downward-sloping portion of the long-run average cost curve?
A) only Aardvark and Echidna
B) only Dugong, Echidna, and Capybara
C) only Dugong and Bandicoot
D) all five companies
Question
Table 11-8 represents the monthly output of five companies in the electric scooter manufacturing industry.
Minimum efficient scale in this industry is a monthly output of 27,000 electric scooters, and the industry
has a typical U-shaped long-run average cost curve with no constant returns to scale.
-Refer to Table 11-8. Which of the following potential mergers would result in the new company experiencing diseconomies of scale?
A) Bandicoot merges with Dugong.
B) Bandicoot merges with Capybara and Echidna.
C) Dugong merges with Aardvark and Capybara.
D) Capybara merges with Aardvark and Echidna.
Question
Table 11-8 represents the monthly output of five companies in the electric scooter manufacturing industry.
Minimum efficient scale in this industry is a monthly output of 27,000 electric scooters, and the industry
has a typical U-shaped long-run average cost curve with no constant returns to scale.
-Refer to Table 11-8. Which of the following potential mergers would still result in the new company experiencing economies of scale?
A) Bandicoot merges with Dugong.
B) Bandicoot merges with Capybara, Aardvark, and Echidna.
C) Dugong merges with Echidna and Capybara.
D) Dugong merges with Aardvark and Echidna.
Question
Table 11-8 represents the monthly output of five companies in the electric scooter manufacturing industry.
Minimum efficient scale in this industry is a monthly output of 27,000 electric scooters, and the industry
has a typical U-shaped long-run average cost curve with no constant returns to scale.
-Refer to Table 11-8. Which of the following potential mergers would result in the new company achieving the minimum efficient scale?
A) Bandicoot merges with Capybara and Echidna.
B) Bandicoot merges with Capybara, Aardvark, and Echidna.
C) Dugong merges with Echidna and Capybara.
D) Dugong merges with Aardvark and Echidna.
Question
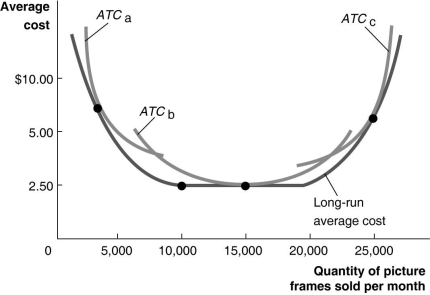
Figure 11-10 illustrates the long-run average cost curve for a firm that produces picture frames. The graph also includes short-run average cost curves for three firm sizes: ATCa, ATCb and ATCc.
-Refer to Figure 11-10. The minimum efficient scale of output is reached at what rate of output?
A) 10,000 workers
B) 5,000 picture frames
C) 20,000 picture frames
D) 10,000 picture frames
Question
Figure 11-10 illustrates the long-run average cost curve for a firm that produces picture frames. The graph also includes short-run average cost curves for three firm sizes: ATCa, ATCb and ATCc.
-Refer to Figure 11-10. For output rates greater than 20,000 picture frames per month
A) the firm will not make a profit because the average cost of production will be too high.
B) the firm will experience diseconomies of scale.
C) the firm will experience diminishing returns.
D) the short-run average total cost will equal the long-run average total cost of production.
Question
Figure 11-10 illustrates the long-run average cost curve for a firm that produces picture frames. The graph also includes short-run average cost curves for three firm sizes: ATCa, ATCb and ATCc.
-Refer to Figure 11-10. Constant returns to scale
A) occur for output rates greater than 5,000 picture frames.
B) occur between 5,000 and 20,000 picture frames per month.
C) occur between 10,000 and 20,000 pictures frames per month.
D) will shift the long-run average cost curve downward.
Question
Figure 11-10 illustrates the long-run average cost curve for a firm that produces picture frames. The graph also includes short-run average cost curves for three firm sizes: ATCa, ATCb and ATCc.
-Refer to Figure 11-10. In the short run, if the firm sells fewer than 5,000 picture frames per month
A) it should produce with the scale of operation associated with ATCa.
B) it should produce with the scale of operation associated with ATCb.
C) it should produce with the scale of operation associated with ATCc.
D) it will experience constant returns to scale.
Question
Figure 11-10 illustrates the long-run average cost curve for a firm that produces picture frames. The graph also includes short-run average cost curves for three firm sizes: ATCa, ATCb and ATCc.
-Refer to Figure 11-10. If the firm chooses to produce and sell 25,000 frames per month by operating in the short run with a scale operation represented by ATCc
A) the firm will not be operating efficiently.
B) the firm will be operating efficiently.
C) the firm would lower its average costs by reducing its scale of operation.
D) the firm will not be able to earn a profit.
Question
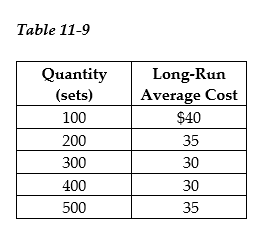
Elegant Settings manufactures stainless steel cutlery. Table 11-9 shows the company's cost data.
-Refer to Table 11-9. Elegant Settings experiences
A) economies of scale up to an output level of 400.
B) diminishing returns up to an output level of 400.
C) increasing returns beyond an output level of 400.
D) economies of scale at an output of 300 or less and diseconomies of scale at an output level above 400.
Question
Elegant Settings manufactures stainless steel cutlery. Table 11-9 shows the company's cost data.
-Refer to Table 11-9. What is the minimum efficient scale of production?
A) 100 units
B) 200 units
C) 300 units
D) 400 units
Question
Suppose Argyle Sachs has to choose between building a smaller sweater factory and a larger sweater factory. In the following graph, the relationship between costs and output for the smaller factory is represented by the curve ATC1, and the relationship between costs and output for the larger factory is represented by the curve ATC2.
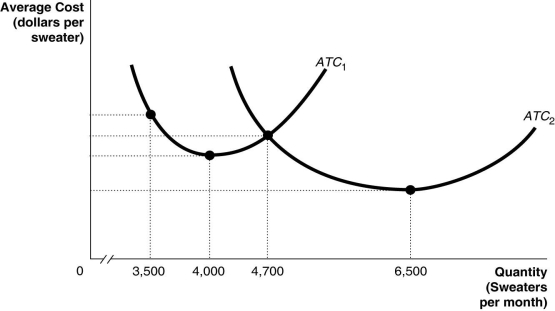
a. If Argyle expects to produce 3,600 sweaters per month, should he build a smaller factory or a larger factory? Briefly explain?
b. If Argyle expects to produce 5,000 sweaters per month, should he build a smaller factory or a larger factory? Briefly explain.
c. If the average cost of producing sweaters is lower in the larger factory when Argyle produces 6,500 sweaters per week, why isn't it also lower when Argyle produces 4,000 sweaters per week?
Question
Question
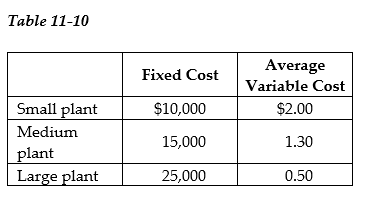
-Refer to Table 11-10. Clock It To Me manufactures clock radios. The table above shows estimates of fixed cost per period and average variable cost for three possible plant sizes.
a. You are employed as the company's cost accountant and have been asked to prepare cost estimates for various output levels for each of the three possible plant sizes. Record your calculations in the table below.
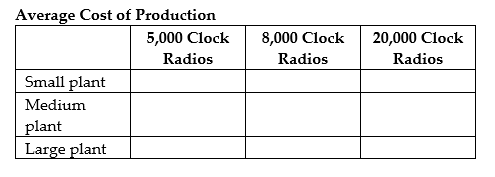
b. For each of the three output levels, which plant size will generate the lowest average total cost of production?
c. Suppose the firm currently sells 8,000 clock radios per period (using the optimal plant size for this output level). Now, however, it has just secured a long-term contract to supply 20,000 clock radios per period. In the short run, what is the average total cost of producing 20,000 clock radios? Provide a numerical value based on your answer in part a.
d. What happens to average total cost of production in the long run? Provide a numerical value based on your answer in part a.
Question
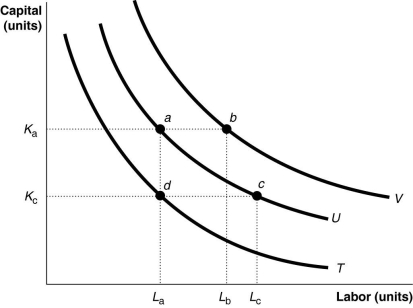
-Refer to Figure 11-11. The movement from isoquant T to isoquant U depicts
A) a change in preferences with regards to input usage.
B) an increase in the cost of production.
C) an increase in output.
D) an increase in labor usage holding capital and output constant.
Question
-Refer to Figure 11-11. Which of the following statements about the input combinations shown in the diagram is false?
A) The firm produces a higher output level when it uses input combination b compared to input combination a.
B) The firm produces a lower output level when it uses input combination d compared to input combination a.
C) The firm produces the same output level when it uses input combination a or c.
D) The firm incurs the same total cost when it uses input combination a or c to produce a given quantity of output.
Question
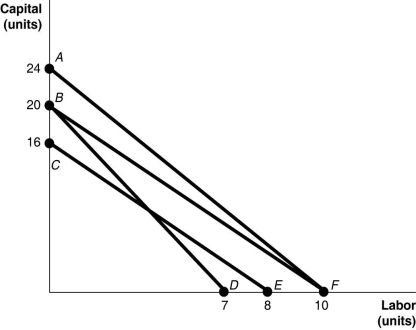
-Refer to Figure 11-12. The lines shown in the diagram are isocost lines. Which of the following shows an increase in the price of labor while the price of capital remains unchanged?
A) the movement from AF to BD
B) the movement from AF to CE
C) the movement from BF to BD
D) the movement from BF to CE
Question
-Refer to Figure 11-12. The lines shown in the diagram are isocost lines. Which of the following shows a decrease in the price of capital while the price of labor remains unchanged?
A) the movement from AF to BF
B) the movement from BF to AF
C) the movement from BF to BD
D) the movement from BF to CE
Question
-Refer to Figure 11-12. The lines shown in the diagram are isocost lines. Which of the following shows an increase in the firm's total cost while the price of labor and capital remain unchanged?
A) the movement from CE to BF
B) the movement from CE to AF
C) the movement from BD to AF
D) the movement from BD to CE
Question
-Refer to Figure 11-12. The lines shown in the diagram are isocost lines. A movement from CE to BD occurs when
A) the price of capital increases while the price of labor remains unchanged.
B) the price of labor decreases while the price of capital remains unchanged.
C) the price of capital increases while the price of labor decreases.
D) the price of capital decreases while the price of labor increases.
Question
-Refer to Figure 11-12. The lines shown in the diagram are isocost lines. If the price of labor is $50 per unit, then along the isocost AF, the total cost
A) is $500.
B) is $750.
C) is $1,250.
D) cannot be determined without the price of capital.
Question
-Refer to Figure 11-12. The lines shown in the diagram are isocost lines. If the price of labor is $50 per unit, what is the price of capital along the isocost CE?
A) $400 per unit
B) $100 per unit
C) $25 per unit
D) insufficient information to answer question
Question
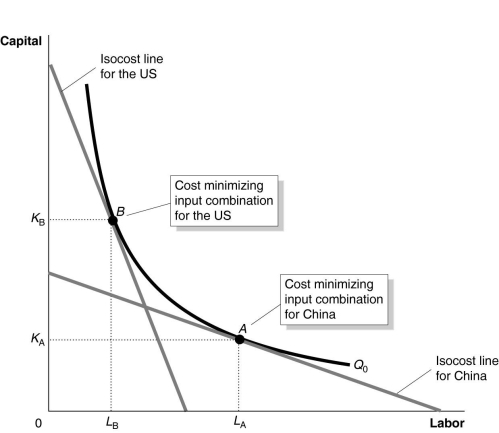
Figure 11-13 shows the optimal input combinations for the production of a given quantity of cotton in the United States and in China.
-Refer to Figure 11-13. Consider the following statements:
A. For each country, the marginal product per dollar spent on labor equals to the marginal product per dollar spent on capital.
B. The price of labor is relatively higher in the United States than in China and the price of capital is relatively lower in the United States than in China.
C. The price of labor and the price of capital are relatively higher in the United States than in China.
Based on the figure, which of the statements above is true?
A) All of the statements are true.
B) statements a and c only
C) statements a and b only
D) statements b and c only
Question
Figure 11-13 shows the optimal input combinations for the production of a given quantity of cotton in the United States and in China.
-Refer to Figure 11-13. Which of the following could explain why the United States and China use different input combinations to produce a given quantity of cotton and yet, each country produces that quantity at the lowest possible cost?
A) because the prices of inputs are not the same for the two countries: labor is relatively lower-priced and capital is relatively higher priced in the United States
B) because the prices of inputs are not the same for the two countries: labor is relatively lower-priced and capital is relatively higher priced in China
C) because the United States has more sophisticated technology and therefore is more efficient in cotton production
D) because the marginal product per dollar spent on capital yields a higher return in the United States than in China
Question
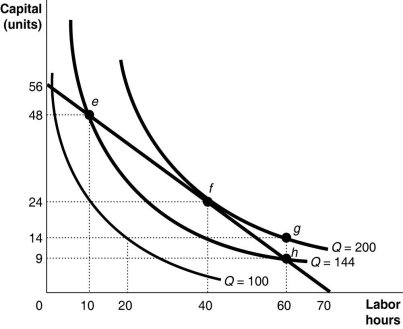
-Refer to Figure 11-14. What is the combination of inputs that produces 200 gooseberry pies at the lowest cost?
A) combination e: 10 hours of labor and 48 units of capital
B) combination f: 40 hours of labor and 24 units of capital
C) combination g: 60 hours of labor and 14 units of capital
D) combination h: 60 hours of labor and 9 units of capital
Question
-Refer to Figure 11-14. Suppose Hilda hires labor at $8 per hour and capital costs $10 per unit. What is the minimum cost of producing 200 gooseberry pies?
A) $3,600
B) $1,120
C) $592
D) $560
Question
-Refer to Figure 11-14. Suppose Hilda produces 100 gooseberry pies. What is the marginal rate of technical substitution of labor for capital when labor is increased from 10 to 20 hours?
A) 1 unit of capital per worker
B) 10 units of capital per worker
C) 14 units of capital per worker
D) 24 units of capital per worker
Question
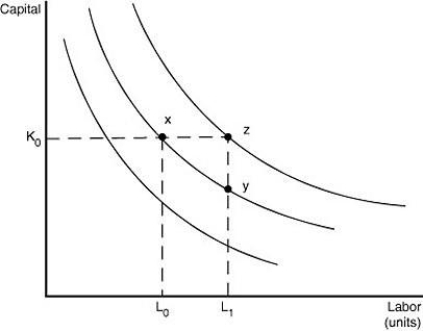
-Refer to Figure 11-15. The figure above illustrates a series of isoquants. Which of the following statements is true?
A) Points x, z, and y all represent the same output.
B) Points z and y represent the same output; this output is produced with more capital at z than at y.
C) Point x and y represent the same output but the cost of production at y is greater than the cost of production at x.
D) Point z represents a greater output than point x or point y.
Question
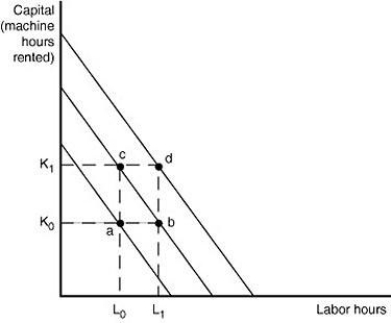
-Refer to Figure 11-16. Assume that production isoquants are convex. Total cost and output produced must increase for each of the following movements except one. Which movement is the exception?
A) point a to point b
B) point a to point c
C) point b to point c
D) point b to point d
Question
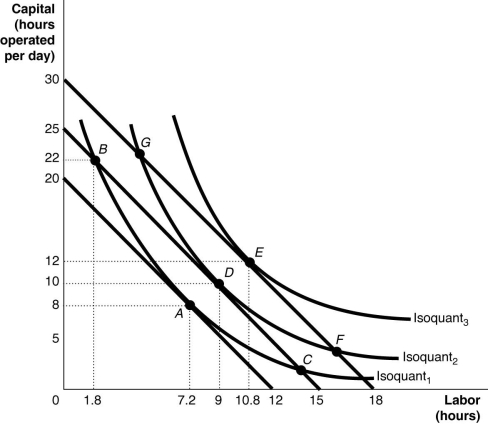
-Refer to Figure 11-17. Starting from point D, a movement along isoquant2 to point F
A) increases the total cost of production with no change in output.
B) increases output but not the total cost of production.
C) increases the total cost of production and decreases output.
D) increases both the total cost of production and output.
Question
-Refer to Figure 11-17. Starting from point E, a movement along the isocost to point F
A) decreases the total cost of production but not output.
B) increases the total cost of production and decreases output.
C) decreases both the total cost of production and output.
D) decreases output but not the total cost of production.
Question
-Refer to Figure 11-17. A curve that connects points A, D, and E is called
A) an input-output curve.
B) a total cost line.
C) an expansion path.
D) an indifference line.
Question
Use the following graph to answer the following questions.
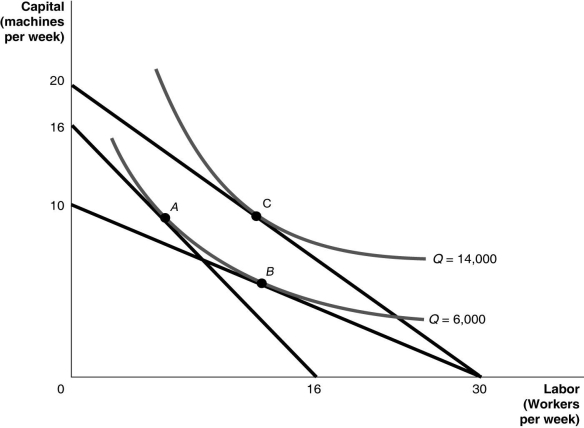
a. If the wage rate and the rental price of machines are both $50 and total cost is $800, is the cost-minimizing point A, B, or C?
b. If the wage rate is $40, the rental price of equipment is $120, and total cost is $1,200, is the cost-minimizing point A, B, or C?
c. If the wage rate is $60, the rental price of equipment is $90, and total cost is $1,800, is the cost-minimizing point A, B, or C?

Unlock Deck
Sign up to unlock the cards in this deck!
Unlock Deck
Unlock Deck
1/43
Play
Full screen (f)
Deck 11: Technology, Production, and Costs
1
Employment in the oil fields increased rapidly beginning in 2005, reaching a peak of between 100,000 and 110, 000 workers in 2012, where employment remained until early 2016. Then, employment began a rapid decline as oil prices dropped by more than half. By early 2019, oil prices had risen by almost 50 percent since 2016 and production had risen by more than 30 percent, but employment was almost 20 percent lower. Which of the following statements best describes this situation in the oil industry?
A) Since new technology was not used to drill existing oil wells, the operation of those wells did not constitute technological change. The only technological change occurred when new wells were drilled using new technology.
B) The scenario described in the question is not technological change because the oil companies still needed to hire employees to to operate machinery.
C) The oil companies were able to produce more output using fewer inputs, in this case labor. Therefore, the oil companies had implemented a positive technological change.
D) The scenario described is an example of management efficiency at the oil companies but not technological change. Essentially, the companies changed their way of operating their businesses.
The oil companies were able to produce more output using fewer inputs, in this case labor. Therefore, the oil companies had implemented a positive technological change.
2
When oil companies implemented changes which allowed them to increase oil output with fewer workers, this represented a positive technological change.
True
3
Golda Rush quit her job as a manager for Home Depot to start her own hair dressing salon, Goldilocks. She gave up a salary of $40,000 per year, invested her savings of $30,000 (which was earning 5 percent interest) and borrowed $10,000 from a close friend, agreeing to pay 5 percent interest per year. In her first year, Golda spent $18,000 to rent a salon, hired a part-time assistant for $12,000 and incurred another $15,000 in expenses on equipment and hairdressing material. Based on this information, what is the amount of her explicit costs for the first year?
A) $45,000
B) $45,500
C) $47,000
D) $87,000
A) $45,000
B) $45,500
C) $47,000
D) $87,000
$45,500
4
Golda Rush quit her job as a manager for Home Depot to start her own hair dressing salon, Goldilocks. She gave up a salary of $40,000 per year, invested her savings of $30,000 (which was earning 5 percent interest) and borrowed $10,000 from a close friend, agreeing to pay 5 percent interest per year. In her first year, Golda spent $18,000 to rent a salon, hired a part-time assistant for $12,000 and incurred another $15,000 in expenses on equipment and hairdressing material. Based on this information, what is the amount of her implicit costs for the first year?
A) $80,000
B) $70,000
C) $42,000
D) $41,500
A) $80,000
B) $70,000
C) $42,000
D) $41,500
Unlock Deck
Unlock for access to all 43 flashcards in this deck.
Unlock Deck
k this deck
5
Vipsana's Gyros House sells gyros. The cost of ingredients (pita, meat, spices, etc.) to make a gyro is $2.00. Vipsana pays her employees $60 per day. She also incurs a fixed cost of $120 per day. What is Vipsana's total cost per day when she does not produce any gyros and does not hire any workers?
A) $0
B) $2
C) $60
D) $120
A) $0
B) $2
C) $60
D) $120
Unlock Deck
Unlock for access to all 43 flashcards in this deck.
Unlock Deck
k this deck
6
-Refer to Table 11-3. The table above refers to the relationship between the quantity of workers employed and the number of cardboard boxes produced per day by Manny's House of Boxes. The capital used to produce the boxes is fixed. The average product of labor will equal 66 boxes when Manny hires
A) the second worker.
B) the third worker.
C) the fourth worker.
D) the fifth worker.
Unlock Deck
Unlock for access to all 43 flashcards in this deck.
Unlock Deck
k this deck
7
-Refer to Table 11-4. The table above shows the following relationship between hours spent fishing and the quantity of fish caught for Juan, a commercial fisherman.
a. Complete the Marginal Product column in Table 11-4.
b. Characterize the production function, i.e. does the production function display increasing marginal returns, diminishing marginal returns, etc.
c. Using the data above, graph Juan's marginal product curve. Be sure to label the horizontal and vertical axes. Is your graph consistent with your answer to part (b)? Explain.
d. Juan uses the following inputs for fishing - a small wooden boat (B), a fishing pole (P) and of course, his labor (L). Treating the boat and the fishing pole as fixed inputs and using the data above, graph Juan's Total Product of Labor curve. Be sure to label the horizontal and vertical axes.
e. The opportunity cost of Juan's time is $8 per hour. If Juan receives $2 per pound for his fish, what is the optimal number of hours he should spend fishing? Explain how you arrived at your answer. Hint: Recall marginal benefit and marginal cost analysis.
Unlock Deck
Unlock for access to all 43 flashcards in this deck.
Unlock Deck
k this deck
8
Fill in the missing values in the following table. Draw one graph showing how total output increases with the quantity of workers hired, and another graph showing the marginal product of labor and the average product of labor.
Unlock Deck
Unlock for access to all 43 flashcards in this deck.
Unlock Deck
k this deck
9
When deciding on how much oil to pump from a well, oil companies look at the extra cost of producing an additional barrel of oil. This extra cost is known as
A) marginal cost.
B) opportunity cost.
C) fixed cost.
D) total cost.
A) marginal cost.
B) opportunity cost.
C) fixed cost.
D) total cost.
Unlock Deck
Unlock for access to all 43 flashcards in this deck.
Unlock Deck
k this deck
10
Suppose the total cost of producing 40,000 flash drives is $120,000, and the fixed cost is $30,000.
a. What is the variable cost?
b. When output is 40,000, what are the average variable cost and the average fixed cost?
c. Assuming the cost curves have the usual shape, is the dollar difference between the average total cost and the average variable cost greater when the output is 40,000 flash drives or when the output is 60,000 flash drives? Explain.
Unlock Deck
Unlock for access to all 43 flashcards in this deck.
Unlock Deck
k this deck
11
Table 11-8 represents the monthly output of five companies in the electric scooter manufacturing industry.
Minimum efficient scale in this industry is a monthly output of 27,000 electric scooters, and the industry
has a typical U-shaped long-run average cost curve with no constant returns to scale.
-Refer to Table 11-8. Which of these companies are on the downward-sloping portion of the long-run average cost curve?
A) only Aardvark and Echidna
B) only Dugong, Echidna, and Capybara
C) only Dugong and Bandicoot
D) all five companies
Unlock Deck
Unlock for access to all 43 flashcards in this deck.
Unlock Deck
k this deck
12
Table 11-8 represents the monthly output of five companies in the electric scooter manufacturing industry.
Minimum efficient scale in this industry is a monthly output of 27,000 electric scooters, and the industry
has a typical U-shaped long-run average cost curve with no constant returns to scale.
-Refer to Table 11-8. Which of the following potential mergers would result in the new company experiencing diseconomies of scale?
A) Bandicoot merges with Dugong.
B) Bandicoot merges with Capybara and Echidna.
C) Dugong merges with Aardvark and Capybara.
D) Capybara merges with Aardvark and Echidna.
Unlock Deck
Unlock for access to all 43 flashcards in this deck.
Unlock Deck
k this deck
13
Table 11-8 represents the monthly output of five companies in the electric scooter manufacturing industry.
Minimum efficient scale in this industry is a monthly output of 27,000 electric scooters, and the industry
has a typical U-shaped long-run average cost curve with no constant returns to scale.
-Refer to Table 11-8. Which of the following potential mergers would still result in the new company experiencing economies of scale?
A) Bandicoot merges with Dugong.
B) Bandicoot merges with Capybara, Aardvark, and Echidna.
C) Dugong merges with Echidna and Capybara.
D) Dugong merges with Aardvark and Echidna.
Unlock Deck
Unlock for access to all 43 flashcards in this deck.
Unlock Deck
k this deck
14
Table 11-8 represents the monthly output of five companies in the electric scooter manufacturing industry.
Minimum efficient scale in this industry is a monthly output of 27,000 electric scooters, and the industry
has a typical U-shaped long-run average cost curve with no constant returns to scale.
-Refer to Table 11-8. Which of the following potential mergers would result in the new company achieving the minimum efficient scale?
A) Bandicoot merges with Capybara and Echidna.
B) Bandicoot merges with Capybara, Aardvark, and Echidna.
C) Dugong merges with Echidna and Capybara.
D) Dugong merges with Aardvark and Echidna.
Unlock Deck
Unlock for access to all 43 flashcards in this deck.
Unlock Deck
k this deck
15
Figure 11-10 illustrates the long-run average cost curve for a firm that produces picture frames. The graph also includes short-run average cost curves for three firm sizes: ATCa, ATCb and ATCc.
-Refer to Figure 11-10. The minimum efficient scale of output is reached at what rate of output?
A) 10,000 workers
B) 5,000 picture frames
C) 20,000 picture frames
D) 10,000 picture frames
Unlock Deck
Unlock for access to all 43 flashcards in this deck.
Unlock Deck
k this deck
16
Figure 11-10 illustrates the long-run average cost curve for a firm that produces picture frames. The graph also includes short-run average cost curves for three firm sizes: ATCa, ATCb and ATCc.
-Refer to Figure 11-10. For output rates greater than 20,000 picture frames per month
A) the firm will not make a profit because the average cost of production will be too high.
B) the firm will experience diseconomies of scale.
C) the firm will experience diminishing returns.
D) the short-run average total cost will equal the long-run average total cost of production.
Unlock Deck
Unlock for access to all 43 flashcards in this deck.
Unlock Deck
k this deck
17
Figure 11-10 illustrates the long-run average cost curve for a firm that produces picture frames. The graph also includes short-run average cost curves for three firm sizes: ATCa, ATCb and ATCc.
-Refer to Figure 11-10. Constant returns to scale
A) occur for output rates greater than 5,000 picture frames.
B) occur between 5,000 and 20,000 picture frames per month.
C) occur between 10,000 and 20,000 pictures frames per month.
D) will shift the long-run average cost curve downward.
Unlock Deck
Unlock for access to all 43 flashcards in this deck.
Unlock Deck
k this deck
18
Figure 11-10 illustrates the long-run average cost curve for a firm that produces picture frames. The graph also includes short-run average cost curves for three firm sizes: ATCa, ATCb and ATCc.
-Refer to Figure 11-10. In the short run, if the firm sells fewer than 5,000 picture frames per month
A) it should produce with the scale of operation associated with ATCa.
B) it should produce with the scale of operation associated with ATCb.
C) it should produce with the scale of operation associated with ATCc.
D) it will experience constant returns to scale.
Unlock Deck
Unlock for access to all 43 flashcards in this deck.
Unlock Deck
k this deck
19
Figure 11-10 illustrates the long-run average cost curve for a firm that produces picture frames. The graph also includes short-run average cost curves for three firm sizes: ATCa, ATCb and ATCc.
-Refer to Figure 11-10. If the firm chooses to produce and sell 25,000 frames per month by operating in the short run with a scale operation represented by ATCc
A) the firm will not be operating efficiently.
B) the firm will be operating efficiently.
C) the firm would lower its average costs by reducing its scale of operation.
D) the firm will not be able to earn a profit.
Unlock Deck
Unlock for access to all 43 flashcards in this deck.
Unlock Deck
k this deck
20
Elegant Settings manufactures stainless steel cutlery. Table 11-9 shows the company's cost data.
-Refer to Table 11-9. Elegant Settings experiences
A) economies of scale up to an output level of 400.
B) diminishing returns up to an output level of 400.
C) increasing returns beyond an output level of 400.
D) economies of scale at an output of 300 or less and diseconomies of scale at an output level above 400.
Unlock Deck
Unlock for access to all 43 flashcards in this deck.
Unlock Deck
k this deck
21
Elegant Settings manufactures stainless steel cutlery. Table 11-9 shows the company's cost data.
-Refer to Table 11-9. What is the minimum efficient scale of production?
A) 100 units
B) 200 units
C) 300 units
D) 400 units
Unlock Deck
Unlock for access to all 43 flashcards in this deck.
Unlock Deck
k this deck
22
Suppose Argyle Sachs has to choose between building a smaller sweater factory and a larger sweater factory. In the following graph, the relationship between costs and output for the smaller factory is represented by the curve ATC1, and the relationship between costs and output for the larger factory is represented by the curve ATC2.
a. If Argyle expects to produce 3,600 sweaters per month, should he build a smaller factory or a larger factory? Briefly explain?
b. If Argyle expects to produce 5,000 sweaters per month, should he build a smaller factory or a larger factory? Briefly explain.
c. If the average cost of producing sweaters is lower in the larger factory when Argyle produces 6,500 sweaters per week, why isn't it also lower when Argyle produces 4,000 sweaters per week?
Unlock Deck
Unlock for access to all 43 flashcards in this deck.
Unlock Deck
k this deck
23
Due to falling sales and increased competition from online retailers like Wayfair, Pier 1 Imports announced it would be closing up to 450 stores in 2020, representing almost half of its 942 locations. Pier 1's sales fell by 13 percent in the fourth quarter of 2019, and the company reported a net loss of $59 million for the quarter.
Source: "Pier 1 Imports Closing Nearly Half of Stores as Sales Falter," Associated Press, January 6. 2020
-Refer to the Article Summary. Use a graph to illustrate average total cost curves for Pier 1 before and after closing the 450 stores. Assume that after closing the stores, Pier 1 will be producing at minimum average total cost.
Unlock Deck
Unlock for access to all 43 flashcards in this deck.
Unlock Deck
k this deck
24
-Refer to Table 11-10. Clock It To Me manufactures clock radios. The table above shows estimates of fixed cost per period and average variable cost for three possible plant sizes.
a. You are employed as the company's cost accountant and have been asked to prepare cost estimates for various output levels for each of the three possible plant sizes. Record your calculations in the table below.
b. For each of the three output levels, which plant size will generate the lowest average total cost of production?
c. Suppose the firm currently sells 8,000 clock radios per period (using the optimal plant size for this output level). Now, however, it has just secured a long-term contract to supply 20,000 clock radios per period. In the short run, what is the average total cost of producing 20,000 clock radios? Provide a numerical value based on your answer in part a.
d. What happens to average total cost of production in the long run? Provide a numerical value based on your answer in part a.
Unlock Deck
Unlock for access to all 43 flashcards in this deck.
Unlock Deck
k this deck
25
-Refer to Figure 11-11. The movement from isoquant T to isoquant U depicts
A) a change in preferences with regards to input usage.
B) an increase in the cost of production.
C) an increase in output.
D) an increase in labor usage holding capital and output constant.
Unlock Deck
Unlock for access to all 43 flashcards in this deck.
Unlock Deck
k this deck
26
-Refer to Figure 11-11. Which of the following statements about the input combinations shown in the diagram is false?
A) The firm produces a higher output level when it uses input combination b compared to input combination a.
B) The firm produces a lower output level when it uses input combination d compared to input combination a.
C) The firm produces the same output level when it uses input combination a or c.
D) The firm incurs the same total cost when it uses input combination a or c to produce a given quantity of output.
Unlock Deck
Unlock for access to all 43 flashcards in this deck.
Unlock Deck
k this deck
27
-Refer to Figure 11-12. The lines shown in the diagram are isocost lines. Which of the following shows an increase in the price of labor while the price of capital remains unchanged?
A) the movement from AF to BD
B) the movement from AF to CE
C) the movement from BF to BD
D) the movement from BF to CE
Unlock Deck
Unlock for access to all 43 flashcards in this deck.
Unlock Deck
k this deck
28
-Refer to Figure 11-12. The lines shown in the diagram are isocost lines. Which of the following shows a decrease in the price of capital while the price of labor remains unchanged?
A) the movement from AF to BF
B) the movement from BF to AF
C) the movement from BF to BD
D) the movement from BF to CE
Unlock Deck
Unlock for access to all 43 flashcards in this deck.
Unlock Deck
k this deck
29
-Refer to Figure 11-12. The lines shown in the diagram are isocost lines. Which of the following shows an increase in the firm's total cost while the price of labor and capital remain unchanged?
A) the movement from CE to BF
B) the movement from CE to AF
C) the movement from BD to AF
D) the movement from BD to CE
Unlock Deck
Unlock for access to all 43 flashcards in this deck.
Unlock Deck
k this deck
30
-Refer to Figure 11-12. The lines shown in the diagram are isocost lines. A movement from CE to BD occurs when
A) the price of capital increases while the price of labor remains unchanged.
B) the price of labor decreases while the price of capital remains unchanged.
C) the price of capital increases while the price of labor decreases.
D) the price of capital decreases while the price of labor increases.
Unlock Deck
Unlock for access to all 43 flashcards in this deck.
Unlock Deck
k this deck
31
-Refer to Figure 11-12. The lines shown in the diagram are isocost lines. If the price of labor is $50 per unit, then along the isocost AF, the total cost
A) is $500.
B) is $750.
C) is $1,250.
D) cannot be determined without the price of capital.
Unlock Deck
Unlock for access to all 43 flashcards in this deck.
Unlock Deck
k this deck
32
-Refer to Figure 11-12. The lines shown in the diagram are isocost lines. If the price of labor is $50 per unit, what is the price of capital along the isocost CE?
A) $400 per unit
B) $100 per unit
C) $25 per unit
D) insufficient information to answer question
Unlock Deck
Unlock for access to all 43 flashcards in this deck.
Unlock Deck
k this deck
33
Figure 11-13 shows the optimal input combinations for the production of a given quantity of cotton in the United States and in China.
-Refer to Figure 11-13. Consider the following statements:
A. For each country, the marginal product per dollar spent on labor equals to the marginal product per dollar spent on capital.
B. The price of labor is relatively higher in the United States than in China and the price of capital is relatively lower in the United States than in China.
C. The price of labor and the price of capital are relatively higher in the United States than in China.
Based on the figure, which of the statements above is true?
A) All of the statements are true.
B) statements a and c only
C) statements a and b only
D) statements b and c only
Unlock Deck
Unlock for access to all 43 flashcards in this deck.
Unlock Deck
k this deck
34
Figure 11-13 shows the optimal input combinations for the production of a given quantity of cotton in the United States and in China.
-Refer to Figure 11-13. Which of the following could explain why the United States and China use different input combinations to produce a given quantity of cotton and yet, each country produces that quantity at the lowest possible cost?
A) because the prices of inputs are not the same for the two countries: labor is relatively lower-priced and capital is relatively higher priced in the United States
B) because the prices of inputs are not the same for the two countries: labor is relatively lower-priced and capital is relatively higher priced in China
C) because the United States has more sophisticated technology and therefore is more efficient in cotton production
D) because the marginal product per dollar spent on capital yields a higher return in the United States than in China
Unlock Deck
Unlock for access to all 43 flashcards in this deck.
Unlock Deck
k this deck
35
-Refer to Figure 11-14. What is the combination of inputs that produces 200 gooseberry pies at the lowest cost?
A) combination e: 10 hours of labor and 48 units of capital
B) combination f: 40 hours of labor and 24 units of capital
C) combination g: 60 hours of labor and 14 units of capital
D) combination h: 60 hours of labor and 9 units of capital
Unlock Deck
Unlock for access to all 43 flashcards in this deck.
Unlock Deck
k this deck
36
-Refer to Figure 11-14. Suppose Hilda hires labor at $8 per hour and capital costs $10 per unit. What is the minimum cost of producing 200 gooseberry pies?
A) $3,600
B) $1,120
C) $592
D) $560
Unlock Deck
Unlock for access to all 43 flashcards in this deck.
Unlock Deck
k this deck
37
-Refer to Figure 11-14. Suppose Hilda produces 100 gooseberry pies. What is the marginal rate of technical substitution of labor for capital when labor is increased from 10 to 20 hours?
A) 1 unit of capital per worker
B) 10 units of capital per worker
C) 14 units of capital per worker
D) 24 units of capital per worker
Unlock Deck
Unlock for access to all 43 flashcards in this deck.
Unlock Deck
k this deck
38
-Refer to Figure 11-15. The figure above illustrates a series of isoquants. Which of the following statements is true?
A) Points x, z, and y all represent the same output.
B) Points z and y represent the same output; this output is produced with more capital at z than at y.
C) Point x and y represent the same output but the cost of production at y is greater than the cost of production at x.
D) Point z represents a greater output than point x or point y.
Unlock Deck
Unlock for access to all 43 flashcards in this deck.
Unlock Deck
k this deck
39
-Refer to Figure 11-16. Assume that production isoquants are convex. Total cost and output produced must increase for each of the following movements except one. Which movement is the exception?
A) point a to point b
B) point a to point c
C) point b to point c
D) point b to point d
Unlock Deck
Unlock for access to all 43 flashcards in this deck.
Unlock Deck
k this deck
40
-Refer to Figure 11-17. Starting from point D, a movement along isoquant2 to point F
A) increases the total cost of production with no change in output.
B) increases output but not the total cost of production.
C) increases the total cost of production and decreases output.
D) increases both the total cost of production and output.
Unlock Deck
Unlock for access to all 43 flashcards in this deck.
Unlock Deck
k this deck
41
-Refer to Figure 11-17. Starting from point E, a movement along the isocost to point F
A) decreases the total cost of production but not output.
B) increases the total cost of production and decreases output.
C) decreases both the total cost of production and output.
D) decreases output but not the total cost of production.
Unlock Deck
Unlock for access to all 43 flashcards in this deck.
Unlock Deck
k this deck
42
-Refer to Figure 11-17. A curve that connects points A, D, and E is called
A) an input-output curve.
B) a total cost line.
C) an expansion path.
D) an indifference line.
Unlock Deck
Unlock for access to all 43 flashcards in this deck.
Unlock Deck
k this deck
43
Use the following graph to answer the following questions.
a. If the wage rate and the rental price of machines are both $50 and total cost is $800, is the cost-minimizing point A, B, or C?
b. If the wage rate is $40, the rental price of equipment is $120, and total cost is $1,200, is the cost-minimizing point A, B, or C?
c. If the wage rate is $60, the rental price of equipment is $90, and total cost is $1,800, is the cost-minimizing point A, B, or C?
Unlock Deck
Unlock for access to all 43 flashcards in this deck.
Unlock Deck
k this deck
Unlock Deck
Unlock for access to all 43 flashcards in this deck.


