Deck 6: Elasticity: The Responsiveness of Demand and Supply
Full screen (f)
Question
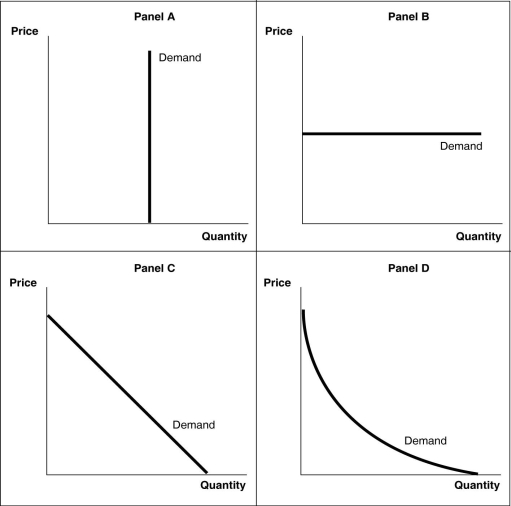
-Refer to Figure 6-1. A perfectly elastic demand curve is shown in
A) Panel A.
B) Panel B.
C) Panel C.
D) Panel D.
Question
-Refer to Figure 6-1. A perfectly inelastic demand curve is shown in
A) Panel A.
B) Panel B.
C) Panel C.
D) Panel D.
Question
Question
Question
Question
Question
Question
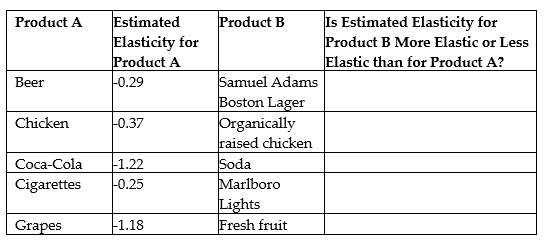
The estimated price elasticities of demand for the products listed in the table as "Product A"
are from Figure 6-2 in the text. Indicate whether the products listed as "Product B"
will have a more elastic or less elastic demand than the corresponding Product A.
are from Figure 6-2 in the text. Indicate whether the products listed as "Product B"
will have a more elastic or less elastic demand than the corresponding Product A.
Question
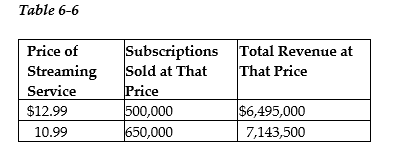
-Refer to Table 6-6. Based on the data in the table, between a price of $10.99 and $12.99, the demand for streaming service is
A) elastic.
B) unit elastic.
C) inelastic.
D) perfectly inelastic.
Question
-Refer to Table 6-6. Based on the data in the table and using the midpoint formula, between a price of $10.99 and $12.99, the price elasticity of demand for streaming service is
A) -0.64.
B) -0.90.
C) -1.56.
D) -6.30.
Question
Question
Question
Question
Question
Question
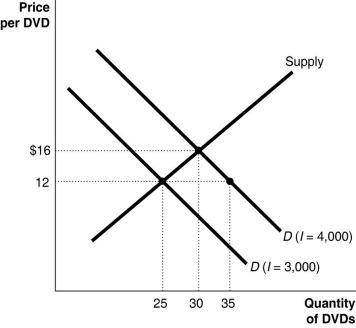
-Refer to Figure 6-9. The data in the diagram indicates that DVDs are
A) luxury goods.
B) inelastic goods.
C) necessities.
D) both luxury goods and inelastic goods.
Question
Question
Question
Question
Question
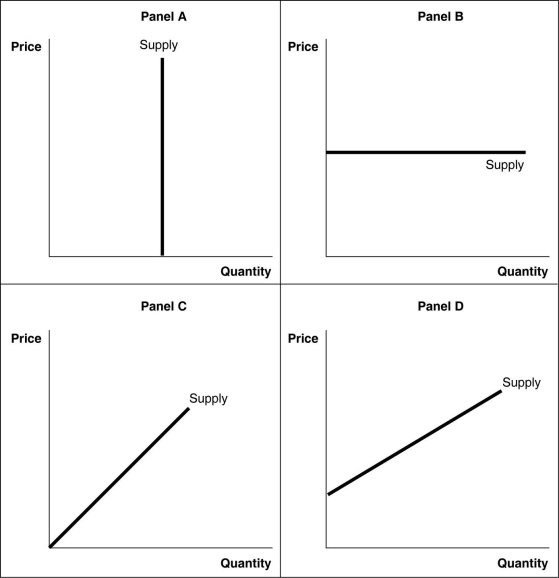
-Refer to Figure 6-10. A perfectly elastic supply curve is shown in
A) Panel A.
B) Panel B.
C) Panel C.
D) Panel D.
Question
-Refer to Figure 6-10. A perfectly inelastic supply curve is shown in
A) Panel A.
B) Panel B.
C) Panel C.
D) Panel D.
Question
-Refer to Figure 6-10. A unit-elastic supply curve is shown in
A) Panel A.
B) Panel B.
C) Panel C.
D) Panel D.

Unlock Deck
Sign up to unlock the cards in this deck!
Unlock Deck
Unlock Deck
1/23
Play
Full screen (f)
Deck 6: Elasticity: The Responsiveness of Demand and Supply
1
-Refer to Figure 6-1. A perfectly elastic demand curve is shown in
A) Panel A.
B) Panel B.
C) Panel C.
D) Panel D.
Panel B.
2
-Refer to Figure 6-1. A perfectly inelastic demand curve is shown in
A) Panel A.
B) Panel B.
C) Panel C.
D) Panel D.
Panel A.
3
In recent years, a number of cities have enacted taxes on soda and other sweetened beverages. If the policy goal of these city governments is to reduce health care costs and and insurance rates for taxpayers by reducing the total amount of soda and sweetened beverages consumed, this would be most successful if the price elasticity of demand for these sweetened beverages is
A) elastic.
B) inelastic.
C) unit elastic.
D) perfectly inelastic.
A) elastic.
B) inelastic.
C) unit elastic.
D) perfectly inelastic.
elastic.
4
Suppose a hurricane decreased the supply of oranges so that the price of oranges rose from $120 a ton to $180 a ton and quantity sold decreased from 800 tons to 240 tons. What is the absolute value of the price elasticity of demand?
A) 0.11
B) 0.37
C) 2.69
D) 9.33
A) 0.11
B) 0.37
C) 2.69
D) 9.33
Unlock Deck
Unlock for access to all 23 flashcards in this deck.
Unlock Deck
k this deck
5
In recent years, a number of cities have enacted taxes on soda and other sweetened beverages. If the policy goal of these city governments is to raise tax revenue to fund important initiatives such as education programs, this would be most successful if the price elasticity of demand for these sweetened beverages is
A) elastic.
B) inelastic.
C) unit elastic.
D) perfectly elastic.
A) elastic.
B) inelastic.
C) unit elastic.
D) perfectly elastic.
Unlock Deck
Unlock for access to all 23 flashcards in this deck.
Unlock Deck
k this deck
6
Suppose the price of gasoline in July 2019 averaged $2.35 a gallon and 15 million gallons a day were sold. In October 2019, the price averaged $3.05 a gallon and 14 million gallons were sold. If the demand for gasoline did not shift between these two months, use the midpoint formula to calculate the price elasticity of demand. Indicate whether demand was elastic or inelastic.
Unlock Deck
Unlock for access to all 23 flashcards in this deck.
Unlock Deck
k this deck
7
If the absolute value of the price elasticity of demand for DVD movies is 0.8 then the elasticity of demand of the DVD for the movie Avengers: Endgame should be
A) less then 0.8 in absolute value.
B) greater than 0.8 in absolute value.
C) equal to 1 in absolute value.
D) equal to zero because the DVD of this movie has been out for several years.
A) less then 0.8 in absolute value.
B) greater than 0.8 in absolute value.
C) equal to 1 in absolute value.
D) equal to zero because the DVD of this movie has been out for several years.
Unlock Deck
Unlock for access to all 23 flashcards in this deck.
Unlock Deck
k this deck
8
The estimated price elasticities of demand for the products listed in the table as "Product A"
are from Figure 6-2 in the text. Indicate whether the products listed as "Product B"
will have a more elastic or less elastic demand than the corresponding Product A.
are from Figure 6-2 in the text. Indicate whether the products listed as "Product B"
will have a more elastic or less elastic demand than the corresponding Product A.
Unlock Deck
Unlock for access to all 23 flashcards in this deck.
Unlock Deck
k this deck
9
-Refer to Table 6-6. Based on the data in the table, between a price of $10.99 and $12.99, the demand for streaming service is
A) elastic.
B) unit elastic.
C) inelastic.
D) perfectly inelastic.
Unlock Deck
Unlock for access to all 23 flashcards in this deck.
Unlock Deck
k this deck
10
-Refer to Table 6-6. Based on the data in the table and using the midpoint formula, between a price of $10.99 and $12.99, the price elasticity of demand for streaming service is
A) -0.64.
B) -0.90.
C) -1.56.
D) -6.30.
Unlock Deck
Unlock for access to all 23 flashcards in this deck.
Unlock Deck
k this deck
11
Tickets for the 2019 MLS Cup final between Seattle and Toronto went on sale on November 1 and sold out in just 20 minutes. The average resale price for tickets through SeatGeek, the official ticketing partner of Major League Soccer, was $569 just 2 days before the game, considerably higher than the average face-value price of tickets for the event. Sixty-nine thousand fans were expected to attend the game, making this the second-largest MLS Cup crowd in history.
Source: "Sold-out 2019 MLS Cup is the hottest ticket in recent MLS history," mlssoccer.com, November 10, 2019.
-Refer to the Article Summary. If Major League Soccer had increased the face-value ticket prices for the MLS Cup final to the prices being charged by resellers and its total revenue from ticket sales increased, it would have been operating on the ________ portion of the demand curve.
A) elastic.
B) inelastic.
C) unit elastic.
D) perfectly elastic.
Unlock Deck
Unlock for access to all 23 flashcards in this deck.
Unlock Deck
k this deck
12
Tickets for the 2019 MLS Cup final between Seattle and Toronto went on sale on November 1 and sold out in just 20 minutes. The average resale price for tickets through SeatGeek, the official ticketing partner of Major League Soccer, was $569 just 2 days before the game, considerably higher than the average face-value price of tickets for the event. Sixty-nine thousand fans were expected to attend the game, making this the second-largest MLS Cup crowd in history.
Source: "Sold-out 2019 MLS Cup is the hottest ticket in recent MLS history," mlssoccer.com, November 10, 2019.
-Refer to the Article Summary. How would Major League Soccer know if it was operating on the elastic portion of the demand curve for MLS Cup final tickets?
A) If they increased ticket prices and the total revenue from ticket sales increased.
B) If they increased ticket prices and the total revenue from ticket sales did not change.
C) If they increased ticket prices and the total revenue from ticket sales decreased.
D) If they decreased ticket prices and the total revenue from ticket sales did not change.
Unlock Deck
Unlock for access to all 23 flashcards in this deck.
Unlock Deck
k this deck
13
Suppose the governor of California has proposed increasing toll rates on California's toll roads, and has presented two possible scenarios to implement these increases. Following are projected data for the two scenarios for the California toll roads:
Scenario 1: Toll rate in 2015: $10.00. Toll rate in 2019: $22.50
For every 100 cars using the toll roads in 2015, only 81.6 cars will use the toll roads in 2019.
Scenario 2: Toll rate in 2015: $10.00. Toll rate in 2019: $17.50
For every 100 cars using the toll roads in 2015, only 96.2 cars will use the toll roads in 2019.
a. Using the midpoint formula, calculate the price elasticity of demand for Scenario 1 and Scenario 2.
b. Assume 10,000 cars use California toll roads every day in 2015. What would be the daily total revenue received for each scenario in 2015 and in 2019?
c. Is demand under Scenario 1 and under Scenario 2 price elastic, inelastic, or unit elastic. Briefly explain.
(For above questions, assume that nothing other than the toll change occurs during the time frame listed that would affect consumer demand.)
Unlock Deck
Unlock for access to all 23 flashcards in this deck.
Unlock Deck
k this deck
14
In November 2018, the U.S. Centers for Disease Control and Prevention warned that due to an outbreak of the E. coli bacteria, no romaine lettuce in the United States could be assumed safe to eat and that all of it should be discarded. Following this recommendation, sales of other leafy vegetables such as kale increased. Based on this information
A) kale is a normal good while romaine lettuce is an inferior good.
B) the cross-price elasticity between kale and romaine lettuce is negative.
C) the cross-price elasticity between kale and romaine lettuce is positive.
D) the price elasticity of kale is positive while the price elasticity of romaine lettuce falls to zero.
Unlock Deck
Unlock for access to all 23 flashcards in this deck.
Unlock Deck
k this deck
15
If the cross-price elasticity of demand between Breeze Detergent and Gain Detergent is a relatively large positive number, then it indicates that
A) the two brands are probably made by the same company.
B) the two brands of detergent are close substitutes.
C) consumers have a distinct preference for one brand versus the other.
D) detergents are necessities.
A) the two brands are probably made by the same company.
B) the two brands of detergent are close substitutes.
C) consumers have a distinct preference for one brand versus the other.
D) detergents are necessities.
Unlock Deck
Unlock for access to all 23 flashcards in this deck.
Unlock Deck
k this deck
16
-Refer to Figure 6-9. The data in the diagram indicates that DVDs are
A) luxury goods.
B) inelastic goods.
C) necessities.
D) both luxury goods and inelastic goods.
Unlock Deck
Unlock for access to all 23 flashcards in this deck.
Unlock Deck
k this deck
17
Between 1950 and 2019, the number of acres devoted to wheat production in the United States ________ and the price of wheat ________.
A) declined; decreased
B) more than doubled; increased by about 50 percent
C) declined; more than doubled
D) increased; more than doubled
A) declined; decreased
B) more than doubled; increased by about 50 percent
C) declined; more than doubled
D) increased; more than doubled
Unlock Deck
Unlock for access to all 23 flashcards in this deck.
Unlock Deck
k this deck
18
From 1950 to 2019 the number of people who lived on farms fell from 23 million to fewer than 3 million. Which of the following factors have contributed to this trend?
A) increases in the cost of farming and a desire for young adults to move to urban areas
B) rapid growth in farm production and low income and price elasticities for food products
C) slow growth in agricultural productivity and low income elasticities for food products
D) government policies that have increased the cost of living and working on farms
Unlock Deck
Unlock for access to all 23 flashcards in this deck.
Unlock Deck
k this deck
19
Between 1950 and 2019 the productivity of wheat farmers in the United States more than doubled. This means that
A) the amount of land and other resources devoted to wheat production more than doubled.
B) the incomes of wheat farmers more than doubled.
C) the total amount of wheat produced more than doubled.
D) the amount of wheat produced by the average farmer more than doubled.
A) the amount of land and other resources devoted to wheat production more than doubled.
B) the incomes of wheat farmers more than doubled.
C) the total amount of wheat produced more than doubled.
D) the amount of wheat produced by the average farmer more than doubled.
Unlock Deck
Unlock for access to all 23 flashcards in this deck.
Unlock Deck
k this deck
20
Suppose that the price of a money clip increases from $0.75 to $0.90 and quantity supplied rises from 8,000 units to 10,000 units. Use the midpoint formula to calculate the price elasticity of supply.
A) 1.22
B) 1.0
C) 0.82
D) 0.07
A) 1.22
B) 1.0
C) 0.82
D) 0.07
Unlock Deck
Unlock for access to all 23 flashcards in this deck.
Unlock Deck
k this deck
21
-Refer to Figure 6-10. A perfectly elastic supply curve is shown in
A) Panel A.
B) Panel B.
C) Panel C.
D) Panel D.
Unlock Deck
Unlock for access to all 23 flashcards in this deck.
Unlock Deck
k this deck
22
-Refer to Figure 6-10. A perfectly inelastic supply curve is shown in
A) Panel A.
B) Panel B.
C) Panel C.
D) Panel D.
Unlock Deck
Unlock for access to all 23 flashcards in this deck.
Unlock Deck
k this deck
23
-Refer to Figure 6-10. A unit-elastic supply curve is shown in
A) Panel A.
B) Panel B.
C) Panel C.
D) Panel D.
Unlock Deck
Unlock for access to all 23 flashcards in this deck.
Unlock Deck
k this deck
Unlock Deck
Unlock for access to all 23 flashcards in this deck.


