Deck 1: The Science of Psychology Introduction: The Science of Psychology and Foundations of Behaviour
Full screen (f)
Question
Question
Question
Macroeconomic information for the economy of Anchovy is given below:
?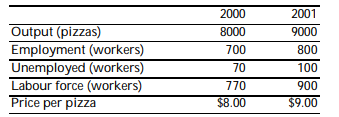
a. What was the growth rate of average labour productivity in Anchovy between 2000 and 2001?
b. What was the inflation rate in Anchovy between 2000 and 2001?
c. What was the unemployment rate in 2000? In 2001?
?
a. What was the growth rate of average labour productivity in Anchovy between 2000 and 2001?
b. What was the inflation rate in Anchovy between 2000 and 2001?
c. What was the unemployment rate in 2000? In 2001?
Question
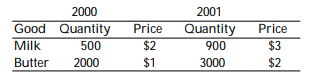
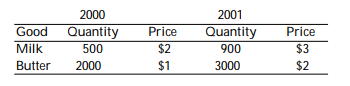
The country of Old Jersey produces milk and butter, and it has published the following macroeconomic data, where quantities are in gallons and prices are dollars per gallon:
-
Between 2000 and 2001, nominal GDP grew by
A) 60.0%.
B) 65.5%.
C) 83.3%.
D) 190.0%.
-
Between 2000 and 2001, nominal GDP grew by
A) 60.0%.
B) 65.5%.
C) 83.3%.
D) 190.0%.
Question
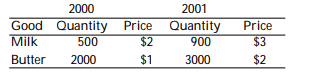
The country of Old Jersey produces milk and butter, and it has published the following macroeconomic data, where quantities are in gallons and prices are dollars per gallon:
-
Between 2000 and 2001, the percent change in the price level as measured by a variable-weight price index was
A) 60.00%.
B) 81.25%.
C) 83.33%.
D) 123.08%.
-
Between 2000 and 2001, the percent change in the price level as measured by a variable-weight price index was
A) 60.00%.
B) 81.25%.
C) 83.33%.
D) 123.08%.
Question
Use the following information to answer this question about the country of Polity:
-
Using a fixed-weight price index with 1998 as the base year, what is the percent change in real output from 2000 to 2001?
A) 8%
B) 10%
C) 12%
D) 15%
-
Using a fixed-weight price index with 1998 as the base year, what is the percent change in real output from 2000 to 2001?
A) 8%
B) 10%
C) 12%
D) 15%
Question
The country of Old Jersey produces milk and butter, and it has published the following macroeconomic data, where quantities are in gallons and prices are dollars per gallon:

-
Between 2000 and 2001, real GDP grew by how much, using a variable-weight price index?
A) 37.5%
B) 60.05%
C) 83.3%
D) 190.0%
-
Between 2000 and 2001, real GDP grew by how much, using a variable-weight price index?
A) 37.5%
B) 60.05%
C) 83.3%
D) 190.0%
Question
Question
The country of Old Jersey produces milk and butter, and it has published the following macroeconomic data, where quantities are in gallons and prices are dollars per gallon:
Between 2001 and 2002, the percent change in the price level as measured by a fixed-weight index That uses production in 2001 as the fixed "basket"
Of goods was
A) 60.00%.
B) 81.25%.
C) 83.33%.
D) 123.08%.
9
Between 2001 and 2002, the percent change in the price level as measured by a fixed-weight index That uses production in 2001 as the fixed "basket"
Of goods was
A) 60.00%.
B) 81.25%.
C) 83.33%.
D) 123.08%.
9
Question
You are given information on the consumer price index (CPI), where the values given are those for December 31 of each year.
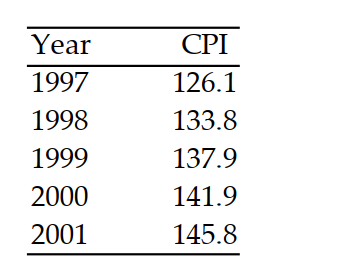
In which year was the inflation rate the highest?
A) 1998
B) 1999
C) 2000
D) 2001
In which year was the inflation rate the highest?
A) 1998
B) 1999
C) 2000
D) 2001
Question
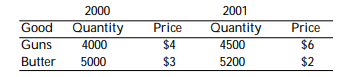
The country of Myrule has produced the following quantity of gauges and potatoes, with the price of each listed in dollar terms:
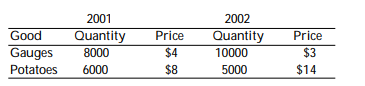
a. Using 2001 as the base year, what are the price indexes for 2001 and 2002?
b. What is the inflation rate using this index?
c. What is the percent change in real output using this index?
a. Using 2001 as the base year, what are the price indexes for 2001 and 2002?
b. What is the inflation rate using this index?
c. What is the percent change in real output using this index?
Question
For 2002, the Kwakian economy had the following nominal quantities (in billions of dollars) and price indexes(1997 = 100) for each category of expenditure:
?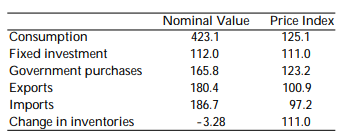
a. Calculate the real quantity for each category (to one decimal point).
b. Calculate nominal and real GDP.
c. Find the implicit price deflator (1997 = 100)
?
a. Calculate the real quantity for each category (to one decimal point).
b. Calculate nominal and real GDP.
c. Find the implicit price deflator (1997 = 100)

Unlock Deck
Sign up to unlock the cards in this deck!
Unlock Deck
Unlock Deck
1/12
Play
Full screen (f)
Deck 1: The Science of Psychology Introduction: The Science of Psychology and Foundations of Behaviour
1
During recessions, the unemployment rate ________ and output ________.
A) rises; falls
B) rises; rises
C) falls; falls
D) falls; rises
A) rises; falls
B) rises; rises
C) falls; falls
D) falls; rises
rises; falls
2
The difference between microeconomics and macroeconomics is that
A) microeconomics looks at prices, while macroeconomics looks at inflation.
B) microeconomics looks at supply and demand for goods, while macroeconomics looks at supply and demand for services.
C) microeconomics looks at individual consumers and firms, while macroeconomics looks at national totals.
D) microeconomics looks at national issues, while macroeconomics looks at global issues.
microeconomics looks at individual consumers and firms, while macroeconomics looks at national totals.
3
Macroeconomic information for the economy of Anchovy is given below:
?
a. What was the growth rate of average labour productivity in Anchovy between 2000 and 2001?
b. What was the inflation rate in Anchovy between 2000 and 2001?
c. What was the unemployment rate in 2000? In 2001?
?
a. What was the growth rate of average labour productivity in Anchovy between 2000 and 2001?
b. What was the inflation rate in Anchovy between 2000 and 2001?
c. What was the unemployment rate in 2000? In 2001?
a. Average labour productivity: 2000: 8000/700 = 80/7; 2001: 9000/800 = 90/8;growth rate = [(90/8)/(80/7)] - 1 = -.016 = -1.6%
b. Inflation rate: (9/8) - 1 = .125 = 12.5%
c. Unemployment rates: 2000: 70/770 = .091 = 9.1%; 2001: 100/900 = .111 = 11.1%
b. Inflation rate: (9/8) - 1 = .125 = 12.5%
c. Unemployment rates: 2000: 70/770 = .091 = 9.1%; 2001: 100/900 = .111 = 11.1%
4
The country of Old Jersey produces milk and butter, and it has published the following macroeconomic data, where quantities are in gallons and prices are dollars per gallon:
-
Between 2000 and 2001, nominal GDP grew by
A) 60.0%.
B) 65.5%.
C) 83.3%.
D) 190.0%.
-
Between 2000 and 2001, nominal GDP grew by
A) 60.0%.
B) 65.5%.
C) 83.3%.
D) 190.0%.
Unlock Deck
Unlock for access to all 12 flashcards in this deck.
Unlock Deck
k this deck
5
The country of Old Jersey produces milk and butter, and it has published the following macroeconomic data, where quantities are in gallons and prices are dollars per gallon:
-
Between 2000 and 2001, the percent change in the price level as measured by a variable-weight price index was
A) 60.00%.
B) 81.25%.
C) 83.33%.
D) 123.08%.
-
Between 2000 and 2001, the percent change in the price level as measured by a variable-weight price index was
A) 60.00%.
B) 81.25%.
C) 83.33%.
D) 123.08%.
Unlock Deck
Unlock for access to all 12 flashcards in this deck.
Unlock Deck
k this deck
6
Use the following information to answer this question about the country of Polity:
-
Using a fixed-weight price index with 1998 as the base year, what is the percent change in real output from 2000 to 2001?
A) 8%
B) 10%
C) 12%
D) 15%
-
Using a fixed-weight price index with 1998 as the base year, what is the percent change in real output from 2000 to 2001?
A) 8%
B) 10%
C) 12%
D) 15%
Unlock Deck
Unlock for access to all 12 flashcards in this deck.
Unlock Deck
k this deck
7
The country of Old Jersey produces milk and butter, and it has published the following macroeconomic data, where quantities are in gallons and prices are dollars per gallon:
-
Between 2000 and 2001, real GDP grew by how much, using a variable-weight price index?
A) 37.5%
B) 60.05%
C) 83.3%
D) 190.0%
-
Between 2000 and 2001, real GDP grew by how much, using a variable-weight price index?
A) 37.5%
B) 60.05%
C) 83.3%
D) 190.0%
Unlock Deck
Unlock for access to all 12 flashcards in this deck.
Unlock Deck
k this deck
8
Say nominal GDP was $603.9 billion in 2001 and $572.3 billion in 2000, while the GDP deflator Was 121.1 in 2001 and 117.7 in 2000. What was the growth rate of real GDP between 2000 and2001?
A) 5.5%
B) 2.9%
C) 2.6%
D) 1.0%
A) 5.5%
B) 2.9%
C) 2.6%
D) 1.0%
Unlock Deck
Unlock for access to all 12 flashcards in this deck.
Unlock Deck
k this deck
9
The country of Old Jersey produces milk and butter, and it has published the following macroeconomic data, where quantities are in gallons and prices are dollars per gallon:
Between 2001 and 2002, the percent change in the price level as measured by a fixed-weight index That uses production in 2001 as the fixed "basket"
Of goods was
A) 60.00%.
B) 81.25%.
C) 83.33%.
D) 123.08%.
9
Between 2001 and 2002, the percent change in the price level as measured by a fixed-weight index That uses production in 2001 as the fixed "basket"
Of goods was
A) 60.00%.
B) 81.25%.
C) 83.33%.
D) 123.08%.
9
Unlock Deck
Unlock for access to all 12 flashcards in this deck.
Unlock Deck
k this deck
10
You are given information on the consumer price index (CPI), where the values given are those for December 31 of each year.
In which year was the inflation rate the highest?
A) 1998
B) 1999
C) 2000
D) 2001
In which year was the inflation rate the highest?
A) 1998
B) 1999
C) 2000
D) 2001
Unlock Deck
Unlock for access to all 12 flashcards in this deck.
Unlock Deck
k this deck
11
The country of Myrule has produced the following quantity of gauges and potatoes, with the price of each listed in dollar terms:
a. Using 2001 as the base year, what are the price indexes for 2001 and 2002?
b. What is the inflation rate using this index?
c. What is the percent change in real output using this index?
a. Using 2001 as the base year, what are the price indexes for 2001 and 2002?
b. What is the inflation rate using this index?
c. What is the percent change in real output using this index?
Unlock Deck
Unlock for access to all 12 flashcards in this deck.
Unlock Deck
k this deck
12
For 2002, the Kwakian economy had the following nominal quantities (in billions of dollars) and price indexes(1997 = 100) for each category of expenditure:
?
a. Calculate the real quantity for each category (to one decimal point).
b. Calculate nominal and real GDP.
c. Find the implicit price deflator (1997 = 100)
?
a. Calculate the real quantity for each category (to one decimal point).
b. Calculate nominal and real GDP.
c. Find the implicit price deflator (1997 = 100)
Unlock Deck
Unlock for access to all 12 flashcards in this deck.
Unlock Deck
k this deck
Unlock Deck
Unlock for access to all 12 flashcards in this deck.


