Deck 10: Comparing Two Treatments
Full screen (f)
Question
Question
There are six cars that we use as subjects in a matched pairs experiment.
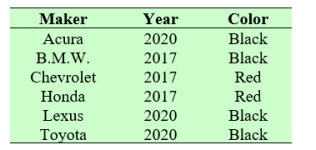
A) How many sets of pairing are if subjects are pair by year?
B) If subjects are paired by color, how many sets of pairing are available for the experiment?
A) How many sets of pairing are if subjects are pair by year?
B) If subjects are paired by color, how many sets of pairing are available for the experiment?
Question
Question
The height (in meters) of 173 college professors and 213 miners were recorded, yielded the summary statistics.
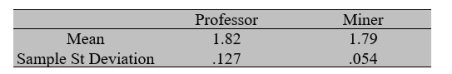 Construct a 95% confidence interval for difference in mean of heights.
A) (.010, .050)
B) (.020, .060)
C) (.030, .070)
D) (.040, .080)
Construct a 95% confidence interval for difference in mean of heights.A) (.010, .050)
B) (.020, .060)
C) (.030, .070)
D) (.040, .080)
Question
The height (in meters) of 189 college professors and 201 miners were recorded, yielded the summary statistics.
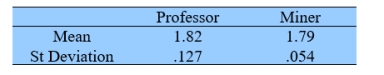 Do the data provide strong evidence that the mean height of college professors is different from the mean height of miners? Test at
Do the data provide strong evidence that the mean height of college professors is different from the mean height of miners? Test at Question
A small liberal arts college has an English placement test whose scores are in the range 0-120. This year there are 245 freshmen whose high school G.P.A. is higher than the high school G.P.A. of the 266 sophomore students. The school administration believes that a higher G.P.A. indicates higher scores in the placement test. Calculations of the mean and the standard deviation for the two sets of data give:
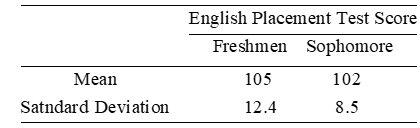
Test the claim that a higher high school G.P.A. indicates higher score in the placement test. Base your decision on the P-value. Answer "Reject H0 and support H1"
or "Support H0 and reject H1".
Test the claim that a higher high school G.P.A. indicates higher score in the placement test. Base your decision on the P-value. Answer "Reject H0 and support H1"
or "Support H0 and reject H1".
Question
A random sample of the temperature inside black cars parked for one hour on the roof of a parking garage is shown below.
 When temperature is taken inside white cars under the same conditions, the following is obtained.
 Obtain a 90% confidence interval for the difference in mean temperatures. Round your answer to two decimal places.
When temperature is taken inside white cars under the same conditions, the following is obtained. Obtain a 90% confidence interval for the difference in mean temperatures. Round your answer to two decimal places. Question
Question
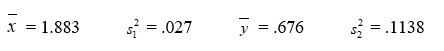
Suppose the following information comes from random samples from normal populations with means  and
and  , respectively.
Using the data given, obtain a 95% confidence interval for the difference in means. Round your answer to three decimal places.
and , respectively. Using the data given, obtain a 95% confidence interval for the difference in means. Round your answer to three decimal places.
Question
Consider the following statistics associated with a productivity index.
 Do these data strongly indicate that the mean index for group 1 is lower than that for group 2? Test at level =0.05 . Answer "Reject null hypothesis"
or "Not reject null hypothesis".
Do these data strongly indicate that the mean index for group 1 is lower than that for group 2? Test at level =0.05 . Answer "Reject null hypothesis"or "Not reject null hypothesis".
Question
If we want to find a 90% confidence interval for the difference of means, we must estimate the degrees of freedom when the sample variances are very different.
Consider two samples of sizes n1 = 22 and n2 = 25, and summary statistics
 Based on these data, estimate the degrees of freedom.
Consider two samples of sizes n1 = 22 and n2 = 25, and summary statistics
Based on these data, estimate the degrees of freedom. Question
In order to determine the volume of water in two wells, a hydraulic engineer measures the number of gallons per hour pumped out from each well. Measures are taken every three hours in a period of seven days, 15 samples are randomly selected; he finds
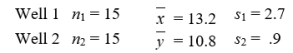 Since s1 and s2 are unequal, we use Satterthwaite correction. Find the degrees of freedom.
A) 18
B) 17
C) 31
D) 32
Since s1 and s2 are unequal, we use Satterthwaite correction. Find the degrees of freedom.A) 18
B) 17
C) 31
D) 32
Question
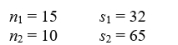
Given here are the sample sizes and the sample standard deviations for independent random samples from two populations. State which of the three test you would use in testing hypotheses about: (1) Z test, (2) t test with pooling, (3) approximate t test with estimated degrees of freedom. Answer 1, 2, or 3.
Question
There are two scales at a student athletic facility. To determine if the two scales give similar readings, five students weigh themselves on each scale. They obtain
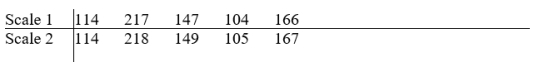 Find a 95% confidence interval for the mean difference readings. Round your answer to three decimal places.
Find a 95% confidence interval for the mean difference readings. Round your answer to three decimal places. Question
The following table shows the annual best time (in seconds) of two athletes in the 200 meters competition through several years.
 Use an approximate t test to find a 95% confidence interval for the difference in mean times for both athletes. Round your answer to three decimal places.
Use an approximate t test to find a 95% confidence interval for the difference in mean times for both athletes. Round your answer to three decimal places. Question
Question
Question
Given the following matched pairs sample,
A) Evaluate the t statistic .

B) How many degrees of freedom does this t have?
A) Evaluate the t statistic .
B) How many degrees of freedom does this t have?
Question
When doing the tunnels for a subway train, two different types of roadheaders are used. The following data are collected concerning the time used for each type to cover the same distance.
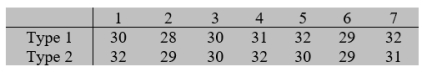 The type 2 manufacturers claim that their roadheader is faster than type 1. Do the data substantiate the claim? Use α=0.05. Answer "H0 is rejected at α=0.05"
or "H0 is not rejected at α=0.05".
The type 2 manufacturers claim that their roadheader is faster than type 1. Do the data substantiate the claim? Use α=0.05. Answer "H0 is rejected at α=0.05"or "H0 is not rejected at α=0.05".
Question
When doing the tunnels for a subway train, two different types of roadheaders are used. The following data are collected concerning the time used for each type to cover the same distance.
 Determine a 90% confidence interval for the mean difference of times between the two types of roadheaders. Round your answer to three decimal places.
Determine a 90% confidence interval for the mean difference of times between the two types of roadheaders. Round your answer to three decimal places. Question
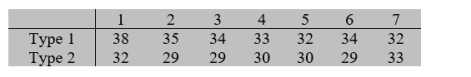
After a series of tropical storms, prices of many essential items were higher; authorities claim gasoline price gouging. The following table shows the average price (in cents) of a gallon of gasoline after and before the storms.
 Find a 95% confidence interval for the mean difference of prices. Round your answer to three decimal places.
Find a 95% confidence interval for the mean difference of prices. Round your answer to three decimal places. Question
After a series of tropical storms, prices of many essential items were higher; authorities claim gasoline price gouging. The following table shows the average price (in cents) of a gallon of gasoline after and before the storms.
 Is there strong evidence that supports authorities claim? Test with =0.05.
Is there strong evidence that supports authorities claim? Test with =0.05. Question
In a study of the paying form tendencies between genders, the following data is obtained.
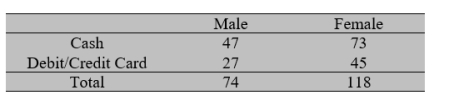 Find a 95% confidence interval for the difference of proportions p1 - p2, where p1 is the proportion of male paying cash and p2 is the proportion of female paying cash. Round your answer to two decimal places.
Find a 95% confidence interval for the difference of proportions p1 - p2, where p1 is the proportion of male paying cash and p2 is the proportion of female paying cash. Round your answer to two decimal places. Question
In a study of the paying form tendencies between genders, the following data is obtained.
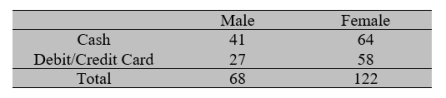 Perform the Z test for the null hypothesis H0: p1 = p2 versus H1: p1 < p2, where p1 is the proportion of male paying cash and p2 is the proportion of female paying cash. Take α=0.05. Answer "H0 is rejected at α=0.05"
or "H0 is not rejected at α=0.05".
Perform the Z test for the null hypothesis H0: p1 = p2 versus H1: p1 < p2, where p1 is the proportion of male paying cash and p2 is the proportion of female paying cash. Take α=0.05. Answer "H0 is rejected at α=0.05"or "H0 is not rejected at α=0.05".
Question
In a comparative study of two new video games, A and B, 120 persons tried game A and 150 persons tried game B, and the following results were obtained.
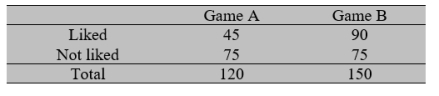 Do these results demonstrate a significantly higher satisfaction rate with game B than game A? Test at α =0.05. Answer "H0 is rejected at α =0.05"
or "H0 is not rejected at α=0.05".
Do these results demonstrate a significantly higher satisfaction rate with game B than game A? Test at α =0.05. Answer "H0 is rejected at α =0.05"or "H0 is not rejected at α=0.05".
Question
In a comparative study of two new video games, A and B, 120 persons tried game A and 150 persons tried game B, and the following results were obtained.
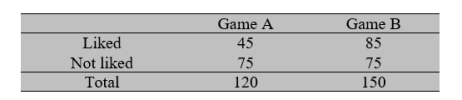 Construct a 95% confidence interval for the difference in the satisfaction rates of the two games. Round your answer to two decimal places.
Construct a 95% confidence interval for the difference in the satisfaction rates of the two games. Round your answer to two decimal places. Question
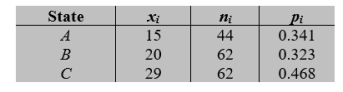
In a survey conducted in northern states, a large number of persons was asked to respond to the statement "The weather in this state is great year round"
on a five point Likert scale, from "strongly unfavorable to the statement"
(1) to "strongly favorable to the statement"
(5). A count of those who are strongly favorable to the statement for each of the three states used in the study, yielded the summary statistics.
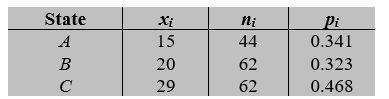
Test equality of the proportions for states B and C versus a two-sided alternative. Take α=0.05. Answer "H0 is rejected at α=0.05"
or "H0 is not rejected at α=0.05".
on a five point Likert scale, from "strongly unfavorable to the statement"
(1) to "strongly favorable to the statement"
(5). A count of those who are strongly favorable to the statement for each of the three states used in the study, yielded the summary statistics.
Test equality of the proportions for states B and C versus a two-sided alternative. Take α=0.05. Answer "H0 is rejected at α=0.05"
or "H0 is not rejected at α=0.05".
Question
In a survey conducted in northern states, a large number of persons was asked to respond to the statement "The weather in this state is great year round"
on a five point Likert scale, from "strongly unfavorable to the statement"
(1) to "strongly favorable to the statement"
(5). A count of those who are strongly favorable to the statement for each of the three states used in the study, yielded the summary statistics.
 Test equality of the proportions for states A and C versus a two-sided alternative. Take α=0.02. Answer "H0 is rejected at α=0.02"
or "H0 is not rejected at α=0.02".
on a five point Likert scale, from "strongly unfavorable to the statement"
(1) to "strongly favorable to the statement"
(5). A count of those who are strongly favorable to the statement for each of the three states used in the study, yielded the summary statistics.
Test equality of the proportions for states A and C versus a two-sided alternative. Take α=0.02. Answer "H0 is rejected at α=0.02"or "H0 is not rejected at α=0.02".
Question
Question
Question
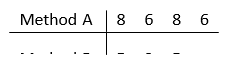
Two methods of memorizing difficult material are being tested. seven students are available. After training, they are given a mem- ory test and the number of mistakes recorded.
(a) How would assign four students to Method A.? The others are assigned to Method B.
(b) Why did you take perform the assignment in Part a?
(c) The data on the number of mistakes are
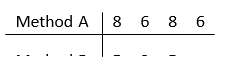
Ignoring lack of normality, conduct a test of hypotheses with the intent of showing that the two mean number of mistakes are different.
(a) How would assign four students to Method A.? The others are assigned to Method B.
(b) Why did you take perform the assignment in Part a?
(c) The data on the number of mistakes are
Ignoring lack of normality, conduct a test of hypotheses with the intent of showing that the two mean number of mistakes are different.
Question
Two methods of memorizing difficult material are being tested. Ten students are available. After training, they are given a memory test and the number of mistakes recorded.
(a) How would assign five students to each of the methods.?
(b) The data on the number of mistakes are
Ignoring lack of normality, obtain a 95 % confidence interval for the difference of mean number of mistakes.
(c) Is the true difference of population means contained in your interval in Part b? Explain.
(d) Explain why you are 95 % confident about your interval in part b covering the difference of population means.
Question
Question
In order to study the effect of color on the sales of cashew nuts, a company constructed two identical displays. One contained pack- ages of nuts wrapped in clear cellophane and the nuts in the other were wrapped in red cellophane. One of each was placed on oppo- site sides of the cash register.
(a) How would assign the position (L or R) at each of the six locations?
(b) The resulting sales are
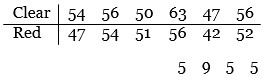 Let µ =population mean wingspan in centimeters. Formulate the hypotheses when the intent of the test is to show that the sales are higher with clear wrappings.
(c) Conduct a test of hypotheses using a t-statistic. Take = .05
(d) Based on the conclusion to your test in Part c, what error could you have made.
(e) Explain why this possible error will seldom occur.
(a) How would assign the position (L or R) at each of the six locations?
(b) The resulting sales are
Let µ =population mean wingspan in centimeters. Formulate the hypotheses when the intent of the test is to show that the sales are higher with clear wrappings.(c) Conduct a test of hypotheses using a t-statistic. Take = .05
(d) Based on the conclusion to your test in Part c, what error could you have made.
(e) Explain why this possible error will seldom occur.
Question
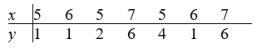
7 A random sample of 5 nine year-old soccer players is selected. All are right-footed. Each player kicks the ball once with each foot and the distance the ball travels before stopping is recorded in yards.
(a) What would you conduct an appropriate randomization?
(b) The data are
![7 A random sample of 5 nine year-old soccer players is selected. All are right-footed. Each player kicks the ball once with each foot and the distance the ball travels before stopping is recorded in yards. (a) What would you conduct an appropriate randomization? (b) The data are fidence interval for the mean difference in distance traveled. item[(c)] What assumption did you make to calculate the 95 % confidence interval? (d) Why are you 95 % confident in the interval you calculated in Part b?<div style=padding-top: 35px>](https://storage.examlex.com/TB10841/11ef019b_aabc_c04a_a255_8da8bd41eb40_TB10841_00.jpg)
fidence interval for the mean difference in distance traveled. item[(c)] What assumption did you make to calculate the 95
% confidence interval?
(d) Why are you 95 % confident in the interval you calculated in Part b?
(a) What would you conduct an appropriate randomization?
(b) The data are
fidence interval for the mean difference in distance traveled. item[(c)] What assumption did you make to calculate the 95
% confidence interval?
(d) Why are you 95 % confident in the interval you calculated in Part b?
Question
Question

Unlock Deck
Sign up to unlock the cards in this deck!
Unlock Deck
Unlock Deck
1/37
Play
Full screen (f)
Deck 10: Comparing Two Treatments
1
The first eight letters are to serve as subjects. How many ways are there to split them into two groups with the first having 6 letters and the second 2 letters?
28
2
There are six cars that we use as subjects in a matched pairs experiment.
A) How many sets of pairing are if subjects are pair by year?
B) If subjects are paired by color, how many sets of pairing are available for the experiment?
A) How many sets of pairing are if subjects are pair by year?
B) If subjects are paired by color, how many sets of pairing are available for the experiment?
Part A: 9
Part B: 6
Part B: 6
3
If in an independent sample design, a collection of size n1 + n2 subjects is randomly divided into two groups and the responses are recorded, then
n1 = n2.
n1 = n2.
False
4
The height (in meters) of 173 college professors and 213 miners were recorded, yielded the summary statistics.
Construct a 95% confidence interval for difference in mean of heights.
A) (.010, .050)
B) (.020, .060)
C) (.030, .070)
D) (.040, .080)
Construct a 95% confidence interval for difference in mean of heights.A) (.010, .050)
B) (.020, .060)
C) (.030, .070)
D) (.040, .080)
Unlock Deck
Unlock for access to all 37 flashcards in this deck.
Unlock Deck
k this deck
5
The height (in meters) of 189 college professors and 201 miners were recorded, yielded the summary statistics.
Do the data provide strong evidence that the mean height of college professors is different from the mean height of miners? Test at
Do the data provide strong evidence that the mean height of college professors is different from the mean height of miners? Test at Unlock Deck
Unlock for access to all 37 flashcards in this deck.
Unlock Deck
k this deck
6
A small liberal arts college has an English placement test whose scores are in the range 0-120. This year there are 245 freshmen whose high school G.P.A. is higher than the high school G.P.A. of the 266 sophomore students. The school administration believes that a higher G.P.A. indicates higher scores in the placement test. Calculations of the mean and the standard deviation for the two sets of data give:
Test the claim that a higher high school G.P.A. indicates higher score in the placement test. Base your decision on the P-value. Answer "Reject H0 and support H1"
or "Support H0 and reject H1".
Test the claim that a higher high school G.P.A. indicates higher score in the placement test. Base your decision on the P-value. Answer "Reject H0 and support H1"
or "Support H0 and reject H1".
Unlock Deck
Unlock for access to all 37 flashcards in this deck.
Unlock Deck
k this deck
7
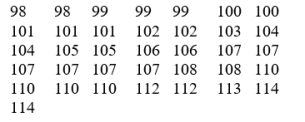
A random sample of the temperature inside black cars parked for one hour on the roof of a parking garage is shown below.
When temperature is taken inside white cars under the same conditions, the following is obtained.
Obtain a 90% confidence interval for the difference in mean temperatures. Round your answer to two decimal places.
When temperature is taken inside white cars under the same conditions, the following is obtained. Obtain a 90% confidence interval for the difference in mean temperatures. Round your answer to two decimal places. Unlock Deck
Unlock for access to all 37 flashcards in this deck.
Unlock Deck
k this deck
8
Calculate the observed value from these two samples. Round your answer to the nearest tenth.
Sample from population 1: 8 1 8 8 1 8 1
Sample from population 2: 5 8 7 8 1 7
Sample from population 1: 8 1 8 8 1 8 1
Sample from population 2: 5 8 7 8 1 7
Unlock Deck
Unlock for access to all 37 flashcards in this deck.
Unlock Deck
k this deck
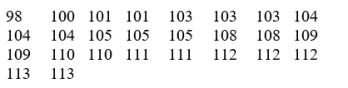
9
Suppose the following information comes from random samples from normal populations with means and , respectively.
Using the data given, obtain a 95% confidence interval for the difference in means. Round your answer to three decimal places.
and , respectively. Using the data given, obtain a 95% confidence interval for the difference in means. Round your answer to three decimal places.
Unlock Deck
Unlock for access to all 37 flashcards in this deck.
Unlock Deck
k this deck
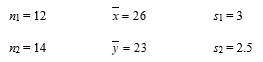
10
Consider the following statistics associated with a productivity index.
Do these data strongly indicate that the mean index for group 1 is lower than that for group 2? Test at level =0.05 . Answer "Reject null hypothesis"
or "Not reject null hypothesis".
Do these data strongly indicate that the mean index for group 1 is lower than that for group 2? Test at level =0.05 . Answer "Reject null hypothesis"or "Not reject null hypothesis".
Unlock Deck
Unlock for access to all 37 flashcards in this deck.
Unlock Deck
k this deck
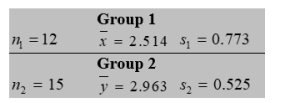
11
If we want to find a 90% confidence interval for the difference of means, we must estimate the degrees of freedom when the sample variances are very different.
Consider two samples of sizes n1 = 22 and n2 = 25, and summary statistics
Based on these data, estimate the degrees of freedom.
Consider two samples of sizes n1 = 22 and n2 = 25, and summary statistics
Based on these data, estimate the degrees of freedom. Unlock Deck
Unlock for access to all 37 flashcards in this deck.
Unlock Deck
k this deck
12
In order to determine the volume of water in two wells, a hydraulic engineer measures the number of gallons per hour pumped out from each well. Measures are taken every three hours in a period of seven days, 15 samples are randomly selected; he finds
Since s1 and s2 are unequal, we use Satterthwaite correction. Find the degrees of freedom.
A) 18
B) 17
C) 31
D) 32
Since s1 and s2 are unequal, we use Satterthwaite correction. Find the degrees of freedom.A) 18
B) 17
C) 31
D) 32
Unlock Deck
Unlock for access to all 37 flashcards in this deck.
Unlock Deck
k this deck
13
Given here are the sample sizes and the sample standard deviations for independent random samples from two populations. State which of the three test you would use in testing hypotheses about: (1) Z test, (2) t test with pooling, (3) approximate t test with estimated degrees of freedom. Answer 1, 2, or 3.
Unlock Deck
Unlock for access to all 37 flashcards in this deck.
Unlock Deck
k this deck
14
There are two scales at a student athletic facility. To determine if the two scales give similar readings, five students weigh themselves on each scale. They obtain
Find a 95% confidence interval for the mean difference readings. Round your answer to three decimal places.
Find a 95% confidence interval for the mean difference readings. Round your answer to three decimal places. Unlock Deck
Unlock for access to all 37 flashcards in this deck.
Unlock Deck
k this deck
15
The following table shows the annual best time (in seconds) of two athletes in the 200 meters competition through several years.
Use an approximate t test to find a 95% confidence interval for the difference in mean times for both athletes. Round your answer to three decimal places.
Use an approximate t test to find a 95% confidence interval for the difference in mean times for both athletes. Round your answer to three decimal places. Unlock Deck
Unlock for access to all 37 flashcards in this deck.
Unlock Deck
k this deck
16
Randomization prevents uncontrolled sources of variation from influencing the responses in a systematic manner.
Unlock Deck
Unlock for access to all 37 flashcards in this deck.
Unlock Deck
k this deck
17
How many different ways are there to randomly allocate 5 subjects from among Robert, Mildred, Roy, Florence, Pauline, Samuel, Herman to be in the control group. The others will receive a treatment.
Unlock Deck
Unlock for access to all 37 flashcards in this deck.
Unlock Deck
k this deck
18
Given the following matched pairs sample,
A) Evaluate the t statistic .
B) How many degrees of freedom does this t have?
A) Evaluate the t statistic .
B) How many degrees of freedom does this t have?
Unlock Deck
Unlock for access to all 37 flashcards in this deck.
Unlock Deck
k this deck
19
When doing the tunnels for a subway train, two different types of roadheaders are used. The following data are collected concerning the time used for each type to cover the same distance.
The type 2 manufacturers claim that their roadheader is faster than type 1. Do the data substantiate the claim? Use α=0.05. Answer "H0 is rejected at α=0.05"
or "H0 is not rejected at α=0.05".
The type 2 manufacturers claim that their roadheader is faster than type 1. Do the data substantiate the claim? Use α=0.05. Answer "H0 is rejected at α=0.05"or "H0 is not rejected at α=0.05".
Unlock Deck
Unlock for access to all 37 flashcards in this deck.
Unlock Deck
k this deck
20
When doing the tunnels for a subway train, two different types of roadheaders are used. The following data are collected concerning the time used for each type to cover the same distance.
Determine a 90% confidence interval for the mean difference of times between the two types of roadheaders. Round your answer to three decimal places.
Determine a 90% confidence interval for the mean difference of times between the two types of roadheaders. Round your answer to three decimal places. Unlock Deck
Unlock for access to all 37 flashcards in this deck.
Unlock Deck
k this deck
21
After a series of tropical storms, prices of many essential items were higher; authorities claim gasoline price gouging. The following table shows the average price (in cents) of a gallon of gasoline after and before the storms.
Find a 95% confidence interval for the mean difference of prices. Round your answer to three decimal places.
Find a 95% confidence interval for the mean difference of prices. Round your answer to three decimal places. Unlock Deck
Unlock for access to all 37 flashcards in this deck.
Unlock Deck
k this deck
22
After a series of tropical storms, prices of many essential items were higher; authorities claim gasoline price gouging. The following table shows the average price (in cents) of a gallon of gasoline after and before the storms.
Is there strong evidence that supports authorities claim? Test with =0.05.
Is there strong evidence that supports authorities claim? Test with =0.05. Unlock Deck
Unlock for access to all 37 flashcards in this deck.
Unlock Deck
k this deck
23
In a study of the paying form tendencies between genders, the following data is obtained.
Find a 95% confidence interval for the difference of proportions p1 - p2, where p1 is the proportion of male paying cash and p2 is the proportion of female paying cash. Round your answer to two decimal places.
Find a 95% confidence interval for the difference of proportions p1 - p2, where p1 is the proportion of male paying cash and p2 is the proportion of female paying cash. Round your answer to two decimal places. Unlock Deck
Unlock for access to all 37 flashcards in this deck.
Unlock Deck
k this deck
24
In a study of the paying form tendencies between genders, the following data is obtained.
Perform the Z test for the null hypothesis H0: p1 = p2 versus H1: p1 < p2, where p1 is the proportion of male paying cash and p2 is the proportion of female paying cash. Take α=0.05. Answer "H0 is rejected at α=0.05"
or "H0 is not rejected at α=0.05".
Perform the Z test for the null hypothesis H0: p1 = p2 versus H1: p1 < p2, where p1 is the proportion of male paying cash and p2 is the proportion of female paying cash. Take α=0.05. Answer "H0 is rejected at α=0.05"or "H0 is not rejected at α=0.05".
Unlock Deck
Unlock for access to all 37 flashcards in this deck.
Unlock Deck
k this deck
25
In a comparative study of two new video games, A and B, 120 persons tried game A and 150 persons tried game B, and the following results were obtained.
Do these results demonstrate a significantly higher satisfaction rate with game B than game A? Test at α =0.05. Answer "H0 is rejected at α =0.05"
or "H0 is not rejected at α=0.05".
Do these results demonstrate a significantly higher satisfaction rate with game B than game A? Test at α =0.05. Answer "H0 is rejected at α =0.05"or "H0 is not rejected at α=0.05".
Unlock Deck
Unlock for access to all 37 flashcards in this deck.
Unlock Deck
k this deck
26
In a comparative study of two new video games, A and B, 120 persons tried game A and 150 persons tried game B, and the following results were obtained.
Construct a 95% confidence interval for the difference in the satisfaction rates of the two games. Round your answer to two decimal places.
Construct a 95% confidence interval for the difference in the satisfaction rates of the two games. Round your answer to two decimal places. Unlock Deck
Unlock for access to all 37 flashcards in this deck.
Unlock Deck
k this deck
27
In a survey conducted in northern states, a large number of persons was asked to respond to the statement "The weather in this state is great year round"
on a five point Likert scale, from "strongly unfavorable to the statement"
(1) to "strongly favorable to the statement"
(5). A count of those who are strongly favorable to the statement for each of the three states used in the study, yielded the summary statistics.
Test equality of the proportions for states B and C versus a two-sided alternative. Take α=0.05. Answer "H0 is rejected at α=0.05"
or "H0 is not rejected at α=0.05".
Unlock Deck
Unlock for access to all 37 flashcards in this deck.
Unlock Deck
k this deck
28
In a survey conducted in northern states, a large number of persons was asked to respond to the statement "The weather in this state is great year round"
on a five point Likert scale, from "strongly unfavorable to the statement"
(1) to "strongly favorable to the statement"
(5). A count of those who are strongly favorable to the statement for each of the three states used in the study, yielded the summary statistics.
Test equality of the proportions for states A and C versus a two-sided alternative. Take α=0.02. Answer "H0 is rejected at α=0.02"
or "H0 is not rejected at α=0.02".
on a five point Likert scale, from "strongly unfavorable to the statement"
(1) to "strongly favorable to the statement"
(5). A count of those who are strongly favorable to the statement for each of the three states used in the study, yielded the summary statistics.
Test equality of the proportions for states A and C versus a two-sided alternative. Take α=0.02. Answer "H0 is rejected at α=0.02"or "H0 is not rejected at α=0.02".
Unlock Deck
Unlock for access to all 37 flashcards in this deck.
Unlock Deck
k this deck
29
Students in the first semester French course are split into two groups, those who had completed a previous language course and those who did not. Samples of size 40 were selected from each group and their score on the first French exam recorded. The summary statistics are
Previous course: n1 = 40 x = 71.2 s1 = 10.3
No previous course: n2 = 40 y = 64.9 s2 = 9.92
Conduct a test of hypotheses with the intent of showing that the mean test score for persons who completed a previous language course is higher than the mean score of those who did not. Take α = .05.
Previous course: n1 = 40 x = 71.2 s1 = 10.3
No previous course: n2 = 40 y = 64.9 s2 = 9.92
Conduct a test of hypotheses with the intent of showing that the mean test score for persons who completed a previous language course is higher than the mean score of those who did not. Take α = .05.
Unlock Deck
Unlock for access to all 37 flashcards in this deck.
Unlock Deck
k this deck
30
Students in the first semester French course are split into two groups, those who had completed a previous language course and those who did not. Samples of size 40 were selected from each group and their score on the first French exam recorded. The summary statistics are
Previous course: n1 = 40 x = 71.2 s1 = 10.3
No previous course: n2 = 40 y = 64.9 s2 = 9.92
Calculate a 95 % confidence interval for the difference in mean test scores. a previous language course.
Previous course: n1 = 40 x = 71.2 s1 = 10.3
No previous course: n2 = 40 y = 64.9 s2 = 9.92
Calculate a 95 % confidence interval for the difference in mean test scores. a previous language course.
Unlock Deck
Unlock for access to all 37 flashcards in this deck.
Unlock Deck
k this deck
31
Two methods of memorizing difficult material are being tested. seven students are available. After training, they are given a mem- ory test and the number of mistakes recorded.
(a) How would assign four students to Method A.? The others are assigned to Method B.
(b) Why did you take perform the assignment in Part a?
(c) The data on the number of mistakes are
Ignoring lack of normality, conduct a test of hypotheses with the intent of showing that the two mean number of mistakes are different.
Unlock Deck
Unlock for access to all 37 flashcards in this deck.
Unlock Deck
k this deck
32
Two methods of memorizing difficult material are being tested. Ten students are available. After training, they are given a memory test and the number of mistakes recorded.
(a) How would assign five students to each of the methods.?
(b) The data on the number of mistakes are
Ignoring lack of normality, obtain a 95 % confidence interval for the difference of mean number of mistakes.
(c) Is the true difference of population means contained in your interval in Part b? Explain.
(d) Explain why you are 95 % confident about your interval in part b covering the difference of population means.
(a) How would assign five students to each of the methods.?
(b) The data on the number of mistakes are
Ignoring lack of normality, obtain a 95 % confidence interval for the difference of mean number of mistakes.
(c) Is the true difference of population means contained in your interval in Part b? Explain.
(d) Explain why you are 95 % confident about your interval in part b covering the difference of population means.
Unlock Deck
Unlock for access to all 37 flashcards in this deck.
Unlock Deck
k this deck
33
5 In a study of the effect of combining diet and exercise on reducing the amount of calcium loss in mature, a control group was also formed. The calcium loss(grams) in the right wrist over a 1 year period produced the summary statistics
Control: n1 = 8 x = 10 s1 = 6
Diet-Exercise: n2 = 10 y = 5 s2 = 3
State the alternative hypothesis when the intent is to show the combination treatment is better than the control. Assume the dis- tributions are normal. Conduct a test of hypotheses with α = .05. Which of following two statistical analyses is most appropriate? Give your reasoning.
Analysis A: Use pooled variance.
Estimate for difference: 10.00
T-Test of difference = 0 (vs >): T-Value = 2.31
P-Value = 0.035 DF = 16
Pooled StDev = 4.5621
Analysis B: Estimate variances separately.
Estimate for difference: 10.00
T-Test of difference = 0 (vs >): T-Value = 2.15 P-Value = 0.060 DF = 9
Unlock Deck
Unlock for access to all 37 flashcards in this deck.
Unlock Deck
k this deck
34
In order to study the effect of color on the sales of cashew nuts, a company constructed two identical displays. One contained pack- ages of nuts wrapped in clear cellophane and the nuts in the other were wrapped in red cellophane. One of each was placed on oppo- site sides of the cash register.
(a) How would assign the position (L or R) at each of the six locations?
(b) The resulting sales are
Let µ =population mean wingspan in centimeters. Formulate the hypotheses when the intent of the test is to show that the sales are higher with clear wrappings.
(c) Conduct a test of hypotheses using a t-statistic. Take = .05
(d) Based on the conclusion to your test in Part c, what error could you have made.
(e) Explain why this possible error will seldom occur.
(a) How would assign the position (L or R) at each of the six locations?
(b) The resulting sales are
Let µ =population mean wingspan in centimeters. Formulate the hypotheses when the intent of the test is to show that the sales are higher with clear wrappings.(c) Conduct a test of hypotheses using a t-statistic. Take = .05
(d) Based on the conclusion to your test in Part c, what error could you have made.
(e) Explain why this possible error will seldom occur.
Unlock Deck
Unlock for access to all 37 flashcards in this deck.
Unlock Deck
k this deck
35
7 A random sample of 5 nine year-old soccer players is selected. All are right-footed. Each player kicks the ball once with each foot and the distance the ball travels before stopping is recorded in yards.
(a) What would you conduct an appropriate randomization?
(b) The data are
fidence interval for the mean difference in distance traveled. item[(c)] What assumption did you make to calculate the 95
% confidence interval?
(d) Why are you 95 % confident in the interval you calculated in Part b?
(a) What would you conduct an appropriate randomization?
(b) The data are
fidence interval for the mean difference in distance traveled. item[(c)] What assumption did you make to calculate the 95
% confidence interval?
(d) Why are you 95 % confident in the interval you calculated in Part b?
Unlock Deck
Unlock for access to all 37 flashcards in this deck.
Unlock Deck
k this deck
36
A survey of males and females asked the question: Do you prefer wine over other alcoholic beverages? The summary of answers, from those who drink, are
Males n1 = 150 x = 84
Females n2 = 200 y = 102
(a) Conduct a test of hypotheses with the intent of showing that a higher proportion of females prefer win over other alcoholic beverages. Take α = .05.
(b) With regard to you decision in Part a, what possible error could you have made?
Males n1 = 150 x = 84
Females n2 = 200 y = 102
(a) Conduct a test of hypotheses with the intent of showing that a higher proportion of females prefer win over other alcoholic beverages. Take α = .05.
(b) With regard to you decision in Part a, what possible error could you have made?
Unlock Deck
Unlock for access to all 37 flashcards in this deck.
Unlock Deck
k this deck
37
There are two methods of teaching the skating technique in cross- country skiing. One-hundred fifty persons who finished last year's course, introduction to cross-country skiing, are available. Half will be taught by each method. After four one-hour lessons, each will be rated as satisfactory of not. The number of satisfactory ratings will be recorded.
(a) The goal is to compare the two methods. How would you randomize the subjects? Name one uncontrolled variable that could systematically effect the comparison if you don't ran- domize.
(b) The summary statistics are
Method 1 n1 = 75 x = 62
Method 2 n1 = 75 y = 47
Calculate a 98 % confidence interval for the difference in pro- portions that are satisfactory.
Unlock Deck
Unlock for access to all 37 flashcards in this deck.
Unlock Deck
k this deck
Unlock Deck
Unlock for access to all 37 flashcards in this deck.


