Deck 2: Markets and Prices
Full screen (f)
Question
Question
The following questions are based on the following graph:
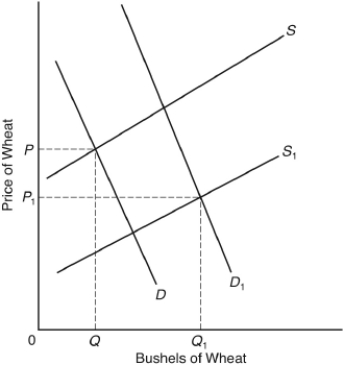
The curves D and S represent the market demand and supply curves for wheat in 1960. The curves D₁ and S₁ represent the market demand and supply curves in 2000. Assume there were no support programs in either year.
In the graph
A) demand rose and supply fell.
B) demand fell and supply rose.
C) both demand and supply fell.
D) both demand and supply rose.
E) demand and supply remained unchanged, but the quantity demanded rose and the quantity supplied fell.
Question
Question
Question
Question
Question
Question
Question
The following questions are based on the following table:

This table shows the number of theater tickets the public is willing to buy for a particular show at various prices.If we plotted the points in this table,the result would be a ________ curve.
A) growth
B) demand
C) cost
D) supply
E) production possibilities
This table shows the number of theater tickets the public is willing to buy for a particular show at various prices.If we plotted the points in this table,the result would be a ________ curve.
A) growth
B) demand
C) cost
D) supply
E) production possibilities
Question
Question
Question
Question
Question
Question
Question
Question
Question
Question
Question
Question
The following questions are based on the following graph showing the market for corn:
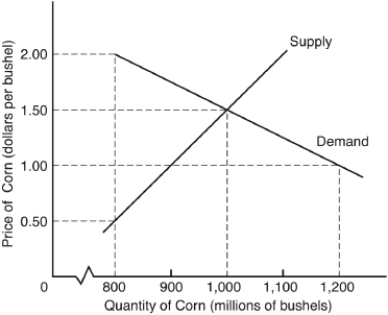
If farmers currently produce 800 bushels
A) the actual price is $2.
B) the market is in equilibrium.
C) the actual price is below the equilibrium price and will tend to rise.
D) only increases in demand would encourage the supply to rise above 800 units.
E) the market exhibits a surplus.
If farmers currently produce 800 bushels
A) the actual price is $2.
B) the market is in equilibrium.
C) the actual price is below the equilibrium price and will tend to rise.
D) only increases in demand would encourage the supply to rise above 800 units.
E) the market exhibits a surplus.
Question
The following questions are based on the following diagram:
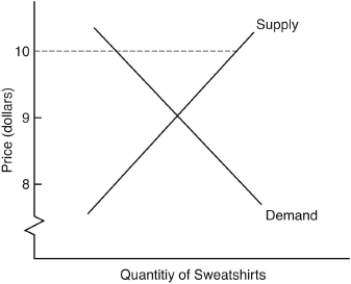
If the actual price of sweatshirts is $10 each,the market is not in equilibrium because
A) all consumers willing to pay $10 for a sweatshirt are unable to buy one.
B) there is excess demand.
C) the rate at which sweatshirts are supplied is greater than the rate at which they are demanded.
D) the price at which sweatshirts are demanded is less than the price at which they are supplied.
E) the price is not equal to the quantity.
Question
The following questions are based on the following diagram:
In the diagram,movement toward equilibrium would cause the
A) supply curve to shift to the right and the demand curve to shift to the left.
B) actual price to fall below $10 and the quantity supplied and demanded to fall.
C) actual price to remain the same but the supply to drift to the left as producers cut down on production.
D) actual price to rise above $10 and the quantity demanded to fall.
E) actual price to fall below $10, the quantity supplied to fall, and the quantity demanded to rise.
Question
Question
The following questions are based on the following graph illustrating the market for scallops:
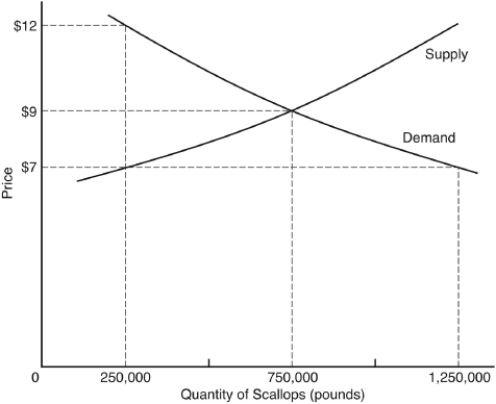
The equilibrium price is ________ per pound.
A) more than $12
B) $12
C) $9
D) $7
E) less than $7
The equilibrium price is ________ per pound.
A) more than $12
B) $12
C) $9
D) $7
E) less than $7
Question
Question
The following questions are based on the following graph showing the market for corn:
If the quantity supplied were less than the quantity demanded at a particular price,the equilibrium price would be achieved by
A) rationing.
B) a decrease in supply.
C) an increase in the price that increases the quantity supplied and decreases the quantity demanded.
D) the piling up of inventories until firms were forced to lower the price.
E) an increase in demand that would induce firms to step up production.
Question
Question
Question
Question
Question
The following questions are based on the following diagram:
At the equilibrium price
A) scarcity is eliminated.
B) everyone is content.
C) there is no inflation.
D) price equals quantity.
E) quantity demanded equals quantity supplied.
At the equilibrium price
A) scarcity is eliminated.
B) everyone is content.
C) there is no inflation.
D) price equals quantity.
E) quantity demanded equals quantity supplied.
Question
The following questions are based on the following graph showing the market for corn:
At the price of $1 per bushel,there would be an excess ________ million bushels.
A) demand of 200
B) demand of 300
C) demand of 400
D) supply of 200
E) supply of 300
At the price of $1 per bushel,there would be an excess ________ million bushels.
A) demand of 200
B) demand of 300
C) demand of 400
D) supply of 200
E) supply of 300
Question
Question
The following questions are based on the following graph illustrating the market for scallops:
If the actual price for scallops is $7 per pound,there would be an excess demand of ________ pounds.
A) zero
B) 250,000
C) 750,000
D) 1,000,000
E) 1,250,000
If the actual price for scallops is $7 per pound,there would be an excess demand of ________ pounds.
A) zero
B) 250,000
C) 750,000
D) 1,000,000
E) 1,250,000
Question
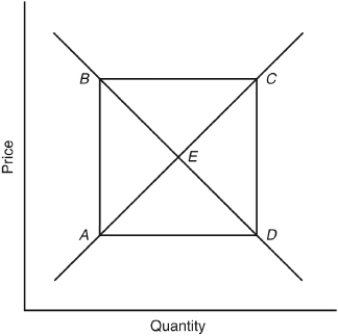
The following questions are based on the following diagram:
In the market diagram,excess demand is best represented by triangle
A) ABE.
B) ABD.
C) BCE.
D) AED.
E) CED.
In the market diagram,excess demand is best represented by triangle
A) ABE.
B) ABD.
C) BCE.
D) AED.
E) CED.
Question
The following questions are based on the following diagram:
On the basis of the information provided in the diagram,the closed triangle represents
A) excess supply.
B) excess demand.
C) equilibrium prices.
D) actual prices.
E) surplus value.
On the basis of the information provided in the diagram,the closed triangle represents
A) excess supply.
B) excess demand.
C) equilibrium prices.
D) actual prices.
E) surplus value.
Question
The following questions are based on the following diagram:
In the market diagram,excess supply is best represented by triangle
A) ABC.
B) CDB.
C) AED.
D) DEC.
E) BEC.
In the market diagram,excess supply is best represented by triangle
A) ABC.
B) CDB.
C) AED.
D) DEC.
E) BEC.
Question
Question
Question
Question
The following questions are based on the following circular flow diagram:
In a free market,the price system provides for an adequate rate of growth by
A) making the augmentation of a society's resources unprofitable.
B) ensuring an upward-sloping supply curve.
C) meeting each consumer's demand.
D) providing strong incentives for firms to introduce new technology.
E) ensuring that each good is produced in the proper amount.
Question
Question
The following questions are based on the following diagram:
For a market to exhibit excess supply
A) demand must exceed supply.
B) the market must be growing.
C) demand must increase.
D) the equilibrium price must be too high to clear the market.
E) the actual price must be above the equilibrium price.
For a market to exhibit excess supply
A) demand must exceed supply.
B) the market must be growing.
C) demand must increase.
D) the equilibrium price must be too high to clear the market.
E) the actual price must be above the equilibrium price.
Question
Question
Question
Question
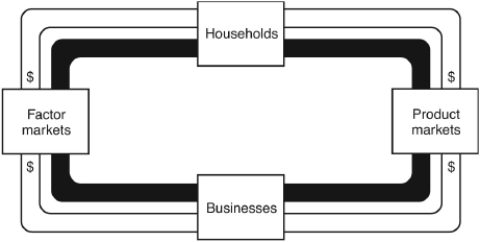
The following questions are based on the following circular flow diagram:
In the model of the circular flow
A) the dollar flows on the left side represent expenditures for final goods and services.
B) the dollar flows on the right side represent incomes being paid by businesses to consumers.
C) resources flow to businesses on the left side, and final goods and services flow to households on the right side.
D) households are buyers of factors of production on the left side and sellers of goods and services on the right side.
E) the dollar value on the left side is unrelated to the dollar value on the right side.
Question
Question
Question
The following questions are based on the following circular flow diagram:
In this model of the circular flow,the dollar flows
A) are clockwise.
B) are counterclockwise.
C) on the right side are clockwise and those on the left side are counterclockwise.
D) on the right side are counterclockwise and those on the left side are clockwise.
E) on the right side are greater than those on the left side.
Question
Question
The following questions are based on the following diagram:
For a market to exhibit excess demand
A) supply must exceed demand.
B) the equilibrium price must be too high to clear the market.
C) the actual price must be below the equilibrium price.
D) the demand curve must slope upward.
E) the market must be growing.
For a market to exhibit excess demand
A) supply must exceed demand.
B) the equilibrium price must be too high to clear the market.
C) the actual price must be below the equilibrium price.
D) the demand curve must slope upward.
E) the market must be growing.
Question
The following questions are based on the following circular flow diagram:
In a simple circular flow model of an economy
A) households buy factors of production from businesses.
B) the flow of income to households from businesses is greater than the flow of expenditures by households for goods produced by businesses.
C) businesses buy final goods and services produced by households.
D) the total amount of labor hours worked equals the total number of goods produced.
E) households are owners of resources and purchasers of final goods and services.
Question
Which of the conditions listed best summarizes the following market data?

A) market equilibrium
B) actual price below equilibrium price
C) excess supply
D) shortage
E) demand exceeds supply
A) market equilibrium
B) actual price below equilibrium price
C) excess supply
D) shortage
E) demand exceeds supply
Question
Question
The following questions are based on the following circular flow diagram:
In the circular flow model,income to the household is,from the point of view of the firm that pays this income,the same things as
A) investment.
B) savings.
C) revenue.
D) production costs.
E) working capital.
In the circular flow model,income to the household is,from the point of view of the firm that pays this income,the same things as
A) investment.
B) savings.
C) revenue.
D) production costs.
E) working capital.
Question
The following questions are based on the following table:

The profit the producer makes using this minimum cost technique is
A) $4.
B) $9.
C) $10.
D) $12.
E) $14.
The profit the producer makes using this minimum cost technique is
A) $4.
B) $9.
C) $10.
D) $12.
E) $14.
Question
The following questions are based on the following table:
A firm is able to purchase 1 unit of raw material for $2 and convert that unit into a finished product that sells for $25.Four production techniques are available,as shown in the table.If labor costs $1 per hour and machine time costs $3 per hour,the firm should
A) use technique A.
B) use technique B.
C) use technique C.
D) use technique D.
E) not produce at all.
Question
Question
Question
Question
Question
Question
Question
Question
Question
Question
Question
Question
Question
Question
Question
Question
Question
Question
Question

Unlock Deck
Sign up to unlock the cards in this deck!
Unlock Deck
Unlock Deck
1/78
Play
Full screen (f)
Deck 2: Markets and Prices
1
When an increase in the price of good A leads to a decrease in the price of good B,then these goods are said to be
A) generic.
B) inferior.
C) abundant.
D) complements.
E) replacements.
A) generic.
B) inferior.
C) abundant.
D) complements.
E) replacements.
D
2
The following questions are based on the following graph:
The curves D and S represent the market demand and supply curves for wheat in 1960. The curves D₁ and S₁ represent the market demand and supply curves in 2000. Assume there were no support programs in either year.
In the graph
A) demand rose and supply fell.
B) demand fell and supply rose.
C) both demand and supply fell.
D) both demand and supply rose.
E) demand and supply remained unchanged, but the quantity demanded rose and the quantity supplied fell.
D
3
The U.S.economy may be best characterized as an example of
A) market socialism.
B) opportunistic imperialism.
C) militaristic capitalism.
D) pure capitalism.
E) mixed capitalism.
A) market socialism.
B) opportunistic imperialism.
C) militaristic capitalism.
D) pure capitalism.
E) mixed capitalism.
E
4
A significant increase in the toll rates on a major turnpike leads to an increase in the
A) number of vehicles using the turnpike.
B) demand for vehicle and food services provided by the turnpike service areas.
C) demand for toll booth attendants.
D) supply of turnpikes in the same region.
E) demand for travel on parallel, nontoll roadways.
A) number of vehicles using the turnpike.
B) demand for vehicle and food services provided by the turnpike service areas.
C) demand for toll booth attendants.
D) supply of turnpikes in the same region.
E) demand for travel on parallel, nontoll roadways.
Unlock Deck
Unlock for access to all 78 flashcards in this deck.
Unlock Deck
k this deck
5
A fall in which of the following increases the demand for large automobiles?
A) the price of small automobiles
B) the price of gasoline
C) the price of large automobiles
D) buyers' incomes
E) consumers' preferences for driving large automobiles
A) the price of small automobiles
B) the price of gasoline
C) the price of large automobiles
D) buyers' incomes
E) consumers' preferences for driving large automobiles
Unlock Deck
Unlock for access to all 78 flashcards in this deck.
Unlock Deck
k this deck
6
If 1,375 seats were available at any particular time,the equilibrium price would be
A) $20.
B) $25.
C) $30.
D) $35.
E) $40.
A) $20.
B) $25.
C) $30.
D) $35.
E) $40.
Unlock Deck
Unlock for access to all 78 flashcards in this deck.
Unlock Deck
k this deck
7
Changes in which of the following would be excluded from a list of factors causing the demand curve to shift?
A) consumer tastes
B) consumer incomes
C) the price of the good
D) the number of consumers in the market
E) the level of other prices
A) consumer tastes
B) consumer incomes
C) the price of the good
D) the number of consumers in the market
E) the level of other prices
Unlock Deck
Unlock for access to all 78 flashcards in this deck.
Unlock Deck
k this deck
8
A market demand curve
A) shifts as the price falls.
B) slopes upward from left to right.
C) is unaffected by changes in consumers' tastes and incomes.
D) measures the rate of growth of per capita output.
E) shows the amount buyers would like to purchase at various prices.
A) shifts as the price falls.
B) slopes upward from left to right.
C) is unaffected by changes in consumers' tastes and incomes.
D) measures the rate of growth of per capita output.
E) shows the amount buyers would like to purchase at various prices.
Unlock Deck
Unlock for access to all 78 flashcards in this deck.
Unlock Deck
k this deck
9
The following questions are based on the following table:
This table shows the number of theater tickets the public is willing to buy for a particular show at various prices.If we plotted the points in this table,the result would be a ________ curve.
A) growth
B) demand
C) cost
D) supply
E) production possibilities
This table shows the number of theater tickets the public is willing to buy for a particular show at various prices.If we plotted the points in this table,the result would be a ________ curve.
A) growth
B) demand
C) cost
D) supply
E) production possibilities
Unlock Deck
Unlock for access to all 78 flashcards in this deck.
Unlock Deck
k this deck
10
A change in demand means that there has been a
A) movement along a given demand curve.
B) shift to the right or left of a given demand curve.
C) change in sellers' input prices.
D) corresponding change in supply.
E) permanent disequilibrium condition created in the market.
A) movement along a given demand curve.
B) shift to the right or left of a given demand curve.
C) change in sellers' input prices.
D) corresponding change in supply.
E) permanent disequilibrium condition created in the market.
Unlock Deck
Unlock for access to all 78 flashcards in this deck.
Unlock Deck
k this deck
11
New residents moving into a growing community increase the
A) size of housing.
B) elegance of housing.
C) housing surplus.
D) quantity demanded of housing.
E) demand for housing.
A) size of housing.
B) elegance of housing.
C) housing surplus.
D) quantity demanded of housing.
E) demand for housing.
Unlock Deck
Unlock for access to all 78 flashcards in this deck.
Unlock Deck
k this deck
12
A group of firms and individuals in touch with each other to buy or sell something is called a
A) model.
B) market.
C) merger.
D) microcosm.
E) melee.
A) model.
B) market.
C) merger.
D) microcosm.
E) melee.
Unlock Deck
Unlock for access to all 78 flashcards in this deck.
Unlock Deck
k this deck
13
Increases in demand are caused by
A) decreases in price.
B) increases in costs of production.
C) decreases in the prices of substitute goods.
D) increases in income.
E) decreases in the number of consumers in the market.
A) decreases in price.
B) increases in costs of production.
C) decreases in the prices of substitute goods.
D) increases in income.
E) decreases in the number of consumers in the market.
Unlock Deck
Unlock for access to all 78 flashcards in this deck.
Unlock Deck
k this deck
14
In perfectly competitive markets,prices are
A) set by powerful firms.
B) unaffected by actions of individual buyers or sellers.
C) regulated by government interaction.
D) likely to remain unchanged for long periods of time.
E) unimportant.
A) set by powerful firms.
B) unaffected by actions of individual buyers or sellers.
C) regulated by government interaction.
D) likely to remain unchanged for long periods of time.
E) unimportant.
Unlock Deck
Unlock for access to all 78 flashcards in this deck.
Unlock Deck
k this deck
15
For a market to exist,there must be
A) buyers and sellers.
B) a building such as a retail store.
C) third parties such as brokers and agents.
D) perfect information.
E) government oversight.
A) buyers and sellers.
B) a building such as a retail store.
C) third parties such as brokers and agents.
D) perfect information.
E) government oversight.
Unlock Deck
Unlock for access to all 78 flashcards in this deck.
Unlock Deck
k this deck
16
Individuals who purchase the final goods and services of an economy are called
A) consumers.
B) firms.
C) businesses.
D) markets.
E) entrepreneurs.
A) consumers.
B) firms.
C) businesses.
D) markets.
E) entrepreneurs.
Unlock Deck
Unlock for access to all 78 flashcards in this deck.
Unlock Deck
k this deck
17
In the United States about 90 percent of all goods and services are produced by
A) the government.
B) consumers.
C) unions.
D) firms.
E) nonprofit organizations.
A) the government.
B) consumers.
C) unions.
D) firms.
E) nonprofit organizations.
Unlock Deck
Unlock for access to all 78 flashcards in this deck.
Unlock Deck
k this deck
18
A decrease in demand
A) results from a decrease in supply.
B) means that the demand curve has shifted to the left.
C) increases the quantity sold in the market.
D) reflects an increasing consumer preference for the item.
E) causes the equilibrium price to rise.
A) results from a decrease in supply.
B) means that the demand curve has shifted to the left.
C) increases the quantity sold in the market.
D) reflects an increasing consumer preference for the item.
E) causes the equilibrium price to rise.
Unlock Deck
Unlock for access to all 78 flashcards in this deck.
Unlock Deck
k this deck
19
From the event depicted in the graph,one can conclude that,over the period in question,wheat
A) prices and output fell.
B) prices and output rose.
C) prices and income rose.
D) output and income fell.
E) prices fell and output rose.
A) prices and output fell.
B) prices and output rose.
C) prices and income rose.
D) output and income fell.
E) prices fell and output rose.
Unlock Deck
Unlock for access to all 78 flashcards in this deck.
Unlock Deck
k this deck
20
Under a price system,the four basic tasks are performed by
A) balloting.
B) nonprofit organizations.
C) markets.
D) government decree.
E) the bureaucracy.
A) balloting.
B) nonprofit organizations.
C) markets.
D) government decree.
E) the bureaucracy.
Unlock Deck
Unlock for access to all 78 flashcards in this deck.
Unlock Deck
k this deck
21
The following questions are based on the following graph showing the market for corn:
If farmers currently produce 800 bushels
A) the actual price is $2.
B) the market is in equilibrium.
C) the actual price is below the equilibrium price and will tend to rise.
D) only increases in demand would encourage the supply to rise above 800 units.
E) the market exhibits a surplus.
If farmers currently produce 800 bushels
A) the actual price is $2.
B) the market is in equilibrium.
C) the actual price is below the equilibrium price and will tend to rise.
D) only increases in demand would encourage the supply to rise above 800 units.
E) the market exhibits a surplus.
Unlock Deck
Unlock for access to all 78 flashcards in this deck.
Unlock Deck
k this deck
22
The following questions are based on the following diagram:
If the actual price of sweatshirts is $10 each,the market is not in equilibrium because
A) all consumers willing to pay $10 for a sweatshirt are unable to buy one.
B) there is excess demand.
C) the rate at which sweatshirts are supplied is greater than the rate at which they are demanded.
D) the price at which sweatshirts are demanded is less than the price at which they are supplied.
E) the price is not equal to the quantity.
Unlock Deck
Unlock for access to all 78 flashcards in this deck.
Unlock Deck
k this deck
23
The following questions are based on the following diagram:
In the diagram,movement toward equilibrium would cause the
A) supply curve to shift to the right and the demand curve to shift to the left.
B) actual price to fall below $10 and the quantity supplied and demanded to fall.
C) actual price to remain the same but the supply to drift to the left as producers cut down on production.
D) actual price to rise above $10 and the quantity demanded to fall.
E) actual price to fall below $10, the quantity supplied to fall, and the quantity demanded to rise.
Unlock Deck
Unlock for access to all 78 flashcards in this deck.
Unlock Deck
k this deck
24
A supply curve shifts with changes in
A) technology.
B) income.
C) tastes.
D) the number of buyers.
E) market price.
A) technology.
B) income.
C) tastes.
D) the number of buyers.
E) market price.
Unlock Deck
Unlock for access to all 78 flashcards in this deck.
Unlock Deck
k this deck
25
The following questions are based on the following graph illustrating the market for scallops:
The equilibrium price is ________ per pound.
A) more than $12
B) $12
C) $9
D) $7
E) less than $7
The equilibrium price is ________ per pound.
A) more than $12
B) $12
C) $9
D) $7
E) less than $7
Unlock Deck
Unlock for access to all 78 flashcards in this deck.
Unlock Deck
k this deck
26
Which of the following does not result in a change in demand but leads to a change in the quantity demanded?
A) an increase in population
B) a change in taxes
C) an increase or decrease in the price of a substitute or complement
D) a change in income
E) a shift in the supply curve
A) an increase in population
B) a change in taxes
C) an increase or decrease in the price of a substitute or complement
D) a change in income
E) a shift in the supply curve
Unlock Deck
Unlock for access to all 78 flashcards in this deck.
Unlock Deck
k this deck
27
The following questions are based on the following graph showing the market for corn:
If the quantity supplied were less than the quantity demanded at a particular price,the equilibrium price would be achieved by
A) rationing.
B) a decrease in supply.
C) an increase in the price that increases the quantity supplied and decreases the quantity demanded.
D) the piling up of inventories until firms were forced to lower the price.
E) an increase in demand that would induce firms to step up production.
Unlock Deck
Unlock for access to all 78 flashcards in this deck.
Unlock Deck
k this deck
28
Economic theory states that more of a good is supplied at a higher price than a lower one,yet the sales of digital cameras have increased while their prices have fallen.This statement
A) reflects the fact that economics is not a precise science and its predictions are sometimes incorrect.
B) merely illustrates that the digital camera market may be an exception to the general rule.
C) applies only to the supply side and overlooks the tremendous increase in the demand for digital cameras.
D) confuses changes in the quantity supplied with changes in supply.
E) ignores the fact that the current price may be below the equilibrium level.
Unlock Deck
Unlock for access to all 78 flashcards in this deck.
Unlock Deck
k this deck
29
In the mid-1980s buyers demanded 2.7 million bushels of wheat at $3 per bushel.In the mid-1990s buyers demanded about 2.4 million bushels of wheat at $3 per bushel.From this information it is clear that
A) demand decreased.
B) supply decreased.
C) demand was unchanged; only the quantity demanded fell.
D) the demand curve sloped upward.
E) the number of consumers in the market and their incomes rose.
A) demand decreased.
B) supply decreased.
C) demand was unchanged; only the quantity demanded fell.
D) the demand curve sloped upward.
E) the number of consumers in the market and their incomes rose.
Unlock Deck
Unlock for access to all 78 flashcards in this deck.
Unlock Deck
k this deck
30
In general,supply curves slope upward to the right because
A) increases in the price of a commodity lead to rightward shifts of the supply curve.
B) rising prices motivate producers to offer more units for sale.
C) technology progresses over time, increasing the ability of firms to produce more at existing prices.
D) of increases in input prices as production is increased.
E) empirical studies almost always show that this is the case.
Unlock Deck
Unlock for access to all 78 flashcards in this deck.
Unlock Deck
k this deck
31
A local farmer says that he can sell 50 dozen ears of corn per day at his roadside stand."But if I raise my price," he claims,"the demand falls." The farmer is
A) using the term demand correctly and is right in his conclusion.
B) confusing demand and supply.
C) incorrect because changes in prices affect quantity demanded, not demand.
D) correct only if factors such as the prices of competitive items, the number of buyers, and the tastes of buyers remain constant.
E) incorrect because he does not hold input prices and technology constant in his analysis.
Unlock Deck
Unlock for access to all 78 flashcards in this deck.
Unlock Deck
k this deck
32
The following questions are based on the following diagram:
At the equilibrium price
A) scarcity is eliminated.
B) everyone is content.
C) there is no inflation.
D) price equals quantity.
E) quantity demanded equals quantity supplied.
At the equilibrium price
A) scarcity is eliminated.
B) everyone is content.
C) there is no inflation.
D) price equals quantity.
E) quantity demanded equals quantity supplied.
Unlock Deck
Unlock for access to all 78 flashcards in this deck.
Unlock Deck
k this deck
33
The following questions are based on the following graph showing the market for corn:
At the price of $1 per bushel,there would be an excess ________ million bushels.
A) demand of 200
B) demand of 300
C) demand of 400
D) supply of 200
E) supply of 300
At the price of $1 per bushel,there would be an excess ________ million bushels.
A) demand of 200
B) demand of 300
C) demand of 400
D) supply of 200
E) supply of 300
Unlock Deck
Unlock for access to all 78 flashcards in this deck.
Unlock Deck
k this deck
34
A shift in a commodity's demand curve means that there has been a change in the
A) amount currently available for consumption.
B) number of sellers.
C) costs of production.
D) amount demanded at each price level.
E) techniques of production.
A) amount currently available for consumption.
B) number of sellers.
C) costs of production.
D) amount demanded at each price level.
E) techniques of production.
Unlock Deck
Unlock for access to all 78 flashcards in this deck.
Unlock Deck
k this deck
35
The following questions are based on the following graph illustrating the market for scallops:
If the actual price for scallops is $7 per pound,there would be an excess demand of ________ pounds.
A) zero
B) 250,000
C) 750,000
D) 1,000,000
E) 1,250,000
If the actual price for scallops is $7 per pound,there would be an excess demand of ________ pounds.
A) zero
B) 250,000
C) 750,000
D) 1,000,000
E) 1,250,000
Unlock Deck
Unlock for access to all 78 flashcards in this deck.
Unlock Deck
k this deck
36
The following questions are based on the following diagram:
In the market diagram,excess demand is best represented by triangle
A) ABE.
B) ABD.
C) BCE.
D) AED.
E) CED.
In the market diagram,excess demand is best represented by triangle
A) ABE.
B) ABD.
C) BCE.
D) AED.
E) CED.
Unlock Deck
Unlock for access to all 78 flashcards in this deck.
Unlock Deck
k this deck
37
The following questions are based on the following diagram:
On the basis of the information provided in the diagram,the closed triangle represents
A) excess supply.
B) excess demand.
C) equilibrium prices.
D) actual prices.
E) surplus value.
On the basis of the information provided in the diagram,the closed triangle represents
A) excess supply.
B) excess demand.
C) equilibrium prices.
D) actual prices.
E) surplus value.
Unlock Deck
Unlock for access to all 78 flashcards in this deck.
Unlock Deck
k this deck
38
The following questions are based on the following diagram:
In the market diagram,excess supply is best represented by triangle
A) ABC.
B) CDB.
C) AED.
D) DEC.
E) BEC.
In the market diagram,excess supply is best represented by triangle
A) ABC.
B) CDB.
C) AED.
D) DEC.
E) BEC.
Unlock Deck
Unlock for access to all 78 flashcards in this deck.
Unlock Deck
k this deck
39
A decrease in supply
A) is unrelated to changes in the assumptions that underlie the supply curve.
B) produces a supply curve that slopes downward to the right.
C) is caused by a price change along a supply curve.
D) affects only an agricultural supply curve.
E) is synonymous with a leftward shift of the supply curve.
A) is unrelated to changes in the assumptions that underlie the supply curve.
B) produces a supply curve that slopes downward to the right.
C) is caused by a price change along a supply curve.
D) affects only an agricultural supply curve.
E) is synonymous with a leftward shift of the supply curve.
Unlock Deck
Unlock for access to all 78 flashcards in this deck.
Unlock Deck
k this deck
40
There is neither excess supply nor excess demand when
A) actual price equals equilibrium price.
B) the quantity supplied plus the quantity demanded equals total output.
C) price equals quantity.
D) surpluses equal shortages.
E) the number of buyers equals the number of sellers.
A) actual price equals equilibrium price.
B) the quantity supplied plus the quantity demanded equals total output.
C) price equals quantity.
D) surpluses equal shortages.
E) the number of buyers equals the number of sellers.
Unlock Deck
Unlock for access to all 78 flashcards in this deck.
Unlock Deck
k this deck
41
In a free market,producers' desires to maximize profit
A) inevitably lead to rising market prices.
B) are inconsistent with incentives to introduce new technology.
C) guarantee that firms never take losses.
D) cause firms to use the most efficient techniques.
E) mean that government must control prices to prevent producers from overcharging consumers.
A) inevitably lead to rising market prices.
B) are inconsistent with incentives to introduce new technology.
C) guarantee that firms never take losses.
D) cause firms to use the most efficient techniques.
E) mean that government must control prices to prevent producers from overcharging consumers.
Unlock Deck
Unlock for access to all 78 flashcards in this deck.
Unlock Deck
k this deck
42
The following questions are based on the following circular flow diagram:
In a free market,the price system provides for an adequate rate of growth by
A) making the augmentation of a society's resources unprofitable.
B) ensuring an upward-sloping supply curve.
C) meeting each consumer's demand.
D) providing strong incentives for firms to introduce new technology.
E) ensuring that each good is produced in the proper amount.
Unlock Deck
Unlock for access to all 78 flashcards in this deck.
Unlock Deck
k this deck
43
If actual price is above equilibrium price
A) demand falls.
B) supply rises.
C) shortages will emerge.
D) the quantity supplied exceeds the quantity demanded.
E) the equilibrium price rises.
A) demand falls.
B) supply rises.
C) shortages will emerge.
D) the quantity supplied exceeds the quantity demanded.
E) the equilibrium price rises.
Unlock Deck
Unlock for access to all 78 flashcards in this deck.
Unlock Deck
k this deck
44
The following questions are based on the following diagram:
For a market to exhibit excess supply
A) demand must exceed supply.
B) the market must be growing.
C) demand must increase.
D) the equilibrium price must be too high to clear the market.
E) the actual price must be above the equilibrium price.
For a market to exhibit excess supply
A) demand must exceed supply.
B) the market must be growing.
C) demand must increase.
D) the equilibrium price must be too high to clear the market.
E) the actual price must be above the equilibrium price.
Unlock Deck
Unlock for access to all 78 flashcards in this deck.
Unlock Deck
k this deck
45
In a free market,the price system determines how society's output is distributed by
A) ensuring that low income people can buy all the necessities for living.
B) providing goods for those willing and able to pay at least the equilibrium price.
C) determining each person's income in the labor market according to the tax rate imposed by the state.
D) allowing all those who desire a commodity to buy it.
E) ensuring that each commodity is produced by the most efficient technique.
Unlock Deck
Unlock for access to all 78 flashcards in this deck.
Unlock Deck
k this deck
46
In a market economy,who gets what
A) depends on the amount and kinds of resources individuals own.
B) cannot be resolved without government intervention.
C) is unrelated to the questions of what goods are produced and how.
D) is determined by the production possibilities curve.
E) is an irrelevant and unnecessary concern.
A) depends on the amount and kinds of resources individuals own.
B) cannot be resolved without government intervention.
C) is unrelated to the questions of what goods are produced and how.
D) is determined by the production possibilities curve.
E) is an irrelevant and unnecessary concern.
Unlock Deck
Unlock for access to all 78 flashcards in this deck.
Unlock Deck
k this deck
47
In a free market,actual price will
A) remain unchanged as equilibrium price changes.
B) move toward equilibrium price.
C) cause the demand and supply curves to shift directions.
D) always exceed equilibrium price.
E) be very difficult to calculate.
A) remain unchanged as equilibrium price changes.
B) move toward equilibrium price.
C) cause the demand and supply curves to shift directions.
D) always exceed equilibrium price.
E) be very difficult to calculate.
Unlock Deck
Unlock for access to all 78 flashcards in this deck.
Unlock Deck
k this deck
48
The following questions are based on the following circular flow diagram:
In the model of the circular flow
A) the dollar flows on the left side represent expenditures for final goods and services.
B) the dollar flows on the right side represent incomes being paid by businesses to consumers.
C) resources flow to businesses on the left side, and final goods and services flow to households on the right side.
D) households are buyers of factors of production on the left side and sellers of goods and services on the right side.
E) the dollar value on the left side is unrelated to the dollar value on the right side.
Unlock Deck
Unlock for access to all 78 flashcards in this deck.
Unlock Deck
k this deck
49
According to economic analysis,shortages of a good mean
A) supply is too low.
B) demand is too high.
C) the actual price is too low.
D) production is too low.
E) the equilibrium price is too low.
A) supply is too low.
B) demand is too high.
C) the actual price is too low.
D) production is too low.
E) the equilibrium price is too low.
Unlock Deck
Unlock for access to all 78 flashcards in this deck.
Unlock Deck
k this deck
50
In free markets,the price system encourages producers to meet consumers' wants because
A) it signals to producers which goods are profitable.
B) producers have the public interest in mind.
C) it allows the government to direct firms to the best production technique.
D) it rewards consumers for the resources they bring to the marketplace.
E) consumers are generally willing to pay more than the actual price.
Unlock Deck
Unlock for access to all 78 flashcards in this deck.
Unlock Deck
k this deck
51
The following questions are based on the following circular flow diagram:
In this model of the circular flow,the dollar flows
A) are clockwise.
B) are counterclockwise.
C) on the right side are clockwise and those on the left side are counterclockwise.
D) on the right side are counterclockwise and those on the left side are clockwise.
E) on the right side are greater than those on the left side.
Unlock Deck
Unlock for access to all 78 flashcards in this deck.
Unlock Deck
k this deck
52
Werner H.,an engineer very experienced in bridge design,is looking for a position with a firm that specializes in bridge building.In presenting his qualifications,he takes care to point out his experience in handling difficult terrain.Werner is currently doing business in a ________ market.
A) consumers'
B) business
C) product
D) resource
E) closed
A) consumers'
B) business
C) product
D) resource
E) closed
Unlock Deck
Unlock for access to all 78 flashcards in this deck.
Unlock Deck
k this deck
53
The following questions are based on the following diagram:
For a market to exhibit excess demand
A) supply must exceed demand.
B) the equilibrium price must be too high to clear the market.
C) the actual price must be below the equilibrium price.
D) the demand curve must slope upward.
E) the market must be growing.
For a market to exhibit excess demand
A) supply must exceed demand.
B) the equilibrium price must be too high to clear the market.
C) the actual price must be below the equilibrium price.
D) the demand curve must slope upward.
E) the market must be growing.
Unlock Deck
Unlock for access to all 78 flashcards in this deck.
Unlock Deck
k this deck
54
The following questions are based on the following circular flow diagram:
In a simple circular flow model of an economy
A) households buy factors of production from businesses.
B) the flow of income to households from businesses is greater than the flow of expenditures by households for goods produced by businesses.
C) businesses buy final goods and services produced by households.
D) the total amount of labor hours worked equals the total number of goods produced.
E) households are owners of resources and purchasers of final goods and services.
Unlock Deck
Unlock for access to all 78 flashcards in this deck.
Unlock Deck
k this deck
55
Which of the conditions listed best summarizes the following market data?
A) market equilibrium
B) actual price below equilibrium price
C) excess supply
D) shortage
E) demand exceeds supply
A) market equilibrium
B) actual price below equilibrium price
C) excess supply
D) shortage
E) demand exceeds supply
Unlock Deck
Unlock for access to all 78 flashcards in this deck.
Unlock Deck
k this deck
56
The price system determines the level and composition of output because it relies on firms' acting in accord with
A) altruistic concerns.
B) government mandates.
C) the profit motive.
D) the market supply curve.
E) the predictions of economists.
A) altruistic concerns.
B) government mandates.
C) the profit motive.
D) the market supply curve.
E) the predictions of economists.
Unlock Deck
Unlock for access to all 78 flashcards in this deck.
Unlock Deck
k this deck
57
The following questions are based on the following circular flow diagram:
In the circular flow model,income to the household is,from the point of view of the firm that pays this income,the same things as
A) investment.
B) savings.
C) revenue.
D) production costs.
E) working capital.
In the circular flow model,income to the household is,from the point of view of the firm that pays this income,the same things as
A) investment.
B) savings.
C) revenue.
D) production costs.
E) working capital.
Unlock Deck
Unlock for access to all 78 flashcards in this deck.
Unlock Deck
k this deck
58
The following questions are based on the following table:
The profit the producer makes using this minimum cost technique is
A) $4.
B) $9.
C) $10.
D) $12.
E) $14.
The profit the producer makes using this minimum cost technique is
A) $4.
B) $9.
C) $10.
D) $12.
E) $14.
Unlock Deck
Unlock for access to all 78 flashcards in this deck.
Unlock Deck
k this deck
59
The following questions are based on the following table:
A firm is able to purchase 1 unit of raw material for $2 and convert that unit into a finished product that sells for $25.Four production techniques are available,as shown in the table.If labor costs $1 per hour and machine time costs $3 per hour,the firm should
A) use technique A.
B) use technique B.
C) use technique C.
D) use technique D.
E) not produce at all.
Unlock Deck
Unlock for access to all 78 flashcards in this deck.
Unlock Deck
k this deck
60
Economists generally assume that the actual market price of an item approximates the equilibrium price.They make this assumption because
A) their information is too limited to permit a more accurate guess.
B) as soon as the actual price shifts, the equilibrium price shifts.
C) forces in the market tend to push actual price toward equilibrium.
D) very few products ever vary in price from the equilibrium.
E) actual prices are set by the government.
Unlock Deck
Unlock for access to all 78 flashcards in this deck.
Unlock Deck
k this deck
61
A firm dumping pollutants into a stream,rendering the water unfit for use by those downstream,is an example of a(n)
A) unfair distribution of income.
B) external economy.
C) external diseconomy.
D) public good.
E) transfer payment.
A) unfair distribution of income.
B) external economy.
C) external diseconomy.
D) public good.
E) transfer payment.
Unlock Deck
Unlock for access to all 78 flashcards in this deck.
Unlock Deck
k this deck
62
Which of the following supply conditions leads to an increase in the equilibrium price?
A) excess supply
B) a decrease in supply
C) the law of supply
D) an upward-sloping supply
E) an elastic supply
A) excess supply
B) a decrease in supply
C) the law of supply
D) an upward-sloping supply
E) an elastic supply
Unlock Deck
Unlock for access to all 78 flashcards in this deck.
Unlock Deck
k this deck
63
According to the Markets and Prices video,the 1960s and 1970s development that enabled the U.S.steel industry to match the price of foreign steel producers for certain products was the
A) mini-mill.
B) integrated steel mill.
C) blast furnace.
D) use of ingot technology.
E) discovery of new, high-grade ore deposits in the upper Midwest.
A) mini-mill.
B) integrated steel mill.
C) blast furnace.
D) use of ingot technology.
E) discovery of new, high-grade ore deposits in the upper Midwest.
Unlock Deck
Unlock for access to all 78 flashcards in this deck.
Unlock Deck
k this deck
64
The Industrial Revolution was characterized by
A) significant declines in society's saving rates.
B) rapid increases in the growth rate of population relative to output.
C) falling standards of living for the majority of society.
D) considerable increases in capital.
E) a decline in technology.
A) significant declines in society's saving rates.
B) rapid increases in the growth rate of population relative to output.
C) falling standards of living for the majority of society.
D) considerable increases in capital.
E) a decline in technology.
Unlock Deck
Unlock for access to all 78 flashcards in this deck.
Unlock Deck
k this deck
65
According to the Markets and Prices video,insufficient housing was a problem after World War II because the
A) United States experienced excessive numbers of people immigrating from Europe and Japan whose housing had been destroyed by the war.
B) depression and mobilization of resources to fight World War II resulted in little housing construction for over 15 years.
C) supply of housing exceeded the demand for housing, pushing prices up.
D) unionization of construction workers shifted the supply curve of housing to the left, resulting in higher prices.
E) availability of land in and around major U.S. cities was severely limited because of past development.
Unlock Deck
Unlock for access to all 78 flashcards in this deck.
Unlock Deck
k this deck
66
If both the supply and demand for a good decrease,we can predict with certainty that
A) the quantity sold will fall.
B) the price will fall.
C) the price will rise.
D) the quantity sold will rise.
E) neither the price nor the quantity sold will be affected.
A) the quantity sold will fall.
B) the price will fall.
C) the price will rise.
D) the quantity sold will rise.
E) neither the price nor the quantity sold will be affected.
Unlock Deck
Unlock for access to all 78 flashcards in this deck.
Unlock Deck
k this deck
67
When supply increases in a competitive market
A) equilibrium price falls.
B) demand falls.
C) shortages emerge.
D) actual price rises.
E) quantities sold decrease.
A) equilibrium price falls.
B) demand falls.
C) shortages emerge.
D) actual price rises.
E) quantities sold decrease.
Unlock Deck
Unlock for access to all 78 flashcards in this deck.
Unlock Deck
k this deck
68
If the supply curve for peaches slopes upward,a decrease in the demand for peaches causes the equilibrium price
A) to rise and quantity to fall.
B) to fall and quantity to rise.
C) and quantity both to fall.
D) and quantity both to rise.
E) and quantity both to remain unchanged.
A) to rise and quantity to fall.
B) to fall and quantity to rise.
C) and quantity both to fall.
D) and quantity both to rise.
E) and quantity both to remain unchanged.
Unlock Deck
Unlock for access to all 78 flashcards in this deck.
Unlock Deck
k this deck
69
During the summer months,it is not unusual for both the price and the quantity consumed of gasoline to rise.These conditions reflect a(n)
A) violation of the law of demand.
B) shift to the left of the supply curve.
C) increase in demand.
D) condition of deficient demand.
E) surplus.
A) violation of the law of demand.
B) shift to the left of the supply curve.
C) increase in demand.
D) condition of deficient demand.
E) surplus.
Unlock Deck
Unlock for access to all 78 flashcards in this deck.
Unlock Deck
k this deck
70
When demand decreases in a competitive market
A) equilibrium price falls.
B) supply rises.
C) shortages emerge.
D) actual price rises.
E) quantities sold increase.
A) equilibrium price falls.
B) supply rises.
C) shortages emerge.
D) actual price rises.
E) quantities sold increase.
Unlock Deck
Unlock for access to all 78 flashcards in this deck.
Unlock Deck
k this deck
71
Which of the following activities is most likely to generate an external economy?
A) playing a stereo full blast in a dorm room during reading days
B) eating a pizza in a restaurant
C) driving while intoxicated
D) keeping a neatly mown, weedless lawn in a suburban neighborhood
E) quietly napping during an Economics class
A) playing a stereo full blast in a dorm room during reading days
B) eating a pizza in a restaurant
C) driving while intoxicated
D) keeping a neatly mown, weedless lawn in a suburban neighborhood
E) quietly napping during an Economics class
Unlock Deck
Unlock for access to all 78 flashcards in this deck.
Unlock Deck
k this deck
72
According to economist Richard Gill,certain individuals such as rock stars and talented athletes earn high incomes because
A) of a failure of the laws of supply and demand.
B) supply exceeds demand for these types of jobs.
C) there are few such individuals relative to the demand for their services.
D) they are less productive than average workers.
E) they are more visible to consumers than the people who work in manufacturing, agriculture, and service industries.
Unlock Deck
Unlock for access to all 78 flashcards in this deck.
Unlock Deck
k this deck
73
Which of the following most likely leads to an increase in the quantity demanded?
A) an increase in price
B) a decrease in the price of a substitute good
C) a decrease in income
D) an increase in supply
E) an increase in the cost of production
A) an increase in price
B) a decrease in the price of a substitute good
C) a decrease in income
D) an increase in supply
E) an increase in the cost of production
Unlock Deck
Unlock for access to all 78 flashcards in this deck.
Unlock Deck
k this deck
74
If the demand curve slopes downward and the supply curve slopes upward,which of the following events leads to an increase in both the equilibrium price and quantity?
A) a rightward shift in supply with demand unchanged
B) a leftward shift in both demand and supply
C) a leftward shift in supply with demand unchanged
D) a leftward shift in demand with supply unchanged
E) a rightward shift in demand with supply unchanged
A) a rightward shift in supply with demand unchanged
B) a leftward shift in both demand and supply
C) a leftward shift in supply with demand unchanged
D) a leftward shift in demand with supply unchanged
E) a rightward shift in demand with supply unchanged
Unlock Deck
Unlock for access to all 78 flashcards in this deck.
Unlock Deck
k this deck
75
The fact that there is no way to prevent citizens from benefiting from expenditures on national defense,whether they pay taxes or not,is an example of a(n)
A) unfair distribution of income.
B) external economy.
C) external diseconomy.
D) public good.
E) transfer payment.
A) unfair distribution of income.
B) external economy.
C) external diseconomy.
D) public good.
E) transfer payment.
Unlock Deck
Unlock for access to all 78 flashcards in this deck.
Unlock Deck
k this deck
76
A major social and economic institution that came out of the Industrial Revolution was
A) the church.
B) universities.
C) serfdom.
D) the military.
E) the factory.
A) the church.
B) universities.
C) serfdom.
D) the military.
E) the factory.
Unlock Deck
Unlock for access to all 78 flashcards in this deck.
Unlock Deck
k this deck
77
The distribution of income generated by the price system
A) inevitably becomes egalitarian.
B) may not create sufficient spending power to provide for the needs of the poor.
C) is an example of an external diseconomy.
D) is considered by most people to be fair and therefore in no need of alteration to suit humanitarian concerns.
E) enables firms to satisfy all consumer desires.
Unlock Deck
Unlock for access to all 78 flashcards in this deck.
Unlock Deck
k this deck
78
One notable characteristic of a public good is that
A) its production incurs no economic costs.
B) consumers can easily be denied its benefits.
C) it is automatically produced by the free market price system.
D) it can be consumed collectively.
E) consumers may readily divide it into individual pieces and distribute it among themselves.
A) its production incurs no economic costs.
B) consumers can easily be denied its benefits.
C) it is automatically produced by the free market price system.
D) it can be consumed collectively.
E) consumers may readily divide it into individual pieces and distribute it among themselves.
Unlock Deck
Unlock for access to all 78 flashcards in this deck.
Unlock Deck
k this deck
Unlock Deck
Unlock for access to all 78 flashcards in this deck.


