Deck 10: Statistics
Full screen (f)
Question
Question
Question
Question
Question
Question
Question
Question
Question
Question
Question
Question
Review the graph. What is the lowest cancer prevalence rate in the United States for 2008? 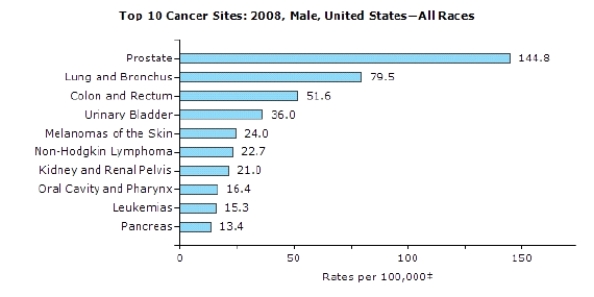
Source: U.S. Cancer Statistics Working Group. United States Cancer Statistics: 1999-2008 Incidence and Mortality Web-based Report. Atlanta: U.S. Department of Health and Human Services, Centers for Disease Control and Prevention and National Cancer Institute, 2012.
A) Leukemias
B) Urinary bladder
C) Colon and rectum
D) Pancreas
Question
The following patients were discharged from pediatrics for the week 7/16/05-7/22/05: 
The average length of stay of these patients is:
A) 6.5 days
B) 7 days
C) 7.2 days
D) 8 days
The average length of stay of these patients is:
A) 6.5 days
B) 7 days
C) 7.2 days
D) 8 days
Question
Question
Review the following graph. Which race/ethnicity has the highest prevalence rate in the United States? 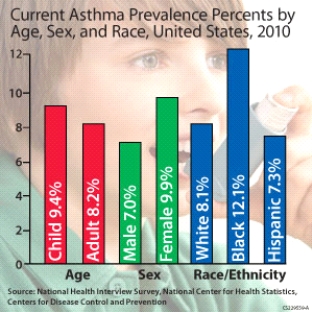
A) Male
B) Child
C) Hispanic
D) Black
A) Male
B) Child
C) Hispanic
D) Black
Question
Question
Question
Question
Review the following graph. What is the incidence of acute hepatitis A rate trend from 2000 to 2010 among all age groups? 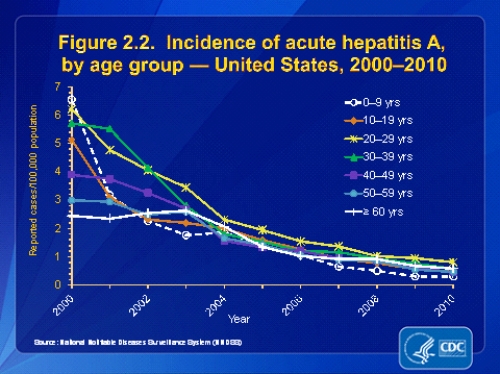
A) Downward
B) Upward
C) Horizontal
D) Vertical
A) Downward
B) Upward
C) Horizontal
D) Vertical
Question
Question
Question
Question
Question
Question
Question
Question
Question
Question
Question
Question
Question
Question
Question
Question
Question
Question
Question
Question
Question
Question
Use the data below to calculate the length of stay for each patient. Assume that the dates are in the same year and that it is not a leap year.

The length of stay for Patient C is _______________.
The length of stay for Patient C is _______________.
Question
Question
Question
Question
Use the data below to calculate the length of stay for each patient. Assume that the dates are in the same year and that it is not a leap year.
The length of stay for Patient E is _______________.
The length of stay for Patient E is _______________.
Question
Question
Question
Use the data below to calculate the length of stay for each patient. Assume that the dates are in the same year and that it is not a leap year.
The length of stay for Patient A is _______________.
The length of stay for Patient A is _______________.
Question
Use the data below to calculate the length of stay for each patient. Assume that the dates are in the same year and that it is not a leap year.
The length of stay for Patient G is _______________.
The length of stay for Patient G is _______________.
Question
Question
Question
Use the data below to calculate the length of stay for each patient. Assume that the dates are in the same year and that it is not a leap year.
The length of stay for Patient F is _______________.
The length of stay for Patient F is _______________.
Question
Question
Use the data below to calculate the length of stay for each patient. Assume that the dates are in the same year and that it is not a leap year.
The length of stay for Patient D is _______________.
The length of stay for Patient D is _______________.
Question
Use the data below to calculate the length of stay for each patient. Assume that the dates are in the same year and that it is not a leap year.
The length of stay for Patient H is _______________.
The length of stay for Patient H is _______________.
Question
Calculate the average length of stay for the following patients who were discharged on July 14.

Question
Below are the lengths of stay for the following patients who were discharged on July 14. This is an acute care facility. Does the ALOS reflect an acute care facility's typical patient length of stay? Why or why not?

Question
Question
Question
Use the data below to calculate the length of stay for each patient. Assume that the dates are in the same year and that it is not a leap year.
The length of stay for Patient B is _______________.
The length of stay for Patient B is _______________.
Question
Question
Use the table below to compute the answers for the following questions.

Compute the average length of stay (ALOS) (A&C).
Compute the average length of stay (ALOS) (A&C).
Question
Use the table below to compute the answers for the following questions.
Compute the bed occupancy rate (A&C).
Compute the bed occupancy rate (A&C).
Question
Question
Question
Use the table below to compute the answers for the following questions.
Compute the nosocomial infection rate (A&C).
Compute the nosocomial infection rate (A&C).
Question
Question
Question
Question
Question
Question

Unlock Deck
Sign up to unlock the cards in this deck!
Unlock Deck
Unlock Deck
1/72
Play
Full screen (f)
Deck 10: Statistics
1
What is the mean for the following frequency distribution: 10, 15, 20, 25, 25?
A) 25
B) 10
C) 20
D) 19
A) 25
B) 10
C) 20
D) 19
19
2
Primary data is originally reported or recorded by:
A) the Centers for Disease Control and Prevention
B) researchers at teaching hospitals
C) HIM employees reviewing the record
D) clinicians treating the patient
A) the Centers for Disease Control and Prevention
B) researchers at teaching hospitals
C) HIM employees reviewing the record
D) clinicians treating the patient
clinicians treating the patient
3
Of 15000 discharges last year, Medicare was the primary payer for 6000 patients. Medicare made up what percentage of this hospital's payer mix?
A) 4%
B) 55%
C) 60%
D) 40%
A) 4%
B) 55%
C) 60%
D) 40%
40%
4
Suppose there are six males in a class of 20 students. What term could be used to describe the comparison?
A) Ratio
B) Proportion
C) Percentage
D) Rate
A) Ratio
B) Proportion
C) Percentage
D) Rate
Unlock Deck
Unlock for access to all 72 flashcards in this deck.
Unlock Deck
k this deck
5
A federally mandated database collected on all inpatients discharged from a hospital is the:
A) MPI
B) UHDCS
C) UHDDS
D) UACDS
A) MPI
B) UHDCS
C) UHDDS
D) UACDS
Unlock Deck
Unlock for access to all 72 flashcards in this deck.
Unlock Deck
k this deck
6
Which statement below requests aggregate health information?
A) Request for report on all DRG 127 for the month of June
B) Request for patient information, MR# 02-34-65, DRG 127
C) Request for first case of CHF for the third quarter
D) Request for record of patient #197808, under the care of Dr. S. S. Schoner
A) Request for report on all DRG 127 for the month of June
B) Request for patient information, MR# 02-34-65, DRG 127
C) Request for first case of CHF for the third quarter
D) Request for record of patient #197808, under the care of Dr. S. S. Schoner
Unlock Deck
Unlock for access to all 72 flashcards in this deck.
Unlock Deck
k this deck
7
Given a request for the number of Medicare CHF cases for the month of April, how would you query the database to sort the report?
A) Patient gender
B) Patient age
C) Financial class
D) Diagnosis
A) Patient gender
B) Patient age
C) Financial class
D) Diagnosis
Unlock Deck
Unlock for access to all 72 flashcards in this deck.
Unlock Deck
k this deck
8
The patient abstract is an example of _______ data.
A) Demographic
B) Primary
C) Secondary
D) Tertiary
A) Demographic
B) Primary
C) Secondary
D) Tertiary
Unlock Deck
Unlock for access to all 72 flashcards in this deck.
Unlock Deck
k this deck
9
Zak was admitted to the hospital on August 20 and discharged on October 6. The length of stay is _______ days.
A) 47
B) 48
C) 66
D) 67
A) 47
B) 48
C) 66
D) 67
Unlock Deck
Unlock for access to all 72 flashcards in this deck.
Unlock Deck
k this deck
10
A sample is a small group within a:
A) Data set
B) Database
C) Aggregate group
D) Population
A) Data set
B) Database
C) Aggregate group
D) Population
Unlock Deck
Unlock for access to all 72 flashcards in this deck.
Unlock Deck
k this deck
11
Birth certificates, completed by the health care facility, are registered with the Department of:
A) Motor Vehicles
B) Live Births
C) Complete Statistics
D) Vital Records
A) Motor Vehicles
B) Live Births
C) Complete Statistics
D) Vital Records
Unlock Deck
Unlock for access to all 72 flashcards in this deck.
Unlock Deck
k this deck
12
Review the graph. What is the lowest cancer prevalence rate in the United States for 2008?
Source: U.S. Cancer Statistics Working Group. United States Cancer Statistics: 1999-2008 Incidence and Mortality Web-based Report. Atlanta: U.S. Department of Health and Human Services, Centers for Disease Control and Prevention and National Cancer Institute, 2012.
A) Leukemias
B) Urinary bladder
C) Colon and rectum
D) Pancreas
Unlock Deck
Unlock for access to all 72 flashcards in this deck.
Unlock Deck
k this deck
13
The following patients were discharged from pediatrics for the week 7/16/05-7/22/05:
The average length of stay of these patients is:
A) 6.5 days
B) 7 days
C) 7.2 days
D) 8 days
The average length of stay of these patients is:
A) 6.5 days
B) 7 days
C) 7.2 days
D) 8 days
Unlock Deck
Unlock for access to all 72 flashcards in this deck.
Unlock Deck
k this deck
14
Which statement best describes the patient abstract?
A) Patient database
B) Summary of the patient's stay
C) Summary of the patient's medical history
D) Patient demographics
A) Patient database
B) Summary of the patient's stay
C) Summary of the patient's medical history
D) Patient demographics
Unlock Deck
Unlock for access to all 72 flashcards in this deck.
Unlock Deck
k this deck
15
Review the following graph. Which race/ethnicity has the highest prevalence rate in the United States?
A) Male
B) Child
C) Hispanic
D) Black
A) Male
B) Child
C) Hispanic
D) Black
Unlock Deck
Unlock for access to all 72 flashcards in this deck.
Unlock Deck
k this deck
16
Richard S. was admitted to the hospital on September 13 and discharged on September 30. The length of stay is ______ days.
A) 13
B) 17
C) 18
D) 30
A) 13
B) 17
C) 18
D) 30
Unlock Deck
Unlock for access to all 72 flashcards in this deck.
Unlock Deck
k this deck
17
Which of the following graphs would best illustrate the following information: of the 440 discharges for the month of June, 340 were Medicare, 60 were Medicaid, 20 were insurance, and 20 were self pay?
A) Pie chart
B) Line chart
C) Brainstorming
D) Decision matrix
A) Pie chart
B) Line chart
C) Brainstorming
D) Decision matrix
Unlock Deck
Unlock for access to all 72 flashcards in this deck.
Unlock Deck
k this deck
18
Suppose that you want to display the number of deaths due to prostate cancer for the years 2000 through 2009. What graphic technique would you choose?
A) Line graph
B) Histogram
C) Pie chart
D) Bar chart
A) Line graph
B) Histogram
C) Pie chart
D) Bar chart
Unlock Deck
Unlock for access to all 72 flashcards in this deck.
Unlock Deck
k this deck
19
Review the following graph. What is the incidence of acute hepatitis A rate trend from 2000 to 2010 among all age groups?
A) Downward
B) Upward
C) Horizontal
D) Vertical
A) Downward
B) Upward
C) Horizontal
D) Vertical
Unlock Deck
Unlock for access to all 72 flashcards in this deck.
Unlock Deck
k this deck
20
The CEO requests information on the number of arthroscopies performed annually. What information should be requested from the database to be included on the report so that individual cases can be reviewed, if necessary?
A) Patient name only
B) Patient name, MR#, ICD-10-CM procedure code, discharge date, surgeon
C) Patient name, procedure description, surgery date
D) Surgeon
A) Patient name only
B) Patient name, MR#, ICD-10-CM procedure code, discharge date, surgeon
C) Patient name, procedure description, surgery date
D) Surgeon
Unlock Deck
Unlock for access to all 72 flashcards in this deck.
Unlock Deck
k this deck
21
The blood pressure of patients discharged in June 2011 with a diagnosis of hypertension was reviewed. The 36 samples are below. The diastolic pressures (in mm Hg) were as follows:
88 98 78 84 77 81 90 82 75 72 100 92
85 92 77 84 77 82 92 87 74 80 95 90
87 80 83 77 86 80 88 90 79 82 93 88
What is the mode?
A) 77
B) 85
C) 28
D) 100
88 98 78 84 77 81 90 82 75 72 100 92
85 92 77 84 77 82 92 87 74 80 95 90
87 80 83 77 86 80 88 90 79 82 93 88
What is the mode?
A) 77
B) 85
C) 28
D) 100
Unlock Deck
Unlock for access to all 72 flashcards in this deck.
Unlock Deck
k this deck
22
Compute the length of stay for the following patient: Admitted 5/25/2012
Discharged 5/25/2012
A) 0 days
B) 1 day
C) Cannot be determined
D) None of the above
Discharged 5/25/2012
A) 0 days
B) 1 day
C) Cannot be determined
D) None of the above
Unlock Deck
Unlock for access to all 72 flashcards in this deck.
Unlock Deck
k this deck
23
Data for June 2011: Bed count 50
Admissions 140
Discharges 143
IP service days 1203
Discharge days 1001
Calculate the average length of stay for June 2011.
A) 1.5 days
B) 2.3 days
C) 8.2 days
D) 0.67 days
Admissions 140
Discharges 143
IP service days 1203
Discharge days 1001
Calculate the average length of stay for June 2011.
A) 1.5 days
B) 2.3 days
C) 8.2 days
D) 0.67 days
Unlock Deck
Unlock for access to all 72 flashcards in this deck.
Unlock Deck
k this deck
24
The subjective portion of SOAP progress notes is ________________ data. It is also information obtained by a caregiver after observation of the patient.
Unlock Deck
Unlock for access to all 72 flashcards in this deck.
Unlock Deck
k this deck
25
On May 12, the midnight census is 80. However, four patients were admitted and discharged that same day. The hospital has a 92 bed count. Calculate the bed occupancy rate.
A) 15%
B) 13%
C) 87%
D) 1.15%
A) 15%
B) 13%
C) 87%
D) 1.15%
Unlock Deck
Unlock for access to all 72 flashcards in this deck.
Unlock Deck
k this deck
26
Another name for a data illustration is a ________________.
Unlock Deck
Unlock for access to all 72 flashcards in this deck.
Unlock Deck
k this deck
27
A frequency distribution organizes data into groups called ________________.
Unlock Deck
Unlock for access to all 72 flashcards in this deck.
Unlock Deck
k this deck
28
Diagnosis, physician, or procedure ________________ are used to organize and retrieve specific data from the HIM database.
Unlock Deck
Unlock for access to all 72 flashcards in this deck.
Unlock Deck
k this deck
29
Named and identifiable pieces of data that can be queried and reported in a meaningful way are called ________________.
Unlock Deck
Unlock for access to all 72 flashcards in this deck.
Unlock Deck
k this deck
30
as the way in which a variance of values behaves over time is called a _________________.
Unlock Deck
Unlock for access to all 72 flashcards in this deck.
Unlock Deck
k this deck
31
A report of a group of patients including their age is an example of ____________ data.
Unlock Deck
Unlock for access to all 72 flashcards in this deck.
Unlock Deck
k this deck
32
Which unit of measure is used to indicate the services received by one inpatient in a 24-hour period?
A) Inpatient service day
B) Volume of services
C) Bed count
D) Length of stay
A) Inpatient service day
B) Volume of services
C) Bed count
D) Length of stay
Unlock Deck
Unlock for access to all 72 flashcards in this deck.
Unlock Deck
k this deck
33
In May, 280 women were admitted to the Obstetrics service. Of these, 262 women delivered vaginally; 18 deliveries were by C-section. What is the denominator for calculating the C-section rate?
A) 280
B) 18
C) 262 + 18
D) 262
A) 280
B) 18
C) 262 + 18
D) 262
Unlock Deck
Unlock for access to all 72 flashcards in this deck.
Unlock Deck
k this deck
34
Suppose that three patients stayed in the hospital for a total of 18 days. Which term would be used to describe the result of the calculation 18 ÷ 3?
A) Total length of stay
B) Average patient census
C) Average bed count
D) Average length of stay
A) Total length of stay
B) Average patient census
C) Average bed count
D) Average length of stay
Unlock Deck
Unlock for access to all 72 flashcards in this deck.
Unlock Deck
k this deck
35
What rate is used to indicate the percentage of the hospital's beds occupied by inpatients for a given time period?
A) Percent occupancy
B) Total length of stay
C) Inpatient bed occupancy rate
D) Both a and c
A) Percent occupancy
B) Total length of stay
C) Inpatient bed occupancy rate
D) Both a and c
Unlock Deck
Unlock for access to all 72 flashcards in this deck.
Unlock Deck
k this deck
36
The blood pressure of patients discharged in June 2011 with a diagnosis of hypertension was reviewed. The 36 samples are below. The diastolic pressures (in mm Hg) were as follows:
88 98 78 84 77 81 90 82 75 72 100 92
85 92 77 84 77 82 92 88 74 80 95 90
87 80 83 77 86 80 88 90 79 82 93 88
What is the mean?
A) 84.7
B) 87.9
C) 86.2
D) 82.1
88 98 78 84 77 81 90 82 75 72 100 92
85 92 77 84 77 82 92 88 74 80 95 90
87 80 83 77 86 80 88 90 79 82 93 88
What is the mean?
A) 84.7
B) 87.9
C) 86.2
D) 82.1
Unlock Deck
Unlock for access to all 72 flashcards in this deck.
Unlock Deck
k this deck
37
The number of patients present in the health care facility, counted at the same time each day, is called the ______________.
Unlock Deck
Unlock for access to all 72 flashcards in this deck.
Unlock Deck
k this deck
38
An ___________ is a summary of the patient record.
Unlock Deck
Unlock for access to all 72 flashcards in this deck.
Unlock Deck
k this deck
39
The inpatient census at 12:01 AM is 62. Two patients were admitted at 8 AM; one died at 7:30 PM and the other was discharged at 8:15 PM. Calculate the inpatient service day.
A) 62
B) 64
C) 63
D) 65
A) 62
B) 64
C) 63
D) 65
Unlock Deck
Unlock for access to all 72 flashcards in this deck.
Unlock Deck
k this deck
40
_______________ is a method of sampling a population so that all cases have an equal chance of being selected.
Unlock Deck
Unlock for access to all 72 flashcards in this deck.
Unlock Deck
k this deck
41
Use the data below to calculate the length of stay for each patient. Assume that the dates are in the same year and that it is not a leap year.
The length of stay for Patient C is _______________.
The length of stay for Patient C is _______________.
Unlock Deck
Unlock for access to all 72 flashcards in this deck.
Unlock Deck
k this deck
42
An organization of data elements in rows and columns is called a _______________.
Unlock Deck
Unlock for access to all 72 flashcards in this deck.
Unlock Deck
k this deck
43
The inpatient census at 11:59 PM, May 20, was 95. One patient was admitted May 21 around 6:00 AM and discharged around 7:00 PM on the same day. Two patients were admitted at noon that day; one died at 5:00 PM that same afternoon while the other patient was transferred to a nursing home around 2:30 PM. What is the daily inpatient census for May 21?
Unlock Deck
Unlock for access to all 72 flashcards in this deck.
Unlock Deck
k this deck
44
A database of specific cancer or trauma information is an example of a ____________.
Unlock Deck
Unlock for access to all 72 flashcards in this deck.
Unlock Deck
k this deck
45
Use the data below to calculate the length of stay for each patient. Assume that the dates are in the same year and that it is not a leap year.
The length of stay for Patient E is _______________.
The length of stay for Patient E is _______________.
Unlock Deck
Unlock for access to all 72 flashcards in this deck.
Unlock Deck
k this deck
46
A value in a sample or population much higher or lower than the average is called an _______________.
Unlock Deck
Unlock for access to all 72 flashcards in this deck.
Unlock Deck
k this deck
47
To study only the female students registered for this class is to examine a _____________ of the population.
Unlock Deck
Unlock for access to all 72 flashcards in this deck.
Unlock Deck
k this deck
48
Use the data below to calculate the length of stay for each patient. Assume that the dates are in the same year and that it is not a leap year.
The length of stay for Patient A is _______________.
The length of stay for Patient A is _______________.
Unlock Deck
Unlock for access to all 72 flashcards in this deck.
Unlock Deck
k this deck
49
Use the data below to calculate the length of stay for each patient. Assume that the dates are in the same year and that it is not a leap year.
The length of stay for Patient G is _______________.
The length of stay for Patient G is _______________.
Unlock Deck
Unlock for access to all 72 flashcards in this deck.
Unlock Deck
k this deck
50
The diagnosis index may be ____________ to remove patient identifiers.
Unlock Deck
Unlock for access to all 72 flashcards in this deck.
Unlock Deck
k this deck
51
When the clerk requests a report from a computer system, he or she is said to _________ the database.
Unlock Deck
Unlock for access to all 72 flashcards in this deck.
Unlock Deck
k this deck
52
Use the data below to calculate the length of stay for each patient. Assume that the dates are in the same year and that it is not a leap year.
The length of stay for Patient F is _______________.
The length of stay for Patient F is _______________.
Unlock Deck
Unlock for access to all 72 flashcards in this deck.
Unlock Deck
k this deck
53
Frequency distributions that are not symmetrical are ______________ .
Unlock Deck
Unlock for access to all 72 flashcards in this deck.
Unlock Deck
k this deck
54
Use the data below to calculate the length of stay for each patient. Assume that the dates are in the same year and that it is not a leap year.
The length of stay for Patient D is _______________.
The length of stay for Patient D is _______________.
Unlock Deck
Unlock for access to all 72 flashcards in this deck.
Unlock Deck
k this deck
55
Use the data below to calculate the length of stay for each patient. Assume that the dates are in the same year and that it is not a leap year.
The length of stay for Patient H is _______________.
The length of stay for Patient H is _______________.
Unlock Deck
Unlock for access to all 72 flashcards in this deck.
Unlock Deck
k this deck
56
Calculate the average length of stay for the following patients who were discharged on July 14.
Unlock Deck
Unlock for access to all 72 flashcards in this deck.
Unlock Deck
k this deck
57
Below are the lengths of stay for the following patients who were discharged on July 14. This is an acute care facility. Does the ALOS reflect an acute care facility's typical patient length of stay? Why or why not?
Unlock Deck
Unlock for access to all 72 flashcards in this deck.
Unlock Deck
k this deck
58
A measure of variance called the ______________ shows how closely the observations are distributed around the mean.
Unlock Deck
Unlock for access to all 72 flashcards in this deck.
Unlock Deck
k this deck
59
The result of a query is also known as a _____________.
Unlock Deck
Unlock for access to all 72 flashcards in this deck.
Unlock Deck
k this deck
60
Use the data below to calculate the length of stay for each patient. Assume that the dates are in the same year and that it is not a leap year.
The length of stay for Patient B is _______________.
The length of stay for Patient B is _______________.
Unlock Deck
Unlock for access to all 72 flashcards in this deck.
Unlock Deck
k this deck
61
Margaret Lorraine was admitted to the hospital on March 17 and discharged on April 5. What is her length of stay?
Unlock Deck
Unlock for access to all 72 flashcards in this deck.
Unlock Deck
k this deck
62
Use the table below to compute the answers for the following questions.
Compute the average length of stay (ALOS) (A&C).
Compute the average length of stay (ALOS) (A&C).
Unlock Deck
Unlock for access to all 72 flashcards in this deck.
Unlock Deck
k this deck
63
Use the table below to compute the answers for the following questions.
Compute the bed occupancy rate (A&C).
Compute the bed occupancy rate (A&C).
Unlock Deck
Unlock for access to all 72 flashcards in this deck.
Unlock Deck
k this deck
64
Explain the mean, median, and mode.
Unlock Deck
Unlock for access to all 72 flashcards in this deck.
Unlock Deck
k this deck
65
Describe circumstances in which a department in the health care organization may request health information or statistics.
Unlock Deck
Unlock for access to all 72 flashcards in this deck.
Unlock Deck
k this deck
66
Use the table below to compute the answers for the following questions.
Compute the nosocomial infection rate (A&C).
Compute the nosocomial infection rate (A&C).
Unlock Deck
Unlock for access to all 72 flashcards in this deck.
Unlock Deck
k this deck
67
Identify information that must be reported by a health care facility to the Department of Vital Statistics.
Unlock Deck
Unlock for access to all 72 flashcards in this deck.
Unlock Deck
k this deck
68
The health information management professional uses the database created by the patient abstracts to query for reports. Can you explain and give an example of how this function operates?
Unlock Deck
Unlock for access to all 72 flashcards in this deck.
Unlock Deck
k this deck
69
In 2012, Comfort Community Hospital had 150 beds from January 1 through June 30. On July 1, the hospital increased its beds to 250 and the number remained at 250 through December 31. During the first 6 months, 27,912 inpatient days of service (IPSDs) were provided. During the last 6 months, 35,967 days of service were provided. What is the average daily census for the first 6 months in a non-leap year? The last 6 months? The whole year?
Unlock Deck
Unlock for access to all 72 flashcards in this deck.
Unlock Deck
k this deck
70
Comfort Community Hospital records the following figures for June 1:
Admissions: 8
Discharges: 2
DOA: 2
If the count of the last census was 57, what is the census for June 1?
Admissions: 8
Discharges: 2
DOA: 2
If the count of the last census was 57, what is the census for June 1?
Unlock Deck
Unlock for access to all 72 flashcards in this deck.
Unlock Deck
k this deck
71
Explain the difference between a population and a sample.
Unlock Deck
Unlock for access to all 72 flashcards in this deck.
Unlock Deck
k this deck
72
Explain the difference between aggregate and patient-specific data.
Unlock Deck
Unlock for access to all 72 flashcards in this deck.
Unlock Deck
k this deck
Unlock Deck
Unlock for access to all 72 flashcards in this deck.


