Deck 13: Data Warehousing Design
Full screen (f)
Question
Question
Question
Question
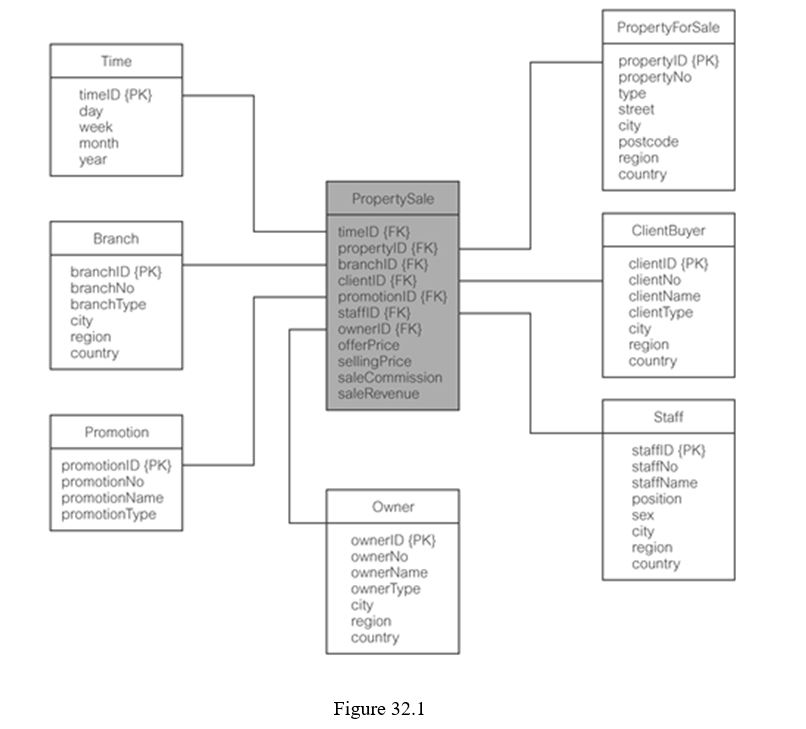
The star schema shown in Figure 32.1 describes part of the database that will provide decision-support for a property sales company. Describe the main characteristics of fact and dimension tables and discuss the purpose of the tables shown in the star schema of Figure 32.1.
Question
Question
Question
Question
Question
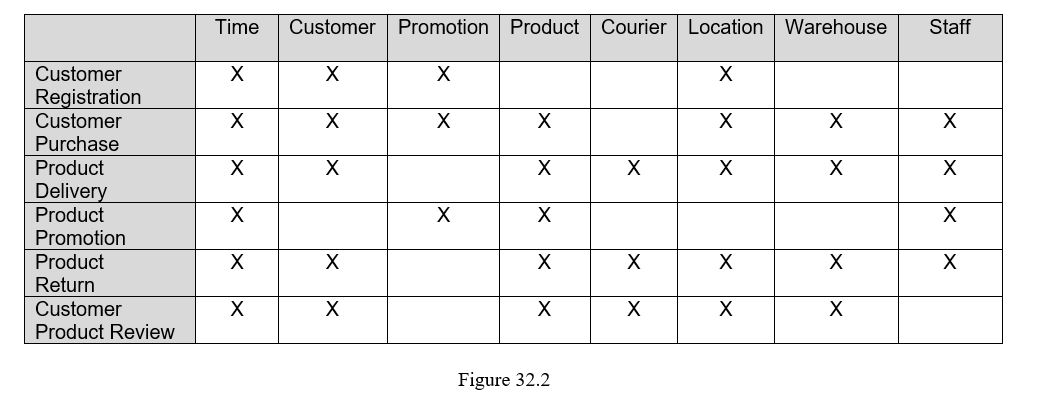
Discuss what the bus matrix (shown in Figure 32.2) for an online retailer represents and how it can be used to facilitate the creation of a data warehouse.
Question
Question
The data mart shown in Figure 32.3 supports the analysis of a media (TV programmes and films) streaming service.
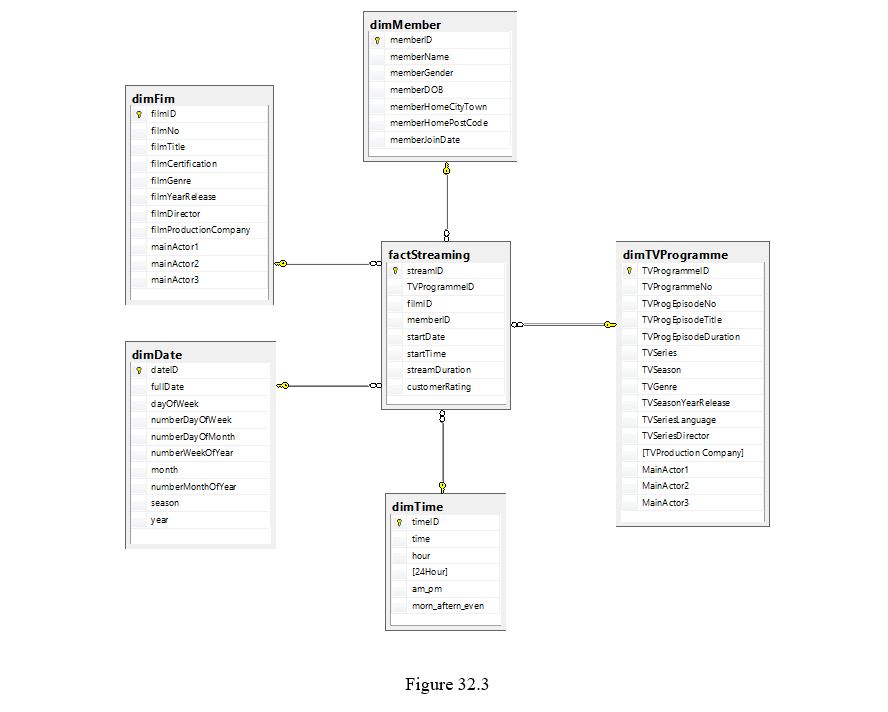
-Describe the characteristics and purpose of fact and dimension tables and explain how you recognise that this data mart is based on a star schema design. Illustrate your answer using the data mart tables in Figure 32.3
-Describe the characteristics and purpose of fact and dimension tables and explain how you recognise that this data mart is based on a star schema design. Illustrate your answer using the data mart tables in Figure 32.3
Question
The data mart shown in Figure 32.3 supports the analysis of a media (TV programmes and films) streaming service.
-Identify three types of analysis that the data mart shown in Figure 32.3 can support about media streaming.
-Identify three types of analysis that the data mart shown in Figure 32.3 can support about media streaming.
Question
The data mart shown in Figure 32.3 supports the analysis of a media (TV programmes and films) streaming service.
-The data mart shown in Figure 32.3 cannot support the analysis of media streaming according to the age of the member at the time of the streaming. Describe the changes necessary to the data mart to support this type of analysis.
-The data mart shown in Figure 32.3 cannot support the analysis of media streaming according to the age of the member at the time of the streaming. Describe the changes necessary to the data mart to support this type of analysis.
Question
Question

Unlock Deck
Sign up to unlock the cards in this deck!
Unlock Deck
Unlock Deck
1/15
Play
Full screen (f)
Deck 13: Data Warehousing Design
1
Describe the main principles and key features of Kimball's Business Dimensional Lifecycle. Support your answer with a diagram showing the stages of the lifecycle.
The Business Dimensional Lifecycle - Principles
o Focus on the business e.g. Identify business requirements and their associated value.
o Build an information infrastructure e.g. build a single, integrated, easy-to-use, high performance information foundation able to meet the business requirements.
o Deliver in meaningful increments e.g. 6 to 12 month timeframes.
o Deliver the entire solution e.g. provide all the elements necessary to deliver value to the business user e.g. data warehouse, ad hoc query tools, reporting applications, advanced analytics, training, support etc
The Business Dimensional Lifecycle - Key Features
1. Business Requirements Definition plays central role by influencing Project Planning and providing the foundation for the three tracks that follow concerning:
o Technology (top track)
o Data (middle track)
o BI applications (bottom track)
2. Comprehensive project management
3. Incremental and iterative approach
Answer should be supported with a diagram of lifecycle.
2
Describe the proposed approach to designing a star schema in the Dimensional Modelling stage of Kimball's Business Dimensional Lifecycle. Include the creation of a simple (maximum of four dimension tables and one fact table with maximum of six attributes per table) star schema to illustrate each step.
Dimensional Modeling Stage
This stage can create a dimensional model (DM) for a data warehouse or to 'dimensionalize' the relational schema of an OLTP database.
A high-level (simplified) version of the dimension model is first created, which progressively gains more detail.
The DM is created using a two phased approach -
Part I Create a high-level DM - a graphical representation of the dimension, fact and utility tables involved in representing the business process. The DM is created using a four-step process.
Part II Identify all dimension and fact attributes for the DM.
Part I Create a high-level DM (4 step process)
Step 1 Select Business Process
Enterprise-level business requirements should identify business process (subject area) to be modelled.
The first business process should:
o Deliver significant value to the organisation,
o Built in reasonable time,
o Establish data foundations for the enterprise view by creating reusable or conformed dimensions.
Step 2 Declare the Grain
Decide on level of detail or the grain needed for the selected business process. In other words, what a row of the fact table represents.
Choosing the level of grain is determined by finding a balance between meeting business requirements and what is possible given the data source. Recommendation is to build the DM using the lowest level of detail available.
Step 3 Choose the Dimensions
Determine the most useful dimensions that apply to each fact row and how to best represent each dimension.
Step 4 Identify the Facts
Identify numeric facts used to measure the business process. This step should also identify calculations derived from the facts, which are used to monitor the business.
Part II - Identify Dimension and Fact Attributes
This part involves identifying the attributes needed by the business to analyse the selected business process.
The usefulness of a DM is determined by the attributes associated with each dimension as this governs how the data will be viewed for analysis.
3
Identify three differences between Kimball's approach to data warehouse development and Inmon's approach.
There are a number of differences between the approaches and the student is free to identify any three such as Kimball recommends first breaking down the project into smaller parts (called data marts) whereas Inmon does not; Kimball uses new techniques e.g. dimensional modelling whereas Inmon uses traditional database techniques and Kimball recommends a denormalised database structure while Inmon does not and his conforms to 3NF.
4
The star schema shown in Figure 32.1 describes part of the database that will provide decision-support for a property sales company. Describe the main characteristics of fact and dimension tables and discuss the purpose of the tables shown in the star schema of Figure 32.1.
Unlock Deck
Unlock for access to all 15 flashcards in this deck.
Unlock Deck
k this deck
5
Identify three types of analysis that the star schema shown in Figure 32.1 can support about property sales.
Unlock Deck
Unlock for access to all 15 flashcards in this deck.
Unlock Deck
k this deck
6
What do slowly changing dimensions (SCDs) represent to a database designed for decision-support?
Unlock Deck
Unlock for access to all 15 flashcards in this deck.
Unlock Deck
k this deck
7
Describe the three types of SCDs.
Unlock Deck
Unlock for access to all 15 flashcards in this deck.
Unlock Deck
k this deck
8
Identify two possible examples of SCDs in the property sales star schema shown in Figure 32.1 and discuss the types of change each represents.
Unlock Deck
Unlock for access to all 15 flashcards in this deck.
Unlock Deck
k this deck
9
Discuss what the bus matrix (shown in Figure 32.2) for an online retailer represents and how it can be used to facilitate the creation of a data warehouse.
Unlock Deck
Unlock for access to all 15 flashcards in this deck.
Unlock Deck
k this deck
10
Produce a star schema for the Product Delivery business process using the information shown in Figure 32.2. Based on your understanding of this business process, add a maximum of 5 (possible) attributes to each dimension table in your schema. Complete your star schema by adding a maximum of 8 (possible) attributes to your fact table. Your choice of attributes should demonstrate that you have a realistic idea of how this star schema is likely to be queried.
Unlock Deck
Unlock for access to all 15 flashcards in this deck.
Unlock Deck
k this deck
11
The data mart shown in Figure 32.3 supports the analysis of a media (TV programmes and films) streaming service.
-Describe the characteristics and purpose of fact and dimension tables and explain how you recognise that this data mart is based on a star schema design. Illustrate your answer using the data mart tables in Figure 32.3
-Describe the characteristics and purpose of fact and dimension tables and explain how you recognise that this data mart is based on a star schema design. Illustrate your answer using the data mart tables in Figure 32.3
Unlock Deck
Unlock for access to all 15 flashcards in this deck.
Unlock Deck
k this deck
12
The data mart shown in Figure 32.3 supports the analysis of a media (TV programmes and films) streaming service.
-Identify three types of analysis that the data mart shown in Figure 32.3 can support about media streaming.
-Identify three types of analysis that the data mart shown in Figure 32.3 can support about media streaming.
Unlock Deck
Unlock for access to all 15 flashcards in this deck.
Unlock Deck
k this deck
13
The data mart shown in Figure 32.3 supports the analysis of a media (TV programmes and films) streaming service.
-The data mart shown in Figure 32.3 cannot support the analysis of media streaming according to the age of the member at the time of the streaming. Describe the changes necessary to the data mart to support this type of analysis.
-The data mart shown in Figure 32.3 cannot support the analysis of media streaming according to the age of the member at the time of the streaming. Describe the changes necessary to the data mart to support this type of analysis.
Unlock Deck
Unlock for access to all 15 flashcards in this deck.
Unlock Deck
k this deck
14
What do slowly changing dimensions (SCDs) represent to a database designed for decision-support?
Unlock Deck
Unlock for access to all 15 flashcards in this deck.
Unlock Deck
k this deck
15
Describe three types of slowly changing dimension (SCDs) and discuss the best SCD Type to track changes over time to a member's home address.
Unlock Deck
Unlock for access to all 15 flashcards in this deck.
Unlock Deck
k this deck
Unlock Deck
Unlock for access to all 15 flashcards in this deck.


