Deck 4: Estimating Demand Functions
Full screen (f)
Question
Suppose the size of the labor force and unemployment rate across countries in 2001 are given in the following table.What is the intercept coefficient estimate a of the regression of the unemployment rate as a function of the labor force? 
A) 6.
B) 8.
C) 10.
D) 12.
E) 14.
A) 6.
B) 8.
C) 10.
D) 12.
E) 14.
Question
Question
Question
Question
The vacancy rates for commercial office space in 2001 for selected cities are given in the following table.What is the slope coefficient estimate b of the regression of the vacancy rate downtown as a function of the vacancy rate in the suburbs? 
A) 1.0.
B) 0.5.
C) 2.5.
D) 1.5.
E) 0.0.
A) 1.0.
B) 0.5.
C) 2.5.
D) 1.5.
E) 0.0.
Question
The mean annual precipitation in inches and number of days per year with measurable precipitation by selected cities are given in the following table.What is the R-squared of the regression of the mean annual rainfall as a function of the number of rainy days? 
A) 0.28.
B) 0.38.
C) 0.48.
D) 0.58.
E) 0.68.
A) 0.28.
B) 0.38.
C) 0.48.
D) 0.58.
E) 0.68.
Question
The 1991 exports and imports by industry code are given in the following table.What is the approximate slope coefficient estimate b of the regression of exports as a function of imports? 
A) -0.5.
B) -5.0.
C) -0.3.
D) -3.0.
E) 0.4.
A) -0.5.
B) -5.0.
C) -0.3.
D) -3.0.
E) 0.4.
Question
The annual mean daily high and low temperatures by selected cities are given in the following table.What is the R-squared of the regression of the mean daily high temperature as a function of the mean daily low temperature? 
A) 0.67.
B) 0.25.
C) 0.75.
D) 0.50.
E) 0.85.
A) 0.67.
B) 0.25.
C) 0.75.
D) 0.50.
E) 0.85.
Question
Question
Question
Question
Question
The mean annual precipitation in inches and number of days per year with measurable precipitation by selected cities are given in the following table.If the average number of days with rain is one greater in Tupelo than in Tucumcari,what do you estimate the difference in average annual rainfall will be? 
A) 0.5 inch.
B) 1.0 inch.
C) 0.8 inch.
D) 1.25 inches.
E) 2.0 inches.
A) 0.5 inch.
B) 1.0 inch.
C) 0.8 inch.
D) 1.25 inches.
E) 2.0 inches.
Question
Question
The vacancy rates for commercial office space in 2001 for selected cities are given in the following table.What is the intercept coefficient estimate a of the regression of the vacancy rate downtown as a function of the vacancy rate in the suburbs? 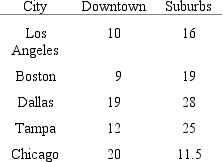
A) 5.0.
B) 16.0.
C) 14.0.
D) 18.0.
E) 7.5.
A) 5.0.
B) 16.0.
C) 14.0.
D) 18.0.
E) 7.5.
Question
Annual sales and profits in the coal industry are given in the following table.What is the slope coefficient estimate b of the regression of profits as a function of sales? 
A) 0.09.
B) 0.9.
C) 1.2.
D) 0.12.
E) 0.06.
A) 0.09.
B) 0.9.
C) 1.2.
D) 0.12.
E) 0.06.
Question
Suppose the labor force and unemployment rate in 2001 are given in the following table.What is the slope coefficient estimate b of the regression of the unemployment rate as a function of the labor force? 
A) -0.20.
B) -0.020.
C) -0.0020.
D) -2.0.
E) 0.020.
A) -0.20.
B) -0.020.
C) -0.0020.
D) -2.0.
E) 0.020.
Question
The vacancy rates for commercial office space in 2001 for selected cities are given in the following table.What is the R-squared of the regression of the vacancy rate downtown as a function of the vacancy rate in the suburbs? 
A) 1.0.
B) 0.5.
C) 0.25.
D) 0.75.
E) 0.
A) 1.0.
B) 0.5.
C) 0.25.
D) 0.75.
E) 0.
Question
Question
The annual mean daily high and low temperatures by selected cities are given in the following table.What is the estimate of the intercept coefficient a for the regression of the mean daily high temperature as a function of the mean daily low temperature? 
A) 50.0.
B) 45.0.
C) 47.5.
D) -47.50.
E) -50.0.
A) 50.0.
B) 45.0.
C) 47.5.
D) -47.50.
E) -50.0.
Question
Question
Question
The 1991 exports and imports by industry code are given in the following table.What is the approximate intercept coefficient estimate a of the regression of exports as a function of imports? 
A) 30.
B) 40.
C) 50.
D) 60.
E) 70.
A) 30.
B) 40.
C) 50.
D) 60.
E) 70.
Question
The daily mean temperatures in January and July by selected cities are given in the following table.If the mean temperature in January is 1 degree higher in Tupelo than in Tucumcari,what do you estimate the difference (Tupelo-Tucumcari)in mean temperatures will be in July? 
A) 1.25 degrees.
B) 2.0 degrees.
C) 0.40 degree.
D) 0.80 degree.
E) 1.0 degree.
A) 1.25 degrees.
B) 2.0 degrees.
C) 0.40 degree.
D) 0.80 degree.
E) 1.0 degree.
Question
Question
Question
Question
Question
Question
Question
Question
Question
Question
Question
Question
Question
Question
Question
The annual mean daily high and low temperatures by selected cities are given in the following table.If the mean low temperature is 1 degree higher in Tupelo than in Tucumcari,what do you estimate the difference in mean high temperatures will be? 
A) 1.0 degree.
B) 1.25 degrees.
C) 0.75 degree.
D) 1.50 degrees.
E) 2.50 degrees.
A) 1.0 degree.
B) 1.25 degrees.
C) 0.75 degree.
D) 1.50 degrees.
E) 2.50 degrees.
Question
Coal industry sales and profits are given in the following table.What is the intercept coefficient estimate a of the regression of profits as a function of sales? 
A) 0.12.
B) 0.14.
C) 0.16.
D) 0.18.
E) 0.22.
A) 0.12.
B) 0.14.
C) 0.16.
D) 0.18.
E) 0.22.
Question
Question
Question
Question
Question
Question
Question
Question

Unlock Deck
Sign up to unlock the cards in this deck!
Unlock Deck
Unlock Deck
1/48
Play
Full screen (f)
Deck 4: Estimating Demand Functions
1
Suppose the size of the labor force and unemployment rate across countries in 2001 are given in the following table.What is the intercept coefficient estimate a of the regression of the unemployment rate as a function of the labor force?
A) 6.
B) 8.
C) 10.
D) 12.
E) 14.
A) 6.
B) 8.
C) 10.
D) 12.
E) 14.
B
2
The use of consumer interviews to estimate demand functions has been criticized by economists primarily because:
A) answering surveys takes too much time.
B) the answers collected cannot be easily quantified.
C) respondents don't have strong incentives to answer accurately.
D) interviewers are often belligerent.
E) survey questions are difficult to word clearly.
A) answering surveys takes too much time.
B) the answers collected cannot be easily quantified.
C) respondents don't have strong incentives to answer accurately.
D) interviewers are often belligerent.
E) survey questions are difficult to word clearly.
C
3
The inability to isolate a demand curve from observed prices and quantities alone is known as the:
A) economist's problem.
B) inference problem.
C) regression problem.
D) identification problem.
E) timing problem.
A) economist's problem.
B) inference problem.
C) regression problem.
D) identification problem.
E) timing problem.
D
4
Regression analysis is:
A) a psychoanalytical tool, often called "regression toward the mean," used by economists to estimate consumer reactions.
B) always preferable to consumer interviews or market experiments.
C) usually done with a pencil and paper.
D) a statistical technique that describes how one variable is related to another.
E) almost never used in practice because of concerns about alienating a firm's customers.
Unlock Deck
Unlock for access to all 48 flashcards in this deck.
Unlock Deck
k this deck
5
The vacancy rates for commercial office space in 2001 for selected cities are given in the following table.What is the slope coefficient estimate b of the regression of the vacancy rate downtown as a function of the vacancy rate in the suburbs?
A) 1.0.
B) 0.5.
C) 2.5.
D) 1.5.
E) 0.0.
A) 1.0.
B) 0.5.
C) 2.5.
D) 1.5.
E) 0.0.
Unlock Deck
Unlock for access to all 48 flashcards in this deck.
Unlock Deck
k this deck
6
The mean annual precipitation in inches and number of days per year with measurable precipitation by selected cities are given in the following table.What is the R-squared of the regression of the mean annual rainfall as a function of the number of rainy days?
A) 0.28.
B) 0.38.
C) 0.48.
D) 0.58.
E) 0.68.
A) 0.28.
B) 0.38.
C) 0.48.
D) 0.58.
E) 0.68.
Unlock Deck
Unlock for access to all 48 flashcards in this deck.
Unlock Deck
k this deck
7
The 1991 exports and imports by industry code are given in the following table.What is the approximate slope coefficient estimate b of the regression of exports as a function of imports?
A) -0.5.
B) -5.0.
C) -0.3.
D) -3.0.
E) 0.4.
A) -0.5.
B) -5.0.
C) -0.3.
D) -3.0.
E) 0.4.
Unlock Deck
Unlock for access to all 48 flashcards in this deck.
Unlock Deck
k this deck
8
The annual mean daily high and low temperatures by selected cities are given in the following table.What is the R-squared of the regression of the mean daily high temperature as a function of the mean daily low temperature?
A) 0.67.
B) 0.25.
C) 0.75.
D) 0.50.
E) 0.85.
A) 0.67.
B) 0.25.
C) 0.75.
D) 0.50.
E) 0.85.
Unlock Deck
Unlock for access to all 48 flashcards in this deck.
Unlock Deck
k this deck
9
A cost of estimating demand functions particular to the use of market experiments is:
A) the possibility that customers may be lost and profits cut as a result of the experiment.
B) the shipping costs to markets across the country.
C) the need to determine the profit-maximizing discount.
D) the cost of collecting data.
E) none of the above.
A) the possibility that customers may be lost and profits cut as a result of the experiment.
B) the shipping costs to markets across the country.
C) the need to determine the profit-maximizing discount.
D) the cost of collecting data.
E) none of the above.
Unlock Deck
Unlock for access to all 48 flashcards in this deck.
Unlock Deck
k this deck
10
The estimated mathematical relationship between dependent and independent variables derived using ordinary least squares is called the:
A) covariance.
B) sample regression line.
C) residual demand curve.
D) goodness of fit.
E) coefficient of determination.
A) covariance.
B) sample regression line.
C) residual demand curve.
D) goodness of fit.
E) coefficient of determination.
Unlock Deck
Unlock for access to all 48 flashcards in this deck.
Unlock Deck
k this deck
11
If an analyst were confident that all factors that shift the supply curve were constant when observing changing prices and quantities traded:
A) the analyst would be confident that the demand curve had been identified.
B) neither the supply nor the demand curve would have been identified.
C) the analyst should gather more data to find shifts in both curves.
D) both the supply and demand curves would have been identified.
E) the analyst would be confident that the supply curve had been identified.
Unlock Deck
Unlock for access to all 48 flashcards in this deck.
Unlock Deck
k this deck
12
The slope coefficient estimate b from a regression of profits on sales of a number of firms in the coal industry is 0.075.How should you interpret this coefficient?
A) Average profit in the coal industry is 7.5%.
B) If a firm in the coal industry were to increase its sales by $1, its profits would rise on average by $0.075.
C) If a firm has 1 more dollar in sales than another firm in the coal industry, it will have 7.5 more cents in profit on average.
D) Average profit in the coal industry is .75%.
E) If a firm in the coal industry were to increase its sales by $1, its profits would rise on average by $0.0075.
Unlock Deck
Unlock for access to all 48 flashcards in this deck.
Unlock Deck
k this deck
13
The mean annual precipitation in inches and number of days per year with measurable precipitation by selected cities are given in the following table.If the average number of days with rain is one greater in Tupelo than in Tucumcari,what do you estimate the difference in average annual rainfall will be?
A) 0.5 inch.
B) 1.0 inch.
C) 0.8 inch.
D) 1.25 inches.
E) 2.0 inches.
A) 0.5 inch.
B) 1.0 inch.
C) 0.8 inch.
D) 1.25 inches.
E) 2.0 inches.
Unlock Deck
Unlock for access to all 48 flashcards in this deck.
Unlock Deck
k this deck
14
A simple,idealized representation of the real world is called a(n):
A) function.
B) illustration.
C) equation.
D) diagram.
E) model.
A) function.
B) illustration.
C) equation.
D) diagram.
E) model.
Unlock Deck
Unlock for access to all 48 flashcards in this deck.
Unlock Deck
k this deck
15
The vacancy rates for commercial office space in 2001 for selected cities are given in the following table.What is the intercept coefficient estimate a of the regression of the vacancy rate downtown as a function of the vacancy rate in the suburbs?
A) 5.0.
B) 16.0.
C) 14.0.
D) 18.0.
E) 7.5.
A) 5.0.
B) 16.0.
C) 14.0.
D) 18.0.
E) 7.5.
Unlock Deck
Unlock for access to all 48 flashcards in this deck.
Unlock Deck
k this deck
16
Annual sales and profits in the coal industry are given in the following table.What is the slope coefficient estimate b of the regression of profits as a function of sales?
A) 0.09.
B) 0.9.
C) 1.2.
D) 0.12.
E) 0.06.
A) 0.09.
B) 0.9.
C) 1.2.
D) 0.12.
E) 0.06.
Unlock Deck
Unlock for access to all 48 flashcards in this deck.
Unlock Deck
k this deck
17
Suppose the labor force and unemployment rate in 2001 are given in the following table.What is the slope coefficient estimate b of the regression of the unemployment rate as a function of the labor force?
A) -0.20.
B) -0.020.
C) -0.0020.
D) -2.0.
E) 0.020.
A) -0.20.
B) -0.020.
C) -0.0020.
D) -2.0.
E) 0.020.
Unlock Deck
Unlock for access to all 48 flashcards in this deck.
Unlock Deck
k this deck
18
The vacancy rates for commercial office space in 2001 for selected cities are given in the following table.What is the R-squared of the regression of the vacancy rate downtown as a function of the vacancy rate in the suburbs?
A) 1.0.
B) 0.5.
C) 0.25.
D) 0.75.
E) 0.
A) 1.0.
B) 0.5.
C) 0.25.
D) 0.75.
E) 0.
Unlock Deck
Unlock for access to all 48 flashcards in this deck.
Unlock Deck
k this deck
19
The most frequently used method for estimating demand functions is:
A) market experiments.
B) consumer interviews.
C) regression analysis.
D) focus groups.
E) casual introspection.
A) market experiments.
B) consumer interviews.
C) regression analysis.
D) focus groups.
E) casual introspection.
Unlock Deck
Unlock for access to all 48 flashcards in this deck.
Unlock Deck
k this deck
20
The annual mean daily high and low temperatures by selected cities are given in the following table.What is the estimate of the intercept coefficient a for the regression of the mean daily high temperature as a function of the mean daily low temperature?
A) 50.0.
B) 45.0.
C) 47.5.
D) -47.50.
E) -50.0.
A) 50.0.
B) 45.0.
C) 47.5.
D) -47.50.
E) -50.0.
Unlock Deck
Unlock for access to all 48 flashcards in this deck.
Unlock Deck
k this deck
21
A regression of the average temperature in July as a function of the average temperature in January across cities yielded the following: July temperature = 20 + 2.0 * January temperature,Prob > F = .03,R2 = .64,and RMSE = 20.If a city has an average temperature of 40 degrees in January,what does this regression say about its likely July temperature?
A) The July estimate is 100 degrees, and since the F-statistic has only a 3% chance of being so large if the January temperature did not affect the July temperature, we would be confident in this estimate.
B) The July estimate is 100 degrees, and since the R2 says that variation in the January temperature explains 64% of the variation in the July temperature, we would be confident in this estimate.
C) Since the F-statistic has only a 3% chance of being so large if the January temperature did not affect the July temperature and the R2 is so high, there is a serial correlation problem that invalidates any inferences we might draw from the regression.
D) The July estimate is 100 degrees, and since the RMSE equals 20, normal statistical confidence intervals would allow for most temperatures from 60 to 140 degrees. Although the point estimate of 100 degrees is our best estimate, we must accept that the actual temperature might be quite different; we would not have confidence in this estimate.
E) Since the F-statistic has only a 3% chance of being so large if the January temperature did not affect the July temperature and the R2 is so high, there is a multicollinearity problem that invalidates any inferences we might draw from the regression.
Unlock Deck
Unlock for access to all 48 flashcards in this deck.
Unlock Deck
k this deck
22
The statistic that tests an individual coefficient for statistical significance is the:
A) R-squared statistic.
B) t-statistic.
C) Durbin-Watson statistic.
D) F-test statistic.
E) standard error of the estimate.
A) R-squared statistic.
B) t-statistic.
C) Durbin-Watson statistic.
D) F-test statistic.
E) standard error of the estimate.
Unlock Deck
Unlock for access to all 48 flashcards in this deck.
Unlock Deck
k this deck
23
The 1991 exports and imports by industry code are given in the following table.What is the approximate intercept coefficient estimate a of the regression of exports as a function of imports?
A) 30.
B) 40.
C) 50.
D) 60.
E) 70.
A) 30.
B) 40.
C) 50.
D) 60.
E) 70.
Unlock Deck
Unlock for access to all 48 flashcards in this deck.
Unlock Deck
k this deck
24
The daily mean temperatures in January and July by selected cities are given in the following table.If the mean temperature in January is 1 degree higher in Tupelo than in Tucumcari,what do you estimate the difference (Tupelo-Tucumcari)in mean temperatures will be in July?
A) 1.25 degrees.
B) 2.0 degrees.
C) 0.40 degree.
D) 0.80 degree.
E) 1.0 degree.
A) 1.25 degrees.
B) 2.0 degrees.
C) 0.40 degree.
D) 0.80 degree.
E) 1.0 degree.
Unlock Deck
Unlock for access to all 48 flashcards in this deck.
Unlock Deck
k this deck
25
A regression of exports as a function of imports in 1991 across industry types yielded exports = 68 - 0.3(imports),R2 = .25,Prob > F = .26,and RMSE = 30.If imports by an industry equal 60,what is the estimate of exports from this industry,and how confident are you of your estimate?
A) Exportsestimated = 50, variation in imports explains 25% of variation in exports, and the F-test statistic is high, so we are confident in our estimate of exports.
B) Exportsestimated = 86, variation in imports explains 25% of variation in exports, and the F-test statistic is high, so we are confident in our estimate of exports.
C) Exportsestimated = 50, variation in exports explains 25% of variation in imports, and the F-test statistic is high, so we are confident in our estimate of exports.
D) Exportsestimated = 86, variation in exports explains 25% of variation in imports, and the F-test statistic is high, so we are confident in our estimate of exports.
E) Exportsestimated = 50, but the F-test statistic fails standard significance tests and the RMSE is large relative to estimated exports, so we are not confident in our estimate.
Unlock Deck
Unlock for access to all 48 flashcards in this deck.
Unlock Deck
k this deck
26
When the t-ratio statistics on individual coefficients are all near 0 but the F-test statistic is greater than 20:
A) multicollinearity is suggested.
B) nonconstant variance of the error terms is suggested.
C) serial correlation is suggested.
D) the root-mean-squared error will be large.
E) the Durbin-Watson statistic will be near 0.
A) multicollinearity is suggested.
B) nonconstant variance of the error terms is suggested.
C) serial correlation is suggested.
D) the root-mean-squared error will be large.
E) the Durbin-Watson statistic will be near 0.
Unlock Deck
Unlock for access to all 48 flashcards in this deck.
Unlock Deck
k this deck
27
The statistic used to test whether the independent variables taken as a group explain a statistically significant portion of the variation in the dependent variable is the:
A) R-squared statistic.
B) t-statistic.
C) Durbin-Watson statistic.
D) F-test statistic.
E) standard error of the estimate.
A) R-squared statistic.
B) t-statistic.
C) Durbin-Watson statistic.
D) F-test statistic.
E) standard error of the estimate.
Unlock Deck
Unlock for access to all 48 flashcards in this deck.
Unlock Deck
k this deck
28
The statistic used to test for serial correlation is the:
A) R-squared statistic.
B) t-statistic.
C) Durbin-Watson statistic.
D) F-test statistic.
E) standard error of the estimate.
A) R-squared statistic.
B) t-statistic.
C) Durbin-Watson statistic.
D) F-test statistic.
E) standard error of the estimate.
Unlock Deck
Unlock for access to all 48 flashcards in this deck.
Unlock Deck
k this deck
29
A regression of the mean annual precipitation in inches as a function of number of days per year with measurable precipitation across cities yielded rain = -2 + 0.8 (number of rainy days),R2 = .75,and RMSE = 11.How do you interpret the intercept coefficient estimate of -2?
A) There must be 2.5 rainy days before there is any measured rain.
B) If there are no rainy days in a year, meteorologists report a -2-inch rainfall for the year.
C) The regression results hold for values of the independent variables that are similar to values used to estimate the regression and not for extreme values, like 0 rainy days per year.
D) Since the RMSE is 5.5 times the intercept coefficient, we can conclude that it is not significantly different from 0.
E) The average annual rainfall will be 0.8 inch for every rainy day exceeding 2.
Unlock Deck
Unlock for access to all 48 flashcards in this deck.
Unlock Deck
k this deck
30
In simple regression analysis (Y = a + bX),the estimate of the intercept coefficient a is equal to
A) Ymean - bXmean.
B) Xmean - bYmean.
C) Ymean + bXmean.
D) Xmean + bYmean.
E) Ymean - Xmean / b.
A) Ymean - bXmean.
B) Xmean - bYmean.
C) Ymean + bXmean.
D) Xmean + bYmean.
E) Ymean - Xmean / b.
Unlock Deck
Unlock for access to all 48 flashcards in this deck.
Unlock Deck
k this deck
31
In simple regression analysis (Y = a + bX),the estimate of the slope coefficient b is equal to
A) [ [(Xi - Xmean)(Yi - Ymean)] / (Xi - Xmean)]2.
B) {[(Xi - Xmean)(Yi - Ymean)] / (Xi - Xmean)}2.
C) [(Xi - Xmean)(Yi - Ymean)] / (Xi - Xmean)2.
D) [(Xi + Xmean)(Yi + Ymean)] / (Xi + Xmean)2.
E) [(Xi - Xmean)(Yi - Ymean)] / (Xi - Xmean).
A) [ [(Xi - Xmean)(Yi - Ymean)] / (Xi - Xmean)]2.
B) {[(Xi - Xmean)(Yi - Ymean)] / (Xi - Xmean)}2.
C) [(Xi - Xmean)(Yi - Ymean)] / (Xi - Xmean)2.
D) [(Xi + Xmean)(Yi + Ymean)] / (Xi + Xmean)2.
E) [(Xi - Xmean)(Yi - Ymean)] / (Xi - Xmean).
Unlock Deck
Unlock for access to all 48 flashcards in this deck.
Unlock Deck
k this deck
32
Serial correlation occurs when:
A) independent variables are correlated across observations.
B) dependent variables are correlated across observations.
C) error terms are correlated across observations.
D) R-squared is near 1 and the t-statistics are near 0.
E) R-squared is near 0 and the t-statistics are near 1.
A) independent variables are correlated across observations.
B) dependent variables are correlated across observations.
C) error terms are correlated across observations.
D) R-squared is near 1 and the t-statistics are near 0.
E) R-squared is near 0 and the t-statistics are near 1.
Unlock Deck
Unlock for access to all 48 flashcards in this deck.
Unlock Deck
k this deck
33
The root-mean-squared error (RMSE)is:
A) the proportion of the variation in the dependent variable that is explained by the regression.
B) the coefficient estimate divided by the standard error of the estimate.
C) an increasing function of the number of independent variables.
D) the square root of the coefficient of determination.
E) useful for constructing confidence intervals for estimates of the dependent variable.
Unlock Deck
Unlock for access to all 48 flashcards in this deck.
Unlock Deck
k this deck
34
The standard error of the estimate is also known as:
A) the root-mean-squared error.
B) the standard error of the coefficient estimate.
C) R-squared.
D) the t-ratio.
E) t-squared.
A) the root-mean-squared error.
B) the standard error of the coefficient estimate.
C) R-squared.
D) the t-ratio.
E) t-squared.
Unlock Deck
Unlock for access to all 48 flashcards in this deck.
Unlock Deck
k this deck
35
Multiple regression differs from simple regression in that:
A) there can be multiple dependent variables.
B) the time periods over which observations are taken are multiplied to increase explanatory power.
C) a simple regression is done multiple times to increase explanatory power.
D) the computational requirements are less.
E) there are multiple independent variables.
Unlock Deck
Unlock for access to all 48 flashcards in this deck.
Unlock Deck
k this deck
36
The first step in multiple regression analysis is to:
A) procure a powerful computer.
B) identify the important variables.
C) specify a functional form to be estimated.
D) gather all available data.
E) select an estimation procedure.
A) procure a powerful computer.
B) identify the important variables.
C) specify a functional form to be estimated.
D) gather all available data.
E) select an estimation procedure.
Unlock Deck
Unlock for access to all 48 flashcards in this deck.
Unlock Deck
k this deck
37
A regression of the mean daily high temperature as a function of mean daily low temperature across cities yielded High = 21 + Low,R2 = .98,and RMSE = 1.4.Interpret these results.
A) The regression says that if a city's average low temperature is 1 degree higher than some other city's, their average high temperatures are also likely to be 1 degree different. The high R2 and low RMSE are inconsistent and suggest a serial correlation problem.
B) The regression says that if a city's average low temperature is 10 degrees higher than some other city's, their average high temperatures are also likely to be 10 degrees different and that the average difference between average daily high temperatures and average daily low temperatures is 21 degrees. The model explains 98% of the variation in average daily high temperatures, and the standard error of the estimate is quite small.
C) The regression says that if a city's average low temperature is 1 degree higher than some other city's, their average high temperatures are also likely to be 1 degree different. The high R2 and low RMSE are inconsistent and suggest a multicollinearity problem.
D) The regression says that if a city's average low temperature is 10 degrees higher than some other city's, their average high temperatures are also likely to be 10 degrees different and that the average difference between average daily high temperatures and average daily low temperatures is 12 degrees. The regression explains all the variation in average daily high temperatures.
E) None of the above.
Unlock Deck
Unlock for access to all 48 flashcards in this deck.
Unlock Deck
k this deck
38
When the coefficient of determination is near 1 but the t-statistics are all insignificant,the regression likely suffers from:
A) nonconstant variance of the error terms.
B) multicollinearity.
C) serial correlation.
D) randomness.
E) nonidentifiability.
A) nonconstant variance of the error terms.
B) multicollinearity.
C) serial correlation.
D) randomness.
E) nonidentifiability.
Unlock Deck
Unlock for access to all 48 flashcards in this deck.
Unlock Deck
k this deck
39
The annual mean daily high and low temperatures by selected cities are given in the following table.If the mean low temperature is 1 degree higher in Tupelo than in Tucumcari,what do you estimate the difference in mean high temperatures will be?
A) 1.0 degree.
B) 1.25 degrees.
C) 0.75 degree.
D) 1.50 degrees.
E) 2.50 degrees.
A) 1.0 degree.
B) 1.25 degrees.
C) 0.75 degree.
D) 1.50 degrees.
E) 2.50 degrees.
Unlock Deck
Unlock for access to all 48 flashcards in this deck.
Unlock Deck
k this deck
40
Coal industry sales and profits are given in the following table.What is the intercept coefficient estimate a of the regression of profits as a function of sales?
A) 0.12.
B) 0.14.
C) 0.16.
D) 0.18.
E) 0.22.
A) 0.12.
B) 0.14.
C) 0.16.
D) 0.18.
E) 0.22.
Unlock Deck
Unlock for access to all 48 flashcards in this deck.
Unlock Deck
k this deck
41
The coefficient of determination from a regression represents the:
A) proportion of variation in the dependent variable explained by variation in the independent variables.
B) proportion of variation in the independent variables explained by variation in the dependent variable.
C) variation in the dependent variable.
D) proportion of the variation in the dependent variable.
E) proportion of the variation in the independent variable.
Unlock Deck
Unlock for access to all 48 flashcards in this deck.
Unlock Deck
k this deck
42
When the error terms are correlated across observations,one way to address the resulting econometric problem is to:
A) use weighted least squares.
B) use first differences rather than levels of the variables.
C) gather more data.
D) transform the independent variable.
E) eliminate covarying variables.
A) use weighted least squares.
B) use first differences rather than levels of the variables.
C) gather more data.
D) transform the independent variable.
E) eliminate covarying variables.
Unlock Deck
Unlock for access to all 48 flashcards in this deck.
Unlock Deck
k this deck
43
If the Durbin-Watson statistic is 2,we can conclude that:
A) there is no serial correlation.
B) the error terms have constant variances.
C) there is negative serial correlation.
D) there is positive serial correlation.
E) there is multicollinearity.
A) there is no serial correlation.
B) the error terms have constant variances.
C) there is negative serial correlation.
D) there is positive serial correlation.
E) there is multicollinearity.
Unlock Deck
Unlock for access to all 48 flashcards in this deck.
Unlock Deck
k this deck
44
If the Durbin-Watson statistic is near 4,we can conclude that there is:
A) positive serial correlation.
B) negative serial correlation.
C) no serial correlation.
D) a multicollinearity problem.
E) not enough data to estimate the regression.
A) positive serial correlation.
B) negative serial correlation.
C) no serial correlation.
D) a multicollinearity problem.
E) not enough data to estimate the regression.
Unlock Deck
Unlock for access to all 48 flashcards in this deck.
Unlock Deck
k this deck
45
The difference between the observed value of a dependent variable and the value we estimate using regression analysis is known as a(n):
A) aberration.
B) correlation.
C) dependent variable.
D) mistake.
E) residual.
A) aberration.
B) correlation.
C) dependent variable.
D) mistake.
E) residual.
Unlock Deck
Unlock for access to all 48 flashcards in this deck.
Unlock Deck
k this deck
46
The total variation in the dependent variable Y is:
A) (Yi - Ymean)2.
B) (Yi - Yestimated)2.
C) (Yi - Ymean)2 / (Yi - Yestimated)2.
D) (Yi - Yestimated)2 / (Yi - Ymean)2.
E) 1 - (Yi - Yestimated)2 / (Yi - Ymean)2.
A) (Yi - Ymean)2.
B) (Yi - Yestimated)2.
C) (Yi - Ymean)2 / (Yi - Yestimated)2.
D) (Yi - Yestimated)2 / (Yi - Ymean)2.
E) 1 - (Yi - Yestimated)2 / (Yi - Ymean)2.
Unlock Deck
Unlock for access to all 48 flashcards in this deck.
Unlock Deck
k this deck
47
If the Durbin-Watson statistic is near 0,we can conclude that there is:
A) positive serial correlation.
B) negative serial correlation.
C) no serial correlation.
D) a multicollinearity problem.
E) not enough data to estimate the regression.
A) positive serial correlation.
B) negative serial correlation.
C) no serial correlation.
D) a multicollinearity problem.
E) not enough data to estimate the regression.
Unlock Deck
Unlock for access to all 48 flashcards in this deck.
Unlock Deck
k this deck
48
The coefficient of determination,or R-squared,is defined as:
A) 1 - (Yi + Yestimated)2 / (Yi + Ymean)2.
B) 1 - (Yi - Yestimated)2 / (Yi - Ymean)2.
C) (Yi + Yestimated)2 / (Yi + Ymean)2.
D) 1 - (Yi - Yestimated) / (Yi - Ymean).
E) 1 - [ (Yi - Yestimated) / (Yi - Ymean)]2.
A) 1 - (Yi + Yestimated)2 / (Yi + Ymean)2.
B) 1 - (Yi - Yestimated)2 / (Yi - Ymean)2.
C) (Yi + Yestimated)2 / (Yi + Ymean)2.
D) 1 - (Yi - Yestimated) / (Yi - Ymean).
E) 1 - [ (Yi - Yestimated) / (Yi - Ymean)]2.
Unlock Deck
Unlock for access to all 48 flashcards in this deck.
Unlock Deck
k this deck
Unlock Deck
Unlock for access to all 48 flashcards in this deck.


