Deck 22: Growth of Populations
Full screen (f)
Question
Question
Question
Question
Question
Question
Question
Question
Question
Question
Question
Question
Question
Question
Question
Question
Question
Question
Question
Question
Question
The figure below shows that the human population was small and relatively stable for nearly 12,000 years, but has increased dramatically in the past 200 years. 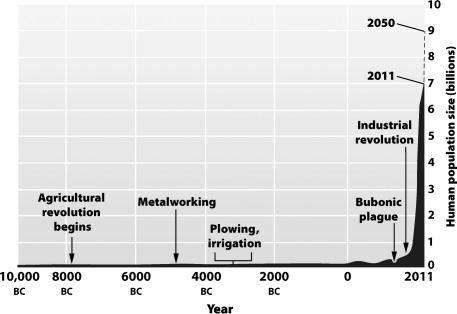
How might this increase in population growth be explained?
A)Disease prevented any significant growth of the human population.
B)For most of human history people were too malnourished to have children.
C)People simply chose to have fewer children in the past than at present.
D)Prior human populations were at existing carrying capacities but newly developed technologies have raised the carrying capacity and permitted the recent expansion.
Question
Question
The graph below shows the growth of a Paramecium population. 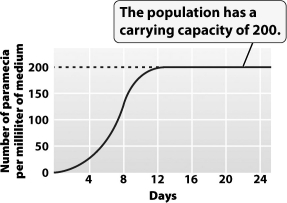
The greatest amount of daily growth occurred when the population was at approximately _____ percent of its carrying capacity
A)10
B)25
C)50
D)100
The greatest amount of daily growth occurred when the population was at approximately _____ percent of its carrying capacity
A)10
B)25
C)50
D)100
Question
Question
Examine the graph below. 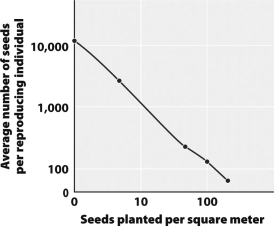
What statement best describes the relationship between planting density and seed production per individual plant?
A)At high planting densities, both seed production per plant and total seeds produced declines.
B)At high planting densities, seed production per plant declines while total seeds produced remains constant.
C)At low planting densities, both seed production per plant and total seeds produced increases.
D)At high planting densities, seed production per plant declines while total seeds produced increases.
Question
Question
Question
Question
Question
Question
Question
Question
Question
Question
Question
Question
Question
Question
Question
Question
Question
Question
Question
Question
Question
Question
Question
Question
Question
Question
Question
Question
Question
Question
Question
Question
Question
Question
Question
Question
Question
Question
Question
Question
Question
Question
Question
Question

Unlock Deck
Sign up to unlock the cards in this deck!
Unlock Deck
Unlock Deck
1/69
Play
Full screen (f)
Deck 22: Growth of Populations
1
Which of the following has the highest population density?
A)1 grasshopper living in an area of 10 square meters
B)100 rabbits living in an area of 10,000 square meters
C)200 sparrows living in an area of 20,000 square meters
D)1,500 oysters living in an area of 1,500 square meters
A)1 grasshopper living in an area of 10 square meters
B)100 rabbits living in an area of 10,000 square meters
C)200 sparrows living in an area of 20,000 square meters
D)1,500 oysters living in an area of 1,500 square meters
D
2
The term population density describes the
A)body size of different species.
B)number of individuals per unit area.
C)number of populations per unit area.
D)number of species per unit area.
A)body size of different species.
B)number of individuals per unit area.
C)number of populations per unit area.
D)number of species per unit area.
B
3
Which of the following populations would be most vulnerable to an outbreak of disease?
A)10 grasshoppers living in an area of 100 square meters
B)100 rabbits living in an area of 10,000 square meters
C)200 sparrows living in an area of 20,000 square meters
D)250,000 people living in an area of 100,000 square meters
A)10 grasshoppers living in an area of 100 square meters
B)100 rabbits living in an area of 10,000 square meters
C)200 sparrows living in an area of 20,000 square meters
D)250,000 people living in an area of 100,000 square meters
D
4
A new species is introduced into a given area. The population size begins to grow slowly, then at a very rapid rate, and finally levels off at a stable number. This growth pattern is best represented by a(n)
A)oscillating cycle.
B)J-shaped population curve.
C)A-shaped population curve.
D)S-shaped population curve.
A)oscillating cycle.
B)J-shaped population curve.
C)A-shaped population curve.
D)S-shaped population curve.
Unlock Deck
Unlock for access to all 69 flashcards in this deck.
Unlock Deck
k this deck
5
The decrease in the availability of food or cover that accompanies increasing population size illustrates the concept of a(n)
A)density-dependent factor.
B)density-independent factor.
C)emigration-related factor.
D)high carrying capacity factor.
A)density-dependent factor.
B)density-independent factor.
C)emigration-related factor.
D)high carrying capacity factor.
Unlock Deck
Unlock for access to all 69 flashcards in this deck.
Unlock Deck
k this deck
6
The population explosion that occurred shortly after the Opuntia cactus was introduced to Australia is an example of
A)exponential growth.
B)emigration.
C)reduced population density.
D)a native species outcompeting an introduced species.
A)exponential growth.
B)emigration.
C)reduced population density.
D)a native species outcompeting an introduced species.
Unlock Deck
Unlock for access to all 69 flashcards in this deck.
Unlock Deck
k this deck
7
Which of the following populations would be most likely to experience an S-shaped growth pattern?
A)all of the animals in the San Diego Zoo
B)Gause's Paramecia without a constant food supply
C)a founding colony of rats on a small island with abundant resources
D)a beehive infected midsummer with a deadly bacterial disease
A)all of the animals in the San Diego Zoo
B)Gause's Paramecia without a constant food supply
C)a founding colony of rats on a small island with abundant resources
D)a beehive infected midsummer with a deadly bacterial disease
Unlock Deck
Unlock for access to all 69 flashcards in this deck.
Unlock Deck
k this deck
8
The change in size of a given population of organisms may have a direct impact on humans. The 1993 outbreak of hantavirus in the southwestern United States was partly due to a(n)
A)tightly linked cycle of human and hantavirus populations.
B)increase in the deer mouse population size.
C)decline in the desert salamander population, the normal hantavirus host.
D)increase in human population size.
A)tightly linked cycle of human and hantavirus populations.
B)increase in the deer mouse population size.
C)decline in the desert salamander population, the normal hantavirus host.
D)increase in human population size.
Unlock Deck
Unlock for access to all 69 flashcards in this deck.
Unlock Deck
k this deck
9
Which of the following choices best explains why some introduced species experience an initial period of exponential growth?
A)They do not yet have any natural predators in their new habitat.
B)Most introduced species show better survival in new habitats than in their old ones.
C)Because most native species display exponential growth, many introduced species will do so also.
D)Native species always leave open habitat types that a new species can inhabit.
Unlock Deck
Unlock for access to all 69 flashcards in this deck.
Unlock Deck
k this deck
10
A population of 100 individuals has a doubling time of 25 years. What size will this population be in 100 years?
A)100
B)400
C)800
D)1,600
A)100
B)400
C)800
D)1,600
Unlock Deck
Unlock for access to all 69 flashcards in this deck.
Unlock Deck
k this deck
11
The human population crash that occurred on Easter Island was due to
A)fire.
B)expanding forests and the consequent loss of farmland.
C)the aftermath of a volcanic eruption.
D)deforestation, soil erosion, and resource depletion.
A)fire.
B)expanding forests and the consequent loss of farmland.
C)the aftermath of a volcanic eruption.
D)deforestation, soil erosion, and resource depletion.
Unlock Deck
Unlock for access to all 69 flashcards in this deck.
Unlock Deck
k this deck
12
The maximum population size that can be supported by its habitat is known as
A)maximum increase.
B)carrying capacity.
C)exponential growth.
D)population balance.
A)maximum increase.
B)carrying capacity.
C)exponential growth.
D)population balance.
Unlock Deck
Unlock for access to all 69 flashcards in this deck.
Unlock Deck
k this deck
13
Nene, the Hawaiian goose, live on Maui. Their population density is 0.164 per square kilometer. Maui is 1,830 square kilometers in size. Approximately how many nene live on Maui?
A)16
B)150
C)300
D)11,600
A)16
B)150
C)300
D)11,600
Unlock Deck
Unlock for access to all 69 flashcards in this deck.
Unlock Deck
k this deck
14
Which of the following has the smallest contribution to annual changes in the size of a population?
A)weather
B)predators
C)climate
D)disease
A)weather
B)predators
C)climate
D)disease
Unlock Deck
Unlock for access to all 69 flashcards in this deck.
Unlock Deck
k this deck
15
A population is counted at 100 individuals in 1998. In 2006, a new count found 1,600 individuals. What is the doubling time for the population?
A)0.5 year
B)1 year
C)1.5 years
D)2 years
A)0.5 year
B)1 year
C)1.5 years
D)2 years
Unlock Deck
Unlock for access to all 69 flashcards in this deck.
Unlock Deck
k this deck
16
A population of 100 individuals is undergoing exponential growth, with a constant growth rate of 0.2 per year. What size will this population be in 2 years?
A)100
B)120
C)144
D)200
A)100
B)120
C)144
D)200
Unlock Deck
Unlock for access to all 69 flashcards in this deck.
Unlock Deck
k this deck
17
The size of a population can be decreased by
A)a higher birth rate.
B)immigration.
C)emigration.
D)a reduced death rate.
A)a higher birth rate.
B)immigration.
C)emigration.
D)a reduced death rate.
Unlock Deck
Unlock for access to all 69 flashcards in this deck.
Unlock Deck
k this deck
18
The definition of an area, relative to a population study,
A)is constant.
B)is always 1 square meter.
C)depends on the questions being asked.
D)depends on whether the area is terrestrial or aquatic.
A)is constant.
B)is always 1 square meter.
C)depends on the questions being asked.
D)depends on whether the area is terrestrial or aquatic.
Unlock Deck
Unlock for access to all 69 flashcards in this deck.
Unlock Deck
k this deck
19
One herd of elephants (Herd A)has 100 individuals and a growth rate of 1.5. Another herd (Herd B)has 200 individuals and a growth rate of .7. Herd C has a population of 75 and a growth rate of 2. Herd D has a population of 50 and a growth rate of 4. Assuming no other factors are involved, which herd will be largest next year?
A)Herd A
B)Herd B
C)Herd C
D)Herd D
A)Herd A
B)Herd B
C)Herd C
D)Herd D
Unlock Deck
Unlock for access to all 69 flashcards in this deck.
Unlock Deck
k this deck
20
A population will remain at a constant size when emigration equals immigration and
A)food is not a limiting factor.
B)births equal deaths.
C)predators leave the area.
D)available space remains the same.
A)food is not a limiting factor.
B)births equal deaths.
C)predators leave the area.
D)available space remains the same.
Unlock Deck
Unlock for access to all 69 flashcards in this deck.
Unlock Deck
k this deck
21
The figure below shows that the human population was small and relatively stable for nearly 12,000 years, but has increased dramatically in the past 200 years.
How might this increase in population growth be explained?
A)Disease prevented any significant growth of the human population.
B)For most of human history people were too malnourished to have children.
C)People simply chose to have fewer children in the past than at present.
D)Prior human populations were at existing carrying capacities but newly developed technologies have raised the carrying capacity and permitted the recent expansion.
Unlock Deck
Unlock for access to all 69 flashcards in this deck.
Unlock Deck
k this deck
22
For most populations, irregular fluctuations in size or density
A)are less commonly experienced than the smooth J-shaped growth curve.
B)occur commonly before carrying capacity is reached.
C)are more common than the smooth J-shaped growth curve.
D)occur only when density-independent factors dominate.
A)are less commonly experienced than the smooth J-shaped growth curve.
B)occur commonly before carrying capacity is reached.
C)are more common than the smooth J-shaped growth curve.
D)occur only when density-independent factors dominate.
Unlock Deck
Unlock for access to all 69 flashcards in this deck.
Unlock Deck
k this deck
23
The graph below shows the growth of a Paramecium population.
The greatest amount of daily growth occurred when the population was at approximately _____ percent of its carrying capacity
A)10
B)25
C)50
D)100
The greatest amount of daily growth occurred when the population was at approximately _____ percent of its carrying capacity
A)10
B)25
C)50
D)100
Unlock Deck
Unlock for access to all 69 flashcards in this deck.
Unlock Deck
k this deck
24
Studies of the population-size cycles seen between the snowshoe hare and the Canadian lynx showed that
A)lynx populations decrease in size when hare populations increase in size.
B)lynx populations increase in size when hare populations decrease in size.
C)lynx populations decrease in size when hare populations decrease in size.
D)There is no relationship between population sizes of snowshoe hare and Canadian lynx.
Unlock Deck
Unlock for access to all 69 flashcards in this deck.
Unlock Deck
k this deck
25
Examine the graph below.
What statement best describes the relationship between planting density and seed production per individual plant?
A)At high planting densities, both seed production per plant and total seeds produced declines.
B)At high planting densities, seed production per plant declines while total seeds produced remains constant.
C)At low planting densities, both seed production per plant and total seeds produced increases.
D)At high planting densities, seed production per plant declines while total seeds produced increases.
Unlock Deck
Unlock for access to all 69 flashcards in this deck.
Unlock Deck
k this deck
26
Which of the following situations illustrates a link between the effects of density-dependent and density-independent factors?
A)A flood causes a river to overflow and drown a herd of deer.
B)A drought occurs; a small herd of deer is able to survive, whereas a larger herd in the same area perishes.
C)A population of deer increases to a size at which individuals are competing with each other to get enough food.
D)None of the above are correct because density-dependent and density-independent factors cannot affect the same population of organisms at the same time.
Unlock Deck
Unlock for access to all 69 flashcards in this deck.
Unlock Deck
k this deck
27
The carrying capacity of owls in an Alaskan forest is 8 per square kilometer. What will happen if 12 owls are confined to a 1-square-kilometer area?
A)The owls will survive together and develop ways to share resources.
B)The owls might survive as malnourished adults but the next generation will have no more than eight individuals.
C)The population of owl prey organisms will increase proportionately.
D)A short-term exponential growth of owls will occur.
Unlock Deck
Unlock for access to all 69 flashcards in this deck.
Unlock Deck
k this deck
28
The top of the "S"in an S-shaped curve indicates that the population
A)is on the verge of collapse.
B)is experiencing abnormally heavy pressure from predators.
C)has reached its carrying capacity.
D)is poised for further exponential growth.
A)is on the verge of collapse.
B)is experiencing abnormally heavy pressure from predators.
C)has reached its carrying capacity.
D)is poised for further exponential growth.
Unlock Deck
Unlock for access to all 69 flashcards in this deck.
Unlock Deck
k this deck
29
The amount of productive land and water that individuals or populations require to provide their required resources and dispose of its wastes is called the
A)sustainable area.
B)ecological footprint.
C)biological acreage.
D)environmental measure.
A)sustainable area.
B)ecological footprint.
C)biological acreage.
D)environmental measure.
Unlock Deck
Unlock for access to all 69 flashcards in this deck.
Unlock Deck
k this deck
30
In computing an individual's ecological footprint, which of the following would not be included?
A)energy demand
B)food use
C)goods and services use
D)education level
A)energy demand
B)food use
C)goods and services use
D)education level
Unlock Deck
Unlock for access to all 69 flashcards in this deck.
Unlock Deck
k this deck
31
The effects of pollution are generally considered to be density-independent because
A)the contamination level of any organism is unaffected by variations in population density.
B)when food supplies become limited, the organisms are more likely to consume contaminated foods.
C)at high densities the organisms are more likely to contact the pollutant.
D)when the organisms are stressed by overcrowding, the pollutant becomes more toxic.
Unlock Deck
Unlock for access to all 69 flashcards in this deck.
Unlock Deck
k this deck
32
When an isolated population reaches its carrying capacity
A)the birth rate > the death rate.
B)the birth rate = the death rate.
C)the birth rate < the death rate.
D)It is not possible to generalize these values.
A)the birth rate > the death rate.
B)the birth rate = the death rate.
C)the birth rate < the death rate.
D)It is not possible to generalize these values.
Unlock Deck
Unlock for access to all 69 flashcards in this deck.
Unlock Deck
k this deck
33
In 1978, a drought on the Galapagos Islands caused a reduction in the production of seeds that one of Darwin's finches, a kind of bird, fed upon. This caused a decrease from 1,400 to 200 birds. This population change factor
A)would not be not considered a part of the carrying capacity for these birds.
B)was density-dependent.
C)was density-independent.
D)resulted in exponential growth for the bird population.
A)would not be not considered a part of the carrying capacity for these birds.
B)was density-dependent.
C)was density-independent.
D)resulted in exponential growth for the bird population.
Unlock Deck
Unlock for access to all 69 flashcards in this deck.
Unlock Deck
k this deck
34
What was the effect of the pesticide DDT on bald eagles?
A)They lost the ability to fly.
B)The animals they ate as prey were killed by the DDT.
C)Their eggs were fragile, breaking before the chicks could fully develop.
D)The trees they lived in were killed by the DDT.
A)They lost the ability to fly.
B)The animals they ate as prey were killed by the DDT.
C)Their eggs were fragile, breaking before the chicks could fully develop.
D)The trees they lived in were killed by the DDT.
Unlock Deck
Unlock for access to all 69 flashcards in this deck.
Unlock Deck
k this deck
35
The Rapanui people created an environmental disaster on Easter Island by
A)planting crops that required too much water.
B)overfishing the lagoons around the island.
C)cutting down too many of the island's palm trees.
D)using resources to make statues instead of using these resources as fertilizer.
A)planting crops that required too much water.
B)overfishing the lagoons around the island.
C)cutting down too many of the island's palm trees.
D)using resources to make statues instead of using these resources as fertilizer.
Unlock Deck
Unlock for access to all 69 flashcards in this deck.
Unlock Deck
k this deck
36
Is it reasonable to expect that all habitats suitable for a given organism will have the same carrying capacity for that organism?
A)Yes; unless the carrying capacities are the same, the habitat would not be suitable.
B)Yes; the carrying capacity is determined solely by the type of organism being considered.
C)No; an organism may be able to live in many locations, but the resources it requires may be available in varying amounts.
D)No; it is not possible for two habitats to have the same carrying capacity.
Unlock Deck
Unlock for access to all 69 flashcards in this deck.
Unlock Deck
k this deck
37
Under the one-child policy, China's population is expected to peak and then decline in the year
A)2020.
B)2030.
C)2050.
D)2075.
A)2020.
B)2030.
C)2050.
D)2075.
Unlock Deck
Unlock for access to all 69 flashcards in this deck.
Unlock Deck
k this deck
38
Lynx feed on rabbits, and the growth curves for these two species fluctuate together. This relationship is an example of a(n)
A)S-shaped growth curve.
B)J-shaped growth curve.
C)irregular fluctuation.
D)tightly linked cycle.
A)S-shaped growth curve.
B)J-shaped growth curve.
C)irregular fluctuation.
D)tightly linked cycle.
Unlock Deck
Unlock for access to all 69 flashcards in this deck.
Unlock Deck
k this deck
39
Which of the following statements about carrying capacity is true?
A)An S-shaped curve represents a population's ability to increase its numbers above the carrying capacity of its habitat.
B)J-shaped curves show the immediate limiting effect of carrying capacity on a newly introduced organism.
C)The carrying capacity is the same for all organisms in the same area.
D)The carrying capacity is established by the factor with the most limited availability.
Unlock Deck
Unlock for access to all 69 flashcards in this deck.
Unlock Deck
k this deck
40
Density-dependent factors are more likely to limit population growth when
A)there are more individuals living in the same amount of space.
B)the population moves into a larger habitat.
C)food is abundant.
D)weather conditions become milder.
A)there are more individuals living in the same amount of space.
B)the population moves into a larger habitat.
C)food is abundant.
D)weather conditions become milder.
Unlock Deck
Unlock for access to all 69 flashcards in this deck.
Unlock Deck
k this deck
41
A(n)____________________ is a group of interacting individuals of the same species living within the same area.
Unlock Deck
Unlock for access to all 69 flashcards in this deck.
Unlock Deck
k this deck
42
China's ____________________ policy has slowed the growth of the population in that country to 0.57 percent currently from 1.07 percent during the 1990s.
Unlock Deck
Unlock for access to all 69 flashcards in this deck.
Unlock Deck
k this deck
43
A(n)____________________-shaped curve describes population growth that occurs when a population grows exponentially.
Unlock Deck
Unlock for access to all 69 flashcards in this deck.
Unlock Deck
k this deck
44
____________________ growth occurs when the population size increases by a constant proportion from one generation to the next.
Unlock Deck
Unlock for access to all 69 flashcards in this deck.
Unlock Deck
k this deck
45
When an S-shaped growth curve levels it is an indication that a population may have reached its carrying capacity.
Unlock Deck
Unlock for access to all 69 flashcards in this deck.
Unlock Deck
k this deck
46
A population can increase in size indefinitely.
Unlock Deck
Unlock for access to all 69 flashcards in this deck.
Unlock Deck
k this deck
47
A population grows as more of its individuals emigrate.
Unlock Deck
Unlock for access to all 69 flashcards in this deck.
Unlock Deck
k this deck
48
Overall, when there are more individuals in a population, birth rates ____________________.
Unlock Deck
Unlock for access to all 69 flashcards in this deck.
Unlock Deck
k this deck
49
Food shortages and communicable disease are examples of factors that would ____________________ a population's growth rate.
Unlock Deck
Unlock for access to all 69 flashcards in this deck.
Unlock Deck
k this deck
50
By imposing the one-child policy, China's government is attempting to manipulate which of the following factors?
A)N
B)l
C)carrying capacity
D)food supply
A)N
B)l
C)carrying capacity
D)food supply
Unlock Deck
Unlock for access to all 69 flashcards in this deck.
Unlock Deck
k this deck
51
At room temperature, a population of dangerous bacteria on a piece of raw chicken increases from 100,000 to 400,000 in 40 minutes. Its doubling time is ____________________ minutes.
Unlock Deck
Unlock for access to all 69 flashcards in this deck.
Unlock Deck
k this deck
52
Population size ____________________ when the combination of death and emigration rates are lower than the combination of birth and immigration rates.
Unlock Deck
Unlock for access to all 69 flashcards in this deck.
Unlock Deck
k this deck
53
In natural systems, populations do not change in size when birth + immigration = death + emigration.
Unlock Deck
Unlock for access to all 69 flashcards in this deck.
Unlock Deck
k this deck
54
Weather is a density-____________________ factor that can affect the size of a population.
Unlock Deck
Unlock for access to all 69 flashcards in this deck.
Unlock Deck
k this deck
55
Exponential growth curves are always J-shaped.
Unlock Deck
Unlock for access to all 69 flashcards in this deck.
Unlock Deck
k this deck
56
If there are 100 people living in a 2-square-kilometer area, the population density is ____________________ people per square kilometer.
Unlock Deck
Unlock for access to all 69 flashcards in this deck.
Unlock Deck
k this deck
57
If we humans do not limit our population growth rate, we will exceed the ____________________ of our environment, leading to a larger population than the environment can support.
Unlock Deck
Unlock for access to all 69 flashcards in this deck.
Unlock Deck
k this deck
58
Populations generally change in size over time.
Unlock Deck
Unlock for access to all 69 flashcards in this deck.
Unlock Deck
k this deck
59
One measure of population growth is the period in which a population increases to twice its size. This is referred to as the ____________________ of the population.
Unlock Deck
Unlock for access to all 69 flashcards in this deck.
Unlock Deck
k this deck
60
Use of the environment that can continue indefinitely without depleting all our resources or causing environmental damage is defined as being ____________________.
Unlock Deck
Unlock for access to all 69 flashcards in this deck.
Unlock Deck
k this deck
61
If humans reduced the current growth rate to 2.1, the replacement level, today, the human population would stop growing within just 5 years.
Unlock Deck
Unlock for access to all 69 flashcards in this deck.
Unlock Deck
k this deck
62
Pollution is one of the many density-dependent factors that limit population growth.
Unlock Deck
Unlock for access to all 69 flashcards in this deck.
Unlock Deck
k this deck
63
The ecological footprint of a typical college student in the United States is about the same as a typical college student at a university in China.
Unlock Deck
Unlock for access to all 69 flashcards in this deck.
Unlock Deck
k this deck
64
Natural disasters can limit population growth in ways not related to population density.
Unlock Deck
Unlock for access to all 69 flashcards in this deck.
Unlock Deck
k this deck
65
Humans are the only species not subject to limits on the size of its population.
Unlock Deck
Unlock for access to all 69 flashcards in this deck.
Unlock Deck
k this deck
66
One of the consequences of China's one-child policy is that the proportion of older adults in the population is growing.
Unlock Deck
Unlock for access to all 69 flashcards in this deck.
Unlock Deck
k this deck
67
The carrying capacity of a population can be affected by weather.
Unlock Deck
Unlock for access to all 69 flashcards in this deck.
Unlock Deck
k this deck
68
The carrying capacity of a habitat always remains the same.
Unlock Deck
Unlock for access to all 69 flashcards in this deck.
Unlock Deck
k this deck
69
The approximate number of humans on Earth in 2012 is 7 billion.
Unlock Deck
Unlock for access to all 69 flashcards in this deck.
Unlock Deck
k this deck
Unlock Deck
Unlock for access to all 69 flashcards in this deck.


