Deck 8: Trade
Full screen (f)
Question
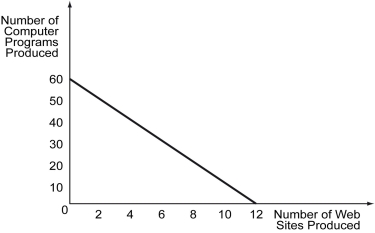
The following figure shows the production possibilities curve for a software engineer who has to divide her available time between producing computer programs and Web sites.
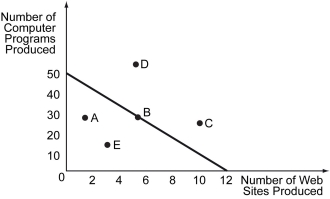
Refer to the figure above.If the engineer spends her entire time producing computer programs,how many computer programs can she produce?
A) 12
B) 30
C) 45
D) 50
Refer to the figure above.If the engineer spends her entire time producing computer programs,how many computer programs can she produce?
A) 12
B) 30
C) 45
D) 50
Question
Question
Question
Question
Question
The following figure shows the production possibilities curve for a software engineer who has to divide her available time between producing computer programs and Web sites.
Refer to the figure above.Which of the following combinations is unattainable?
A) A
B) B
C) D
D) E
Refer to the figure above.Which of the following combinations is unattainable?
A) A
B) B
C) D
D) E
Question
Question
Question
Question
The following figure shows the production possibilities curve for a software engineer who has to divide her available time between producing computer programs and Web sites.
Refer to the figure above.Which of the following combinations is attainable but inefficient?
A) A
B) B
C) C
D) D
Refer to the figure above.Which of the following combinations is attainable but inefficient?
A) A
B) B
C) C
D) D
Question
Question
Question
The following figure shows the production possibilities curve for a software engineer who has to divide her available time between producing computer programs and Web sites.
Refer to the figure above.If the engineer spends her entire time on producing Web sites,how many Web sites can she produce?
A) 2
B) 5
C) 10
D) 12
Refer to the figure above.If the engineer spends her entire time on producing Web sites,how many Web sites can she produce?
A) 2
B) 5
C) 10
D) 12
Question
Question
Question
Question
Question
Question
Question
The following figure shows the production possibilities curve for a software engineer who has to divide her available time between producing computer programs and Web sites.
Refer to the figure above.Which of the following combinations is attainable as well as efficient?
A) B
B) C
C) D
D) E
Refer to the figure above.Which of the following combinations is attainable as well as efficient?
A) B
B) C
C) D
D) E
Question
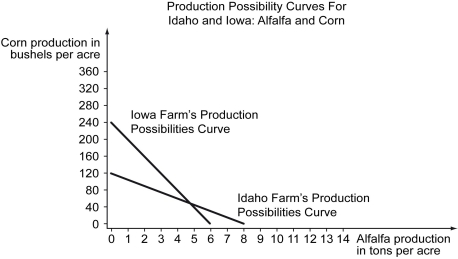
Scenario: The following production possibilities schedules and curves represent the amount of corn and alfalfa that can be produced on an acre of land in Idaho and Iowa.
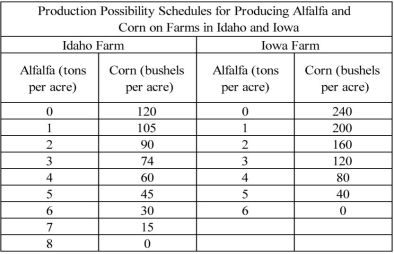
These production possibilities schedules are shown in the following figure.
Refer to the scenario above.The opportunity cost of a ton of alfalfa in Idaho is ________.
A) of a bushel of corn
B) 1 bushel of corn
C) 15 bushels of corn
D) 120 bushels of corn
These production possibilities schedules are shown in the following figure.
Refer to the scenario above.The opportunity cost of a ton of alfalfa in Idaho is ________.
A)
of a bushel of cornB) 1 bushel of corn
C) 15 bushels of corn
D) 120 bushels of corn
Question
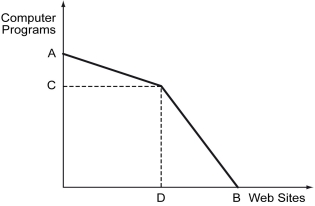
The following figure depicts a nonlinear production possibilities curve.
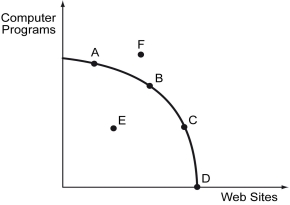
Refer to the figure above.If the market economy moves from point A to point C,________.
A) there is unemployment in the computer programs industry
B) the opportunity cost of producing an additional Web site increases
C) technological change has made the production of Web sites more efficient
D) society values Web sites more than computer programs
Question
The following figure depicts a nonlinear production possibilities curve.
Refer to the figure above.With currently available resources,point F represents a situation that ________.
A) results if resources are not fully employed
B) can be achieved if consumers demand fewer Web sites than at point C
C) is currently attainable, given available resources
D) is currently unattainable, given available resources
Question
Question
Question
Question
Question
Scenario: The following production possibilities schedules and curves represent the amount of corn and alfalfa that can be produced on an acre of land in Idaho and Iowa.
These production possibilities schedules are shown in the following figure.
Refer to the scenario above.The opportunity cost of a bushel of corn in Iowa is ________.
A) of a ton of alfalfa
B) 1 ton of alfalfa
C) 6 tons of alfalfa
D) 40 tons of alfalfa
These production possibilities schedules are shown in the following figure.
Refer to the scenario above.The opportunity cost of a bushel of corn in Iowa is ________.
A)
of a ton of alfalfaB) 1 ton of alfalfa
C) 6 tons of alfalfa
D) 40 tons of alfalfa
Question
Question
Question
Question
The following figure depicts a nonlinear production possibilities curve.
Refer to the figure above.Assuming that the initial situation is point B,which one of the following represents a reallocation of resources away from Web sites to computer programs production?
A) Point A
B) Point C
C) Point D
D) Point E
Refer to the figure above.Assuming that the initial situation is point B,which one of the following represents a reallocation of resources away from Web sites to computer programs production?
A) Point A
B) Point C
C) Point D
D) Point E
Question
Question
Question
Question
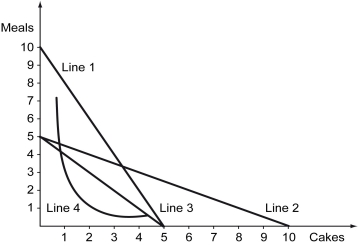
Christine is a chef.She can cook a meal in 1 hour and make a cake in 2 hours.She works 10 hours per day.Which of the four lines in the following figure represents her production possibilities curve?
A) Line 1
B) Line 2
C) Line 3
D) Line 4
A) Line 1
B) Line 2
C) Line 3
D) Line 4
Question
The following figure depicts a nonlinear production possibilities curve.
Refer to the figure above.Point E represents a situation that ________.
A) is currently unattainable and can be expected to remain so
B) will be attainable only if there is economic growth
C) results from inefficient use of resources or failure to use all available resources
D) has a higher opportunity cost than do points on the boundary itself
Question
Question
Assume that a machine is used to produce calculators and cell phones.The machine can be used for a maximum of 10 hours.The productivity table of the machine is shown below.
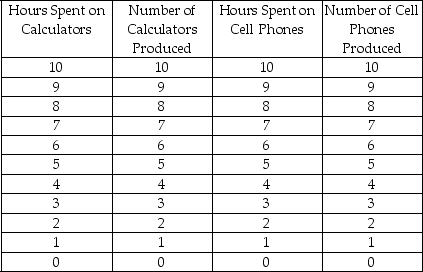
a)Draw the production possibilities curve from the information given in the table.
b)Calculate the opportunity cost of producing either good.
a)Draw the production possibilities curve from the information given in the table.
b)Calculate the opportunity cost of producing either good.
Question
Question
Question
Question
Question
Alexander Selkirk lives on Juan Fernandez Island.He spends his days gathering coconuts and spiny lobsters.If he spends all day gathering coconuts,he can collect 40 coconuts.If he spends all day collecting spiny lobsters,he can capture 20 in a day.His production possibilities curve is shown in the figure below.
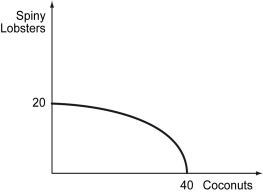
As Selkirk collects more coconuts,the opportunity cost of a coconut is ________.
A) decreasing
B) constant
C) increasing
D) unpredictable
As Selkirk collects more coconuts,the opportunity cost of a coconut is ________.
A) decreasing
B) constant
C) increasing
D) unpredictable
Question
The following figure shows the production possibilities curve for Sheena, who has to split her time between producing Web sites and computer programs.
Refer to the figure above.What is the opportunity cost of producing 1 Web site?
A) 0.2 computer programs
B) 5 computer programs
C) 12 computer programs
D) 60 computer programs
Refer to the figure above.What is the opportunity cost of producing 1 Web site?
A) 0.2 computer programs
B) 5 computer programs
C) 12 computer programs
D) 60 computer programs
Question
Question
Question
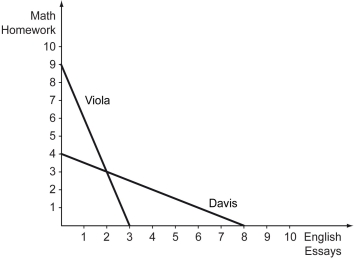
Scenario: Viola and Davis are two students who are taking a math class and an English class. The graph below shows the production possibilities curves for each of them.
Refer to the scenario above.What is the opportunity cost of one math homework assignment for Viola?
A) 9 English essays
B) 3 English essays
C) 0.5 English essays
D) 0.33 English essays
Refer to the scenario above.What is the opportunity cost of one math homework assignment for Viola?
A) 9 English essays
B) 3 English essays
C) 0.5 English essays
D) 0.33 English essays
Question
Question
Question
Question
Scenario: Viola and Davis are two students who are taking a math class and an English class. The graph below shows the production possibilities curves for each of them.
Refer to the scenario above.What is the opportunity cost of one English essay for Viola?
A) 9 math homework assignments
B) 3 math homework assignments
C) 0.5 math homework assignments
D) 0.33 math homework assignments
Refer to the scenario above.What is the opportunity cost of one English essay for Viola?
A) 9 math homework assignments
B) 3 math homework assignments
C) 0.5 math homework assignments
D) 0.33 math homework assignments
Question
Question
The following figure illustrates the production possibilities curve of a farmer who has to decide on the quantities of wheat and rice to produce for a given amount of resources.Three possible production combinations-A,B,and C-are marked on the figure.
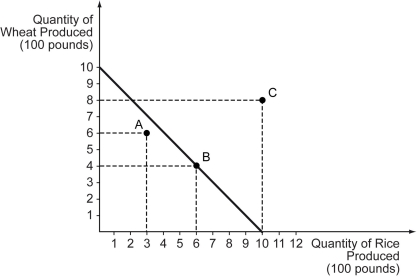
a)Which of the three combinations of wheat and rice,marked on the graph,is both efficient and attainable? Explain your answer.
b)Calculate the opportunity cost of producing both wheat and rice.
a)Which of the three combinations of wheat and rice,marked on the graph,is both efficient and attainable? Explain your answer.
b)Calculate the opportunity cost of producing both wheat and rice.
Question
Question
Scenario: Viola and Davis are two students who are taking a math class and an English class. The graph below shows the production possibilities curves for each of them.
Refer to the scenario above.Davis has a ________ opportunity cost of doing math homework assignments and a ________ opportunity cost of writing English essays compared to Viola.
A) lower; higher
B) higher; higher
C) lower; lower
D) higher; lower
Refer to the scenario above.Davis has a ________ opportunity cost of doing math homework assignments and a ________ opportunity cost of writing English essays compared to Viola.
A) lower; higher
B) higher; higher
C) lower; lower
D) higher; lower
Question
Question
The following figure shows the production possibilities curve for Sheena, who has to split her time between producing Web sites and computer programs.
Refer to the figure above.What is the opportunity cost of producing 1 computer program?
A) 0.2 Web sites
B) 5 Web sites
C) 8 Web sites
D) 12 Web sites
Refer to the figure above.What is the opportunity cost of producing 1 computer program?
A) 0.2 Web sites
B) 5 Web sites
C) 8 Web sites
D) 12 Web sites
Question
Question
Question
Question
The following figure depicts the production possibilities curve when Ann and Bob engage in trade. With all her resources, Ann can either produce two computer programs or one Web site. With all his resources, Bob can either produce one computer program or three Web sites.
Refer to the figure above.What is the value of A?
A) 1
B) 2
C) 3
D) 4
Refer to the figure above.What is the value of A?
A) 1
B) 2
C) 3
D) 4
Question
The following figure depicts the production possibilities curve when Ann and Bob engage in trade. With all her resources, Ann can either produce two computer programs or one Web site. With all his resources, Bob can either produce one computer program or three Web sites.
Refer to the figure above.The flatter portion of this curve has a slope equal to ________.
A) Ann's PPC
B) Bob's PPC
C) Ann's minus Bob's PPC
D) Ann's plus Bob's PPC
Refer to the figure above.The flatter portion of this curve has a slope equal to ________.
A) Ann's PPC
B) Bob's PPC
C) Ann's minus Bob's PPC
D) Ann's plus Bob's PPC
Question
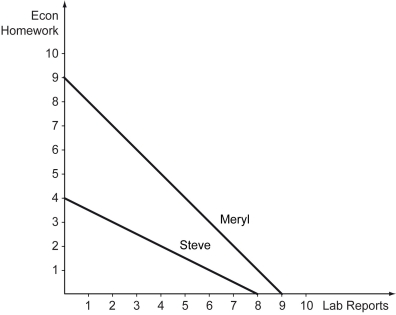
Scenario: Meryl and Steve are two classmates who form a study group. The graph below shows the production possibilities curves for each of them.
Refer to the scenario above.________ has comparative advantage in doing math homework,and ________ has comparative advantage in writing Econ essays.
A) Meryl; Meryl
B) Steve; Steve
C) Steve; Meryl
D) Meryl; Steve
Refer to the scenario above.________ has comparative advantage in doing math homework,and ________ has comparative advantage in writing Econ essays.
A) Meryl; Meryl
B) Steve; Steve
C) Steve; Meryl
D) Meryl; Steve
Question
The following figure shows the production possibilities curves (PPCs) of two individuals, Ryan and Tom.
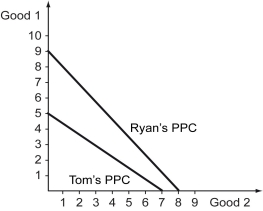
Refer to the figure above.Which of the following statements is true?
A) Ryan's opportunity cost of producing Good 1 is higher than that of Tom, whereas Tom's opportunity cost of producing Good 2 is higher than that of Ryan.
B) Ryan's opportunity cost of producing Good 2 is higher than Tom's opportunity cost of producing it.
C) Ryan has a comparative disadvantage in the production of both goods.
D) Tom has a comparative disadvantage in the production of both goods.
Question
Question
The following figure depicts the production possibilities curve when Ann and Bob engage in trade. With all her resources, Ann can either produce two computer programs or one Web site. With all his resources, Bob can either produce one computer program or three Web sites.
Refer to the figure above.What is the value of B?
A) 1
B) 2
C) 3
D) 4
Refer to the figure above.What is the value of B?
A) 1
B) 2
C) 3
D) 4
Question
Question
Scenario: Meryl and Steve are two classmates who form a study group. The graph below shows the production possibilities curves for each of them.
Refer to the scenario above.If Meryl and Steve decide to join forces to do school work and trade,then ________.
A) Meryl should specialize in doing Econ homework assignments, and Steve should specialize in writing lab reports
B) Steve should specialize in doing Econ homework assignments, and Meryl should specialize in writing lab reports
C) Meryl should do half the Econ homework assignments and write half the lab reports, and Steve should do the same
D) Meryl should do ¾ of the Econ homework assignments and ¼ of the lab reports, and Steve should complete the rest
Question
Question
The following figure depicts the production possibilities curve when Ann and Bob engage in trade. With all her resources, Ann can either produce two computer programs or one Web site. With all his resources, Bob can either produce one computer program or three Web sites.
Refer to the figure above.What should be the values of C and D?
A) C = 3, D = 4
B) C = 4, D = 3
C) C = 1, D = 1
D) C = 2, D = 3
Refer to the figure above.What should be the values of C and D?
A) C = 3, D = 4
B) C = 4, D = 3
C) C = 1, D = 1
D) C = 2, D = 3
Question
Scenario: Meryl and Steve are two classmates who form a study group. The graph below shows the production possibilities curves for each of them.
Refer to the scenario above.________ has absolute advantage in doing Econ homework assignments,and ________ has absolute advantage in writing lab reports.
A) Meryl; Meryl
B) Steve; Steve
C) Steve; Meryl
D) Meryl; Steve
Refer to the scenario above.________ has absolute advantage in doing Econ homework assignments,and ________ has absolute advantage in writing lab reports.
A) Meryl; Meryl
B) Steve; Steve
C) Steve; Meryl
D) Meryl; Steve
Question
Question
The following figure shows the production possibilities curves (PPCs) of two individuals, Ryan and Tom.

Refer to the figure above.Which of the following statements is true?
A) Tom has an absolute disadvantage in the production of Good 1, whereas Ryan has an absolute disadvantage in the production of Good 2.
B) Ryan has an absolute disadvantage in the production of Good 1, whereas Tom has an absolute disadvantage in the production of Good 2.
C) Tom can produce fewer of both goods given the same amount of resources as Ryan.
D) Ryan can produce fewer of both goods given the same amount of resources as Tom.
Question
The following figure shows the production possibilities curves (PPCs) of two individuals, Ryan and Tom.
Refer to the figure above.Which of the following statements is true?
A) Ryan has an absolute advantage in the production of Good 1, whereas Tom has an absolute advantage in the production of Good 2.
B) Tom has an absolute advantage in the production of Good 1, whereas Ryan has an absolute advantage in the production of Good 2.
C) Ryan has an absolute advantage in the production of both goods.
D) Tom has an absolute advantage in the production of both goods.
Question
Question
The following figure depicts the production possibilities curve when Ann and Bob engage in trade. With all her resources, Ann can either produce two computer programs or one Web site. With all his resources, Bob can either produce one computer program or three Web sites.
Refer to the figure above.The steeper portion of this curve has a slope equal to ________.
A) Ann's PPC
B) Bob's PPC
C) Ann's minus Bob's PPC
D) Ann's plus Bob's PPC
Refer to the figure above.The steeper portion of this curve has a slope equal to ________.
A) Ann's PPC
B) Bob's PPC
C) Ann's minus Bob's PPC
D) Ann's plus Bob's PPC
Question
The following figure shows the production possibilities curves (PPCs) of two individuals, Ryan and Tom.
Refer to the figure above.Which of the following statements is true?
A) Ryan has a comparative advantage in the production of Good 1, whereas Tom has a comparative advantage in the production of Good 2.
B) Ryan has a comparative advantage in the production of Good 2, whereas Tom has a comparative advantage in the production of Good 1.
C) Ryan has a comparative advantage in the production of both goods.
D) Tom has a comparative advantage in the production of both goods.
Question
Question
The figure below shows the production possibilities curves (PPCs)for Viola and Davis.Which of the lines in the graph correctly represents their joint PPC?

A) Line 1
B) Line 2
C) Line 3
D) Line 4
A) Line 1
B) Line 2
C) Line 3
D) Line 4

Unlock Deck
Sign up to unlock the cards in this deck!
Unlock Deck
Unlock Deck
1/264
Play
Full screen (f)
Deck 8: Trade
1
The following figure shows the production possibilities curve for a software engineer who has to divide her available time between producing computer programs and Web sites.
Refer to the figure above.If the engineer spends her entire time producing computer programs,how many computer programs can she produce?
A) 12
B) 30
C) 45
D) 50
Refer to the figure above.If the engineer spends her entire time producing computer programs,how many computer programs can she produce?
A) 12
B) 30
C) 45
D) 50
50
2
Scenario: Yasmin and Zeek are lawyers working at V, W, and X LLP. Yasmin works 48 hours a week, and Zeek also works 48 hours a week. They handle two types of cases, intellectual property (IP) cases and corporate fraud (CF) cases. It takes Yasmin 6 hours to handle each IP case and 4 hours to handle each CF case. Zeek can finish an IP case in 3 hours and a CF case in 6 hours.
Refer to the scenario above.If you draw the production possibilities curves (PPCs)of the two lawyers where the number of IP cases handled is measured on the x-axis,then ________.
A) Zeek's PPC lies above Yasmin's
B) Zeek's PPC has the same slope as Yasmin's
C) Zeek's PPC is flatter than Yasmin's
D) Zeek's PPC is steeper than Yasmin's
Zeek's PPC is flatter than Yasmin's
3
Which of the following best describes a production possibilities curve?
A) How much of one good an economy can produce if they forgo production of another good
B) The rate at which an economy can trade production of one good for another
C) The total amount of goods an economy can produce
D) A relationship showing the maximum production of one good for a given level of production of another good
A relationship showing the maximum production of one good for a given level of production of another good
4
Scenario: Yasmin and Zeek are lawyers working at V, W, and X LLP. Yasmin works 48 hours a week, and Zeek also works 48 hours a week. They handle two types of cases, intellectual property (IP) cases and corporate fraud (CF) cases. It takes Yasmin 6 hours to handle each IP case and 4 hours to handle each CF case. Zeek can finish an IP case in 3 hours and a CF case in 6 hours.
Refer to the scenario above.If Yasmin spent all her time on CF cases,how many CF cases can she finish?
A) 16
B) 12
C) 8
D) 4
Refer to the scenario above.If Yasmin spent all her time on CF cases,how many CF cases can she finish?
A) 16
B) 12
C) 8
D) 4
Unlock Deck
Unlock for access to all 264 flashcards in this deck.
Unlock Deck
k this deck
5
A curve that shows the various combinations of goods and services that are possible for an economy to produce with a given amount of resources is referred to as a(n)________.
A) supply curve
B) indifference curve
C) budget constraint
D) production possibilities curve
A) supply curve
B) indifference curve
C) budget constraint
D) production possibilities curve
Unlock Deck
Unlock for access to all 264 flashcards in this deck.
Unlock Deck
k this deck
6
The following figure shows the production possibilities curve for a software engineer who has to divide her available time between producing computer programs and Web sites.
Refer to the figure above.Which of the following combinations is unattainable?
A) A
B) B
C) D
D) E
Refer to the figure above.Which of the following combinations is unattainable?
A) A
B) B
C) D
D) E
Unlock Deck
Unlock for access to all 264 flashcards in this deck.
Unlock Deck
k this deck
7
Scenario: Yasmin and Zeek are lawyers working at V, W, and X LLP. Yasmin works 48 hours a week, and Zeek also works 48 hours a week. They handle two types of cases, intellectual property (IP) cases and corporate fraud (CF) cases. It takes Yasmin 6 hours to handle each IP case and 4 hours to handle each CF case. Zeek can finish an IP case in 3 hours and a CF case in 6 hours.
Refer to the scenario above.What is Yasmin's opportunity cost of handling an IP case?
A) 6 hours
B) 40 minutes
C) Two-thirds of a CF case
D) One and a half IP cases
Refer to the scenario above.What is Yasmin's opportunity cost of handling an IP case?
A) 6 hours
B) 40 minutes
C) Two-thirds of a CF case
D) One and a half IP cases
Unlock Deck
Unlock for access to all 264 flashcards in this deck.
Unlock Deck
k this deck
8
Scenario: Jack takes 3 hours to complete a painting and 6 hours to create a sculpture. He has 30 hours of time to spend on both activities.
Refer to the scenario above.Which of the following combinations will lie above Jack's production possibilities curve?
A) 2 paintings and 3 sculptures
B) 5 sculptures only
C) 10 paintings only
D) 3 paintings and 5 sculptures
Refer to the scenario above.Which of the following combinations will lie above Jack's production possibilities curve?
A) 2 paintings and 3 sculptures
B) 5 sculptures only
C) 10 paintings only
D) 3 paintings and 5 sculptures
Unlock Deck
Unlock for access to all 264 flashcards in this deck.
Unlock Deck
k this deck
9
The underlying motivation for trade,relies on one simple principle.What is it?
A) Trade creates employment.
B) Trade allows total production to be maximized.
C) Trade will increase the profit for firms.
D) Trade maximizes the opportunity costs.
A) Trade creates employment.
B) Trade allows total production to be maximized.
C) Trade will increase the profit for firms.
D) Trade maximizes the opportunity costs.
Unlock Deck
Unlock for access to all 264 flashcards in this deck.
Unlock Deck
k this deck
10
The following figure shows the production possibilities curve for a software engineer who has to divide her available time between producing computer programs and Web sites.
Refer to the figure above.Which of the following combinations is attainable but inefficient?
A) A
B) B
C) C
D) D
Refer to the figure above.Which of the following combinations is attainable but inefficient?
A) A
B) B
C) C
D) D
Unlock Deck
Unlock for access to all 264 flashcards in this deck.
Unlock Deck
k this deck
11
A machine can manufacture 1 unit of Good X in 2 hours and 1 unit of Good Y in 1 hour.Assuming that the machine is used for 10 hours,which of the following combinations will lie on the production possibilities curve?
A) 5 units of Good X and 2 units of Good Y
B) 3 units of Good X and 4 units of Good Y
C) 2 units of Good X and 2 units of Good Y
D) 6 units of Good X only
A) 5 units of Good X and 2 units of Good Y
B) 3 units of Good X and 4 units of Good Y
C) 2 units of Good X and 2 units of Good Y
D) 6 units of Good X only
Unlock Deck
Unlock for access to all 264 flashcards in this deck.
Unlock Deck
k this deck
12
Scenario: Jack takes 3 hours to complete a painting and 6 hours to create a sculpture. He has 30 hours of time to spend on both activities.
Refer to the scenario above.If Jack has to decide between the number of paintings and sculptures he wants to make in the given time,which of the following will best represent his options?
A) A budget constraint
B) An indifference curve
C) A production possibilities curve
D) A supply curve
Refer to the scenario above.If Jack has to decide between the number of paintings and sculptures he wants to make in the given time,which of the following will best represent his options?
A) A budget constraint
B) An indifference curve
C) A production possibilities curve
D) A supply curve
Unlock Deck
Unlock for access to all 264 flashcards in this deck.
Unlock Deck
k this deck
13
The following figure shows the production possibilities curve for a software engineer who has to divide her available time between producing computer programs and Web sites.
Refer to the figure above.If the engineer spends her entire time on producing Web sites,how many Web sites can she produce?
A) 2
B) 5
C) 10
D) 12
Refer to the figure above.If the engineer spends her entire time on producing Web sites,how many Web sites can she produce?
A) 2
B) 5
C) 10
D) 12
Unlock Deck
Unlock for access to all 264 flashcards in this deck.
Unlock Deck
k this deck
14
Scenario: Jack takes 3 hours to complete a painting and 6 hours to create a sculpture. He has 30 hours of time to spend on both activities.
Refer to the scenario above.Which of the following combinations will lie on Jack's production possibilities curve?
A) 10 paintings and 6 sculptures
B) 5 paintings and 1 sculpture
C) 10 paintings only
D) 10 sculptures only
Refer to the scenario above.Which of the following combinations will lie on Jack's production possibilities curve?
A) 10 paintings and 6 sculptures
B) 5 paintings and 1 sculpture
C) 10 paintings only
D) 10 sculptures only
Unlock Deck
Unlock for access to all 264 flashcards in this deck.
Unlock Deck
k this deck
15
Trade between two nations ________.
A) results in the maximization of total production
B) reduces global production
C) leads to a maximization of production in one nation and a minimization of production in the other
D) is inefficient compared to a situation where both nations do not engage in international trade
A) results in the maximization of total production
B) reduces global production
C) leads to a maximization of production in one nation and a minimization of production in the other
D) is inefficient compared to a situation where both nations do not engage in international trade
Unlock Deck
Unlock for access to all 264 flashcards in this deck.
Unlock Deck
k this deck
16
Scenario: Yasmin and Zeek are lawyers working at V, W, and X LLP. Yasmin works 48 hours a week, and Zeek also works 48 hours a week. They handle two types of cases, intellectual property (IP) cases and corporate fraud (CF) cases. It takes Yasmin 6 hours to handle each IP case and 4 hours to handle each CF case. Zeek can finish an IP case in 3 hours and a CF case in 6 hours.
Refer to the scenario above.If Zeek spent all his time on IP cases,how many IP cases can he finish?
A) 16
B) 12
C) 8
D) 4
Refer to the scenario above.If Zeek spent all his time on IP cases,how many IP cases can he finish?
A) 16
B) 12
C) 8
D) 4
Unlock Deck
Unlock for access to all 264 flashcards in this deck.
Unlock Deck
k this deck
17
Scenario: Jack takes 3 hours to complete a painting and 6 hours to create a sculpture. He has 30 hours of time to spend on both activities.
Refer to the scenario above.Which of the following combinations will lie below Jack's production possibilities curve?
A) 10 paintings and 6 sculptures
B) 5 paintings and 1 sculpture
C) 10 paintings only
D) 10 sculptures only
Refer to the scenario above.Which of the following combinations will lie below Jack's production possibilities curve?
A) 10 paintings and 6 sculptures
B) 5 paintings and 1 sculpture
C) 10 paintings only
D) 10 sculptures only
Unlock Deck
Unlock for access to all 264 flashcards in this deck.
Unlock Deck
k this deck
18
A production possibilities curve shows the ________.
A) relationship between the price of a good and its quantity supplied
B) maximum production of one good for a given level of production of another good
C) different combinations of two inputs used to produce a given quantity of output
D) quantity of output produced and the amount of inputs required for the production of the output
Unlock Deck
Unlock for access to all 264 flashcards in this deck.
Unlock Deck
k this deck
19
Scenario: Yasmin and Zeek are lawyers working at V, W, and X LLP. Yasmin works 48 hours a week, and Zeek also works 48 hours a week. They handle two types of cases, intellectual property (IP) cases and corporate fraud (CF) cases. It takes Yasmin 6 hours to handle each IP case and 4 hours to handle each CF case. Zeek can finish an IP case in 3 hours and a CF case in 6 hours.
Refer to the scenario above.What is Zeek's opportunity cost of handling a CF case?
A) Two IP cases
B) One and a half IP cases
C) 30 minutes
D) 6 hours
Refer to the scenario above.What is Zeek's opportunity cost of handling a CF case?
A) Two IP cases
B) One and a half IP cases
C) 30 minutes
D) 6 hours
Unlock Deck
Unlock for access to all 264 flashcards in this deck.
Unlock Deck
k this deck
20
The following figure shows the production possibilities curve for a software engineer who has to divide her available time between producing computer programs and Web sites.
Refer to the figure above.Which of the following combinations is attainable as well as efficient?
A) B
B) C
C) D
D) E
Refer to the figure above.Which of the following combinations is attainable as well as efficient?
A) B
B) C
C) D
D) E
Unlock Deck
Unlock for access to all 264 flashcards in this deck.
Unlock Deck
k this deck
21
Scenario: The following production possibilities schedules and curves represent the amount of corn and alfalfa that can be produced on an acre of land in Idaho and Iowa.
These production possibilities schedules are shown in the following figure.
Refer to the scenario above.The opportunity cost of a ton of alfalfa in Idaho is ________.
A) of a bushel of corn
B) 1 bushel of corn
C) 15 bushels of corn
D) 120 bushels of corn
These production possibilities schedules are shown in the following figure.
Refer to the scenario above.The opportunity cost of a ton of alfalfa in Idaho is ________.
A)
of a bushel of cornB) 1 bushel of corn
C) 15 bushels of corn
D) 120 bushels of corn
Unlock Deck
Unlock for access to all 264 flashcards in this deck.
Unlock Deck
k this deck
22
The following figure depicts a nonlinear production possibilities curve.
Refer to the figure above.If the market economy moves from point A to point C,________.
A) there is unemployment in the computer programs industry
B) the opportunity cost of producing an additional Web site increases
C) technological change has made the production of Web sites more efficient
D) society values Web sites more than computer programs
Unlock Deck
Unlock for access to all 264 flashcards in this deck.
Unlock Deck
k this deck
23
The following figure depicts a nonlinear production possibilities curve.
Refer to the figure above.With currently available resources,point F represents a situation that ________.
A) results if resources are not fully employed
B) can be achieved if consumers demand fewer Web sites than at point C
C) is currently attainable, given available resources
D) is currently unattainable, given available resources
Unlock Deck
Unlock for access to all 264 flashcards in this deck.
Unlock Deck
k this deck
24
If an economy is producing on the production possibilities curve,then that economy ________.
A) is making full use of its resources
B) is not making full use of its resources
C) must have the government allocating resources
D) is maximizing profits
A) is making full use of its resources
B) is not making full use of its resources
C) must have the government allocating resources
D) is maximizing profits
Unlock Deck
Unlock for access to all 264 flashcards in this deck.
Unlock Deck
k this deck
25
Scenario: Suppose a country produces only two goods: Good X and Good Y.
Refer to the scenario above.The opportunity cost of producing Good X equals ________.
A) loss in Good Y/loss in Good X
B) loss in Good Y/gain in Good X
C) loss in Good X/loss in Good Y
D) loss in Good X/gain in Good Y
Refer to the scenario above.The opportunity cost of producing Good X equals ________.
A) loss in Good Y/loss in Good X
B) loss in Good Y/gain in Good X
C) loss in Good X/loss in Good Y
D) loss in Good X/gain in Good Y
Unlock Deck
Unlock for access to all 264 flashcards in this deck.
Unlock Deck
k this deck
26
Scenario: Suppose a country produces only two goods: Good X and Good Y.
Refer to the scenario above.The opportunity cost of producing Good Y equals ________.
A) gain in Good Y/gain in Good X
B) loss in Good X/gain in Good Y
C) loss in Good X/loss in Good Y
D) gain in Good X/gain in Good Y
Refer to the scenario above.The opportunity cost of producing Good Y equals ________.
A) gain in Good Y/gain in Good X
B) loss in Good X/gain in Good Y
C) loss in Good X/loss in Good Y
D) gain in Good X/gain in Good Y
Unlock Deck
Unlock for access to all 264 flashcards in this deck.
Unlock Deck
k this deck
27
How is a production possibilities curve similar to a budget constraint?
Unlock Deck
Unlock for access to all 264 flashcards in this deck.
Unlock Deck
k this deck
28
Scenario: The following production possibilities schedules and curves represent the amount of corn and alfalfa that can be produced on an acre of land in Idaho and Iowa.
These production possibilities schedules are shown in the following figure.
Refer to the scenario above.The opportunity cost of a bushel of corn in Iowa is ________.
A) of a ton of alfalfa
B) 1 ton of alfalfa
C) 6 tons of alfalfa
D) 40 tons of alfalfa
These production possibilities schedules are shown in the following figure.
Refer to the scenario above.The opportunity cost of a bushel of corn in Iowa is ________.
A)
of a ton of alfalfaB) 1 ton of alfalfa
C) 6 tons of alfalfa
D) 40 tons of alfalfa
Unlock Deck
Unlock for access to all 264 flashcards in this deck.
Unlock Deck
k this deck
29
Even though points inside a production possibilities curve are attainable,why are they not preferred?
Unlock Deck
Unlock for access to all 264 flashcards in this deck.
Unlock Deck
k this deck
30
Points inside a production possibilities curve are ________.
A) inefficient, because more goods can be produced with the available resources
B) inefficient, because they represent the production of only one good
C) efficient, because the combinations represented by those points are attainable
D) efficient, because production is maximum at those points with the available resources
Unlock Deck
Unlock for access to all 264 flashcards in this deck.
Unlock Deck
k this deck
31
Points on a production possibilities curve are ________ and ________.
A) inefficient; attainable
B) inefficient; unattainable
C) efficient; attainable
D) efficient; unattainable
A) inefficient; attainable
B) inefficient; unattainable
C) efficient; attainable
D) efficient; unattainable
Unlock Deck
Unlock for access to all 264 flashcards in this deck.
Unlock Deck
k this deck
32
The following figure depicts a nonlinear production possibilities curve.
Refer to the figure above.Assuming that the initial situation is point B,which one of the following represents a reallocation of resources away from Web sites to computer programs production?
A) Point A
B) Point C
C) Point D
D) Point E
Refer to the figure above.Assuming that the initial situation is point B,which one of the following represents a reallocation of resources away from Web sites to computer programs production?
A) Point A
B) Point C
C) Point D
D) Point E
Unlock Deck
Unlock for access to all 264 flashcards in this deck.
Unlock Deck
k this deck
33
Points inside a production possibilities curve are ________ and ________.
A) efficient; unattainable
B) inefficient; unattainable
C) efficient; attainable
D) inefficient; attainable
A) efficient; unattainable
B) inefficient; unattainable
C) efficient; attainable
D) inefficient; attainable
Unlock Deck
Unlock for access to all 264 flashcards in this deck.
Unlock Deck
k this deck
34
The slope of a production possibility curve represents ________.
A) the total cost of producing a given level of output
B) the opportunity cost of producing one more unit of a good in terms of the forgone production of the other good
C) the rate at which people in an economy would like to trade one good for another
D) combinations of two goods that are not attainable with existing technology
Unlock Deck
Unlock for access to all 264 flashcards in this deck.
Unlock Deck
k this deck
35
The slope of a production possibilities curve represents the ________.
A) marginal cost of producing the good measured on the x-axis
B) marginal cost of producing the good measured on the y-axis
C) opportunity cost of producing the goods
D) ratio of the average cost of producing both goods
A) marginal cost of producing the good measured on the x-axis
B) marginal cost of producing the good measured on the y-axis
C) opportunity cost of producing the goods
D) ratio of the average cost of producing both goods
Unlock Deck
Unlock for access to all 264 flashcards in this deck.
Unlock Deck
k this deck
36
Christine is a chef.She can cook a meal in 1 hour and make a cake in 2 hours.She works 10 hours per day.Which of the four lines in the following figure represents her production possibilities curve?
A) Line 1
B) Line 2
C) Line 3
D) Line 4
A) Line 1
B) Line 2
C) Line 3
D) Line 4
Unlock Deck
Unlock for access to all 264 flashcards in this deck.
Unlock Deck
k this deck
37
The following figure depicts a nonlinear production possibilities curve.
Refer to the figure above.Point E represents a situation that ________.
A) is currently unattainable and can be expected to remain so
B) will be attainable only if there is economic growth
C) results from inefficient use of resources or failure to use all available resources
D) has a higher opportunity cost than do points on the boundary itself
Unlock Deck
Unlock for access to all 264 flashcards in this deck.
Unlock Deck
k this deck
38
Which of the following causes an outward shift in the Production Possibilities Curve?
A) A decrease in unemployment.
B) A loss in the productive capacity of agricultural acreage caused by a prolonged drought.
C) An increase in the productivity of all factors of production.
D) Shifting resources away from the production of one good toward another.
A) A decrease in unemployment.
B) A loss in the productive capacity of agricultural acreage caused by a prolonged drought.
C) An increase in the productivity of all factors of production.
D) Shifting resources away from the production of one good toward another.
Unlock Deck
Unlock for access to all 264 flashcards in this deck.
Unlock Deck
k this deck
39
Assume that a machine is used to produce calculators and cell phones.The machine can be used for a maximum of 10 hours.The productivity table of the machine is shown below.
a)Draw the production possibilities curve from the information given in the table.
b)Calculate the opportunity cost of producing either good.
a)Draw the production possibilities curve from the information given in the table.
b)Calculate the opportunity cost of producing either good.
Unlock Deck
Unlock for access to all 264 flashcards in this deck.
Unlock Deck
k this deck
40
Points outside a production possibilities curve are ________.
A) feasible and maximize efficiency
B) not feasible because of resource constraints
C) feasible but not preferred, because they are inefficient
D) not feasible, because they do not utilize all of the available resources
A) feasible and maximize efficiency
B) not feasible because of resource constraints
C) feasible but not preferred, because they are inefficient
D) not feasible, because they do not utilize all of the available resources
Unlock Deck
Unlock for access to all 264 flashcards in this deck.
Unlock Deck
k this deck
41
Increasing opportunity cost can arise if ________.
A) there are economies of scale in production
B) marginal costs of production are constant
C) production of the good is characterized by diminishing returns
D) the production possibility curve is linear
A) there are economies of scale in production
B) marginal costs of production are constant
C) production of the good is characterized by diminishing returns
D) the production possibility curve is linear
Unlock Deck
Unlock for access to all 264 flashcards in this deck.
Unlock Deck
k this deck
42
Scenario: Yasmin and Zeek are lawyers working at V, W, and X LLP. Yasmin works 48 hours a week, and Zeek also works 48 hours a week. They handle two types of cases, intellectual property (IP) cases and corporate fraud (CF) cases. It takes Yasmin 6 hours to handle each IP case and 4 hours to handle each CF case. Zeek can finish an IP case in 3 hours and a CF case in 6 hours.
Refer to the scenario above.Suppose that the two lawyers' boss wants the total number of IP cases worked on by them to equal the total number of CF cases worked on by them.So long as the total number of IP cases equals the total number of CF cases,their boss does not care which lawyer works on how many of which type of case.So Yasmin and Zeek decide to take advantage of their comparative advantages.How would they divide the tasks?
A) Yasmin specializes in IP cases, while Zeek specializes in CF cases.
B) Yasmin specializes in CF cases, while Zeek specializes in IP cases.
C) Yasmin specializes in IP cases, while Zeek works on both types of cases.
D) Yasmin specializes in CF cases, while Zeek works on both types of cases.
Unlock Deck
Unlock for access to all 264 flashcards in this deck.
Unlock Deck
k this deck
43
Scenario: Yasmin and Zeek are lawyers working at V, W, and X LLP. Yasmin works 48 hours a week, and Zeek also works 48 hours a week. They handle two types of cases, intellectual property (IP) cases and corporate fraud (CF) cases. It takes Yasmin 6 hours to handle each IP case and 4 hours to handle each CF case. Zeek can finish an IP case in 3 hours and a CF case in 6 hours.
Refer to the scenario above.Zeek's supervisor wants him to handle equal number of IP and CF cases.How much time would Zeek spend on each type of case? (Hint: Assume that he can work on a fraction of a case.)
A) 32 hours on IP cases and 16 hours on CF cases
B) 28 hours on IP cases and 20 hours on CF cases
C) 24 hours each on IP cases and CF cases
D) 16 hours on IP cases and 32 hours on CF cases
Unlock Deck
Unlock for access to all 264 flashcards in this deck.
Unlock Deck
k this deck
44
Alexander Selkirk lives on Juan Fernandez Island.He spends his days gathering coconuts and spiny lobsters.If he spends all day gathering coconuts,he can collect 40 coconuts.If he spends all day collecting spiny lobsters,he can capture 20 in a day.His production possibilities curve is shown in the figure below.
As Selkirk collects more coconuts,the opportunity cost of a coconut is ________.
A) decreasing
B) constant
C) increasing
D) unpredictable
As Selkirk collects more coconuts,the opportunity cost of a coconut is ________.
A) decreasing
B) constant
C) increasing
D) unpredictable
Unlock Deck
Unlock for access to all 264 flashcards in this deck.
Unlock Deck
k this deck
45
The following figure shows the production possibilities curve for Sheena, who has to split her time between producing Web sites and computer programs.
Refer to the figure above.What is the opportunity cost of producing 1 Web site?
A) 0.2 computer programs
B) 5 computer programs
C) 12 computer programs
D) 60 computer programs
Refer to the figure above.What is the opportunity cost of producing 1 Web site?
A) 0.2 computer programs
B) 5 computer programs
C) 12 computer programs
D) 60 computer programs
Unlock Deck
Unlock for access to all 264 flashcards in this deck.
Unlock Deck
k this deck
46
Scenario: With her available resources, Wendy can produce 20 greeting cards or 10 earrings. Sarah, with the resources she has, can produce 5 greeting cards or 15 earrings.
Refer to the scenario above.What is Sarah's opportunity cost of producing one greeting card?
A) 0.33 earrings
B) 0.5 earrings
C) 1 earring
D) 3 earrings
Refer to the scenario above.What is Sarah's opportunity cost of producing one greeting card?
A) 0.33 earrings
B) 0.5 earrings
C) 1 earring
D) 3 earrings
Unlock Deck
Unlock for access to all 264 flashcards in this deck.
Unlock Deck
k this deck
47
Scenario: Yasmin and Zeek are lawyers working at V, W, and X LLP. Yasmin works 48 hours a week, and Zeek also works 48 hours a week. They handle two types of cases, intellectual property (IP) cases and corporate fraud (CF) cases. It takes Yasmin 6 hours to handle each IP case and 4 hours to handle each CF case. Zeek can finish an IP case in 3 hours and a CF case in 6 hours.
Refer to the scenario above.Suppose that the two lawyers' boss wants the total number of IP cases worked on by them to be equal the total number of CF cases worked on by them.So long as the total number of IP cases equals the total number of CF cases,their boss does not care which lawyer works on how many of which type of case.So Yasmin and Zeek decide to take advantage of their comparative advantages.How many IP and CF cases would they finish? (Hint: Assume that they can work on a fraction of a case.)
A) 12 and three halves of each type of case
B) 13 and a third of each type of case
C) 16 and a half of each type of case
D) 24 of each type of case
Unlock Deck
Unlock for access to all 264 flashcards in this deck.
Unlock Deck
k this deck
48
Scenario: Viola and Davis are two students who are taking a math class and an English class. The graph below shows the production possibilities curves for each of them.
Refer to the scenario above.What is the opportunity cost of one math homework assignment for Viola?
A) 9 English essays
B) 3 English essays
C) 0.5 English essays
D) 0.33 English essays
Refer to the scenario above.What is the opportunity cost of one math homework assignment for Viola?
A) 9 English essays
B) 3 English essays
C) 0.5 English essays
D) 0.33 English essays
Unlock Deck
Unlock for access to all 264 flashcards in this deck.
Unlock Deck
k this deck
49
Scenario: Yasmin and Zeek are lawyers working at V, W, and X LLP. Yasmin works 48 hours a week, and Zeek also works 48 hours a week. They handle two types of cases, intellectual property (IP) cases and corporate fraud (CF) cases. It takes Yasmin 6 hours to handle each IP case and 4 hours to handle each CF case. Zeek can finish an IP case in 3 hours and a CF case in 6 hours.
Refer to the scenario above.Yasmin's supervisor wants her to handle equal numbers of IP and CF cases.How much time would Yasmin spend on each type of case? (Hint: Assume that she can work on a fraction of a case.)
A) 24 hours each on IP cases and CF cases
B) 28 hours and 48 minutes on IP cases, and 19 hours and 12 minutes on CF cases
C) 32 hours and 24 minutes on IP cases and 15 hours and 36 minutes on CF cases
D) 36 hours on IP cases and 12 hours on CF cases
Unlock Deck
Unlock for access to all 264 flashcards in this deck.
Unlock Deck
k this deck
50
Scenario: With her available resources, Wendy can produce 20 greeting cards or 10 earrings. Sarah, with the resources she has, can produce 5 greeting cards or 15 earrings.
Refer to the scenario above.What is Wendy's opportunity cost of producing one earring?
A) 0.33 greeting cards
B) 0.50 greeting cards
C) 1 greeting card
D) 2 greeting cards
Refer to the scenario above.What is Wendy's opportunity cost of producing one earring?
A) 0.33 greeting cards
B) 0.50 greeting cards
C) 1 greeting card
D) 2 greeting cards
Unlock Deck
Unlock for access to all 264 flashcards in this deck.
Unlock Deck
k this deck
51
The ability of an individual,firm,or country to produce a certain good at a lower opportunity cost than other producers is referred to as ________.
A) marginal advantage
B) absolute advantage
C) cardinal advantage
D) comparative advantage
A) marginal advantage
B) absolute advantage
C) cardinal advantage
D) comparative advantage
Unlock Deck
Unlock for access to all 264 flashcards in this deck.
Unlock Deck
k this deck
52
Scenario: Viola and Davis are two students who are taking a math class and an English class. The graph below shows the production possibilities curves for each of them.
Refer to the scenario above.What is the opportunity cost of one English essay for Viola?
A) 9 math homework assignments
B) 3 math homework assignments
C) 0.5 math homework assignments
D) 0.33 math homework assignments
Refer to the scenario above.What is the opportunity cost of one English essay for Viola?
A) 9 math homework assignments
B) 3 math homework assignments
C) 0.5 math homework assignments
D) 0.33 math homework assignments
Unlock Deck
Unlock for access to all 264 flashcards in this deck.
Unlock Deck
k this deck
53
Scenario: With her available resources, Wendy can produce 20 greeting cards or 10 earrings. Sarah, with the resources she has, can produce 5 greeting cards or 15 earrings.
Refer to the scenario above.What is Sarah's opportunity cost of producing 1 earring?
A) 0.33 greeting cards
B) 1 greeting card
C) 1.45 greeting cards
D) 3 greeting cards
Refer to the scenario above.What is Sarah's opportunity cost of producing 1 earring?
A) 0.33 greeting cards
B) 1 greeting card
C) 1.45 greeting cards
D) 3 greeting cards
Unlock Deck
Unlock for access to all 264 flashcards in this deck.
Unlock Deck
k this deck
54
The following figure illustrates the production possibilities curve of a farmer who has to decide on the quantities of wheat and rice to produce for a given amount of resources.Three possible production combinations-A,B,and C-are marked on the figure.
a)Which of the three combinations of wheat and rice,marked on the graph,is both efficient and attainable? Explain your answer.
b)Calculate the opportunity cost of producing both wheat and rice.
a)Which of the three combinations of wheat and rice,marked on the graph,is both efficient and attainable? Explain your answer.
b)Calculate the opportunity cost of producing both wheat and rice.
Unlock Deck
Unlock for access to all 264 flashcards in this deck.
Unlock Deck
k this deck
55
Scenario: Yasmin and Zeek are lawyers working at V, W, and X LLP. Yasmin works 48 hours a week, and Zeek also works 48 hours a week. They handle two types of cases, intellectual property (IP) cases and corporate fraud (CF) cases. It takes Yasmin 6 hours to handle each IP case and 4 hours to handle each CF case. Zeek can finish an IP case in 3 hours and a CF case in 6 hours.
Refer to the scenario above.Who has a comparative advantage in handling CF cases and why?
A) Yasmin, because her opportunity cost of handling a CF case is a third of Zeek's
B) Yasmin, because her opportunity cost of handling a CF case is half of Zeek's
C) Zeek, because his opportunity cost of handling a CF case is a third of Yasmin's
D) Zeek, because his opportunity cost of handling a CF case is half of Yasmin's
Unlock Deck
Unlock for access to all 264 flashcards in this deck.
Unlock Deck
k this deck
56
Scenario: Viola and Davis are two students who are taking a math class and an English class. The graph below shows the production possibilities curves for each of them.
Refer to the scenario above.Davis has a ________ opportunity cost of doing math homework assignments and a ________ opportunity cost of writing English essays compared to Viola.
A) lower; higher
B) higher; higher
C) lower; lower
D) higher; lower
Refer to the scenario above.Davis has a ________ opportunity cost of doing math homework assignments and a ________ opportunity cost of writing English essays compared to Viola.
A) lower; higher
B) higher; higher
C) lower; lower
D) higher; lower
Unlock Deck
Unlock for access to all 264 flashcards in this deck.
Unlock Deck
k this deck
57
Scenario: A machine that can be used to print both notebooks and magazines is available for use for a fixed period of time. If it is used only to print notebooks, 30 notebooks can be printed. If it is used only to print magazines, 15 magazines can be printed.
Refer to the scenario above.What is the opportunity cost of printing 1 notebook?
A) 0.5 magazines
B) 1 magazine
C) 2 magazines
D) 30 magazines
Refer to the scenario above.What is the opportunity cost of printing 1 notebook?
A) 0.5 magazines
B) 1 magazine
C) 2 magazines
D) 30 magazines
Unlock Deck
Unlock for access to all 264 flashcards in this deck.
Unlock Deck
k this deck
58
The following figure shows the production possibilities curve for Sheena, who has to split her time between producing Web sites and computer programs.
Refer to the figure above.What is the opportunity cost of producing 1 computer program?
A) 0.2 Web sites
B) 5 Web sites
C) 8 Web sites
D) 12 Web sites
Refer to the figure above.What is the opportunity cost of producing 1 computer program?
A) 0.2 Web sites
B) 5 Web sites
C) 8 Web sites
D) 12 Web sites
Unlock Deck
Unlock for access to all 264 flashcards in this deck.
Unlock Deck
k this deck
59
Scenario: A machine that can be used to print both notebooks and magazines is available for use for a fixed period of time. If it is used only to print notebooks, 30 notebooks can be printed. If it is used only to print magazines, 15 magazines can be printed.
Refer to the scenario above.What is the opportunity cost of printing 1 magazine?
A) 1 notebook
B) 2 notebooks
C) 15 notebooks
D) 30 notebooks
Refer to the scenario above.What is the opportunity cost of printing 1 magazine?
A) 1 notebook
B) 2 notebooks
C) 15 notebooks
D) 30 notebooks
Unlock Deck
Unlock for access to all 264 flashcards in this deck.
Unlock Deck
k this deck
60
Scenario: With her available resources, Wendy can produce 20 greeting cards or 10 earrings. Sarah, with the resources she has, can produce 5 greeting cards or 15 earrings.
Refer to the scenario above.What is Wendy's opportunity cost of producing 1 greeting card?
A) 0.25 earrings
B) 0.5 earrings
C) 1 earring
D) 2 earrings
Refer to the scenario above.What is Wendy's opportunity cost of producing 1 greeting card?
A) 0.25 earrings
B) 0.5 earrings
C) 1 earring
D) 2 earrings
Unlock Deck
Unlock for access to all 264 flashcards in this deck.
Unlock Deck
k this deck
61
In Lithasia,the opportunity cost of producing a chair is 2 tables and in Barylia,the opportunity cost of producing a chair is 1/2 table.Which of the following statements is true?
A) Barylia has a comparative advantage in producing chairs.
B) Lithasia has a comparative advantage in producing chairs.
C) Barylia has a comparative advantage in producing tables.
D) Lithasia has a comparative disadvantage in producing tables.
A) Barylia has a comparative advantage in producing chairs.
B) Lithasia has a comparative advantage in producing chairs.
C) Barylia has a comparative advantage in producing tables.
D) Lithasia has a comparative disadvantage in producing tables.
Unlock Deck
Unlock for access to all 264 flashcards in this deck.
Unlock Deck
k this deck
62
The following figure depicts the production possibilities curve when Ann and Bob engage in trade. With all her resources, Ann can either produce two computer programs or one Web site. With all his resources, Bob can either produce one computer program or three Web sites.
Refer to the figure above.What is the value of A?
A) 1
B) 2
C) 3
D) 4
Refer to the figure above.What is the value of A?
A) 1
B) 2
C) 3
D) 4
Unlock Deck
Unlock for access to all 264 flashcards in this deck.
Unlock Deck
k this deck
63
The following figure depicts the production possibilities curve when Ann and Bob engage in trade. With all her resources, Ann can either produce two computer programs or one Web site. With all his resources, Bob can either produce one computer program or three Web sites.
Refer to the figure above.The flatter portion of this curve has a slope equal to ________.
A) Ann's PPC
B) Bob's PPC
C) Ann's minus Bob's PPC
D) Ann's plus Bob's PPC
Refer to the figure above.The flatter portion of this curve has a slope equal to ________.
A) Ann's PPC
B) Bob's PPC
C) Ann's minus Bob's PPC
D) Ann's plus Bob's PPC
Unlock Deck
Unlock for access to all 264 flashcards in this deck.
Unlock Deck
k this deck
64
Scenario: Meryl and Steve are two classmates who form a study group. The graph below shows the production possibilities curves for each of them.
Refer to the scenario above.________ has comparative advantage in doing math homework,and ________ has comparative advantage in writing Econ essays.
A) Meryl; Meryl
B) Steve; Steve
C) Steve; Meryl
D) Meryl; Steve
Refer to the scenario above.________ has comparative advantage in doing math homework,and ________ has comparative advantage in writing Econ essays.
A) Meryl; Meryl
B) Steve; Steve
C) Steve; Meryl
D) Meryl; Steve
Unlock Deck
Unlock for access to all 264 flashcards in this deck.
Unlock Deck
k this deck
65
The following figure shows the production possibilities curves (PPCs) of two individuals, Ryan and Tom.
Refer to the figure above.Which of the following statements is true?
A) Ryan's opportunity cost of producing Good 1 is higher than that of Tom, whereas Tom's opportunity cost of producing Good 2 is higher than that of Ryan.
B) Ryan's opportunity cost of producing Good 2 is higher than Tom's opportunity cost of producing it.
C) Ryan has a comparative disadvantage in the production of both goods.
D) Tom has a comparative disadvantage in the production of both goods.
Unlock Deck
Unlock for access to all 264 flashcards in this deck.
Unlock Deck
k this deck
66
Which of the following statements best describes absolute advantage?
A) The party who has the higher opportunity cost of producing the good
B) The party who has the lower opportunity cost of producing the good
C) The party who can produce more of the good
D) The party who can produce less of the good
A) The party who has the higher opportunity cost of producing the good
B) The party who has the lower opportunity cost of producing the good
C) The party who can produce more of the good
D) The party who can produce less of the good
Unlock Deck
Unlock for access to all 264 flashcards in this deck.
Unlock Deck
k this deck
67
The following figure depicts the production possibilities curve when Ann and Bob engage in trade. With all her resources, Ann can either produce two computer programs or one Web site. With all his resources, Bob can either produce one computer program or three Web sites.
Refer to the figure above.What is the value of B?
A) 1
B) 2
C) 3
D) 4
Refer to the figure above.What is the value of B?
A) 1
B) 2
C) 3
D) 4
Unlock Deck
Unlock for access to all 264 flashcards in this deck.
Unlock Deck
k this deck
68
A firm producing calculators and cell phones purchases new machinery that increases the productivity of producing calculators.Assuming that the number of calculators produced is measured on the x-axis and the number of cell phones produced is measured on the y-axis,how will the introduction of the new machinery change the firm's production possibilities curve?
A) The production possibilities curve will shift to the left.
B) The production possibilities curve will shift to the right.
C) The production possibilities curve will pivot rightward about the y-axis.
D) The production possibilities curve will pivot rightward about the x-axis.
A) The production possibilities curve will shift to the left.
B) The production possibilities curve will shift to the right.
C) The production possibilities curve will pivot rightward about the y-axis.
D) The production possibilities curve will pivot rightward about the x-axis.
Unlock Deck
Unlock for access to all 264 flashcards in this deck.
Unlock Deck
k this deck
69
Scenario: Meryl and Steve are two classmates who form a study group. The graph below shows the production possibilities curves for each of them.
Refer to the scenario above.If Meryl and Steve decide to join forces to do school work and trade,then ________.
A) Meryl should specialize in doing Econ homework assignments, and Steve should specialize in writing lab reports
B) Steve should specialize in doing Econ homework assignments, and Meryl should specialize in writing lab reports
C) Meryl should do half the Econ homework assignments and write half the lab reports, and Steve should do the same
D) Meryl should do ¾ of the Econ homework assignments and ¼ of the lab reports, and Steve should complete the rest
Unlock Deck
Unlock for access to all 264 flashcards in this deck.
Unlock Deck
k this deck
70
Which of the following statements is true?
A) An economic agent can have a comparative advantage in the production of all goods.
B) The agent with the higher opportunity cost of producing a good has the comparative advantage in producing that good.
C) There are mutually beneficial gains from trade if opportunity costs differ.
D) An economic agent who has the absolute advantage in producing a good also has the comparative advantage in producing that good.
Unlock Deck
Unlock for access to all 264 flashcards in this deck.
Unlock Deck
k this deck
71
The following figure depicts the production possibilities curve when Ann and Bob engage in trade. With all her resources, Ann can either produce two computer programs or one Web site. With all his resources, Bob can either produce one computer program or three Web sites.
Refer to the figure above.What should be the values of C and D?
A) C = 3, D = 4
B) C = 4, D = 3
C) C = 1, D = 1
D) C = 2, D = 3
Refer to the figure above.What should be the values of C and D?
A) C = 3, D = 4
B) C = 4, D = 3
C) C = 1, D = 1
D) C = 2, D = 3
Unlock Deck
Unlock for access to all 264 flashcards in this deck.
Unlock Deck
k this deck
72
Scenario: Meryl and Steve are two classmates who form a study group. The graph below shows the production possibilities curves for each of them.
Refer to the scenario above.________ has absolute advantage in doing Econ homework assignments,and ________ has absolute advantage in writing lab reports.
A) Meryl; Meryl
B) Steve; Steve
C) Steve; Meryl
D) Meryl; Steve
Refer to the scenario above.________ has absolute advantage in doing Econ homework assignments,and ________ has absolute advantage in writing lab reports.
A) Meryl; Meryl
B) Steve; Steve
C) Steve; Meryl
D) Meryl; Steve
Unlock Deck
Unlock for access to all 264 flashcards in this deck.
Unlock Deck
k this deck
73
Specialization occurs when each individual,firm,or country ________.
A) produces only a few specific goods and relies on trade for the other goods and services it needs
B) is self-sufficient and produces all goods and services it needs, without relying on imports
C) produces only those goods for which it has a higher opportunity cost of production than that for other nations
D) produces only those goods which are in demand in the global market and allow for high rates of profitability
Unlock Deck
Unlock for access to all 264 flashcards in this deck.
Unlock Deck
k this deck
74
The following figure shows the production possibilities curves (PPCs) of two individuals, Ryan and Tom.
Refer to the figure above.Which of the following statements is true?
A) Tom has an absolute disadvantage in the production of Good 1, whereas Ryan has an absolute disadvantage in the production of Good 2.
B) Ryan has an absolute disadvantage in the production of Good 1, whereas Tom has an absolute disadvantage in the production of Good 2.
C) Tom can produce fewer of both goods given the same amount of resources as Ryan.
D) Ryan can produce fewer of both goods given the same amount of resources as Tom.
Unlock Deck
Unlock for access to all 264 flashcards in this deck.
Unlock Deck
k this deck
75
The following figure shows the production possibilities curves (PPCs) of two individuals, Ryan and Tom.
Refer to the figure above.Which of the following statements is true?
A) Ryan has an absolute advantage in the production of Good 1, whereas Tom has an absolute advantage in the production of Good 2.
B) Tom has an absolute advantage in the production of Good 1, whereas Ryan has an absolute advantage in the production of Good 2.
C) Ryan has an absolute advantage in the production of both goods.
D) Tom has an absolute advantage in the production of both goods.
Unlock Deck
Unlock for access to all 264 flashcards in this deck.
Unlock Deck
k this deck
76
Which of the following statements is true?
A) When two nations specialize and trade, there is a loss of efficiency and both the nations are made worse off.
B) Trade between two nations is most beneficial when neither has a comparative advantage in the production of any goods and services.
C) Trade between nations allows each nation to specialize in the production of goods for which it has comparative advantage.
D) Trade between two nations is possible only when the opportunity costs of producing goods and services in both nations are identical.
Unlock Deck
Unlock for access to all 264 flashcards in this deck.
Unlock Deck
k this deck
77
The following figure depicts the production possibilities curve when Ann and Bob engage in trade. With all her resources, Ann can either produce two computer programs or one Web site. With all his resources, Bob can either produce one computer program or three Web sites.
Refer to the figure above.The steeper portion of this curve has a slope equal to ________.
A) Ann's PPC
B) Bob's PPC
C) Ann's minus Bob's PPC
D) Ann's plus Bob's PPC
Refer to the figure above.The steeper portion of this curve has a slope equal to ________.
A) Ann's PPC
B) Bob's PPC
C) Ann's minus Bob's PPC
D) Ann's plus Bob's PPC
Unlock Deck
Unlock for access to all 264 flashcards in this deck.
Unlock Deck
k this deck
78
The following figure shows the production possibilities curves (PPCs) of two individuals, Ryan and Tom.
Refer to the figure above.Which of the following statements is true?
A) Ryan has a comparative advantage in the production of Good 1, whereas Tom has a comparative advantage in the production of Good 2.
B) Ryan has a comparative advantage in the production of Good 2, whereas Tom has a comparative advantage in the production of Good 1.
C) Ryan has a comparative advantage in the production of both goods.
D) Tom has a comparative advantage in the production of both goods.
Unlock Deck
Unlock for access to all 264 flashcards in this deck.
Unlock Deck
k this deck
79
Which of the following statements is true?
A) When two firms have the same opportunity cost of producing two goods, each firm will always have a comparative advantage in the production of both goods.
B) When two firms have different opportunity costs of producing two goods, each firm will always have a comparative advantage in the production of one of the goods.
C) The firm that has a lower opportunity cost of producing a good is said to have a comparative disadvantage in the production of that good.
D) The firm that faces a lower opportunity cost of producing a good is said to have an absolute disadvantage in the production of that good.
Unlock Deck
Unlock for access to all 264 flashcards in this deck.
Unlock Deck
k this deck
80
The figure below shows the production possibilities curves (PPCs)for Viola and Davis.Which of the lines in the graph correctly represents their joint PPC?
A) Line 1
B) Line 2
C) Line 3
D) Line 4
A) Line 1
B) Line 2
C) Line 3
D) Line 4
Unlock Deck
Unlock for access to all 264 flashcards in this deck.
Unlock Deck
k this deck
Unlock Deck
Unlock for access to all 264 flashcards in this deck.


