Deck 20: Income Inequality and Poverty
Full screen (f)
Question
Question
Question
Question
Question
Question
Question
Question
Question
Question
Question
Question
Question
Question
Question
Question
Question
Question
Question
Question
Question
Question
Question
Question
Question
Question
Question
Question
Question
Question
Question
Question
Question
Question
Question
Question
Question
Question
Table 20-1

Refer to Table 20-1.Seventy-five percent of all families have incomes below what level?
A)$28,000
B)$50,000
C)$85,000
D)There is insufficient information to answer this question.
Refer to Table 20-1.Seventy-five percent of all families have incomes below what level?
A)$28,000
B)$50,000
C)$85,000
D)There is insufficient information to answer this question.
Question
Question
Question
Question
The poverty line in the country of Grinnell is $10,000.The distribution of income for Grinnell is as follows: 
The poverty rate in Grinnell is
A)5 percent.
B)16.7 percent.
C)50 percent.
D)83.3 percent.
The poverty rate in Grinnell is
A)5 percent.
B)16.7 percent.
C)50 percent.
D)83.3 percent.
Question
The poverty line in the country of Abbyville is $15,000.The distribution of income for Abbyville is as follows: 
The poverty rate in Abbyville is
A)12 percent.
B)32 percent.
C)50 percent.
D)68 percent.
The poverty rate in Abbyville is
A)12 percent.
B)32 percent.
C)50 percent.
D)68 percent.
Question
Question
Question
The poverty line in the country of Equalia is $10,000.The distribution of income for Equalia is as follows: 
The poverty rate in Equalia is
A)11.1 percent.
B)16.7 percent.
C)27.8 percent.
D)55.5 percent.
The poverty rate in Equalia is
A)11.1 percent.
B)16.7 percent.
C)27.8 percent.
D)55.5 percent.
Question
Question
Question
Question
Question
Question
Question
Question
Question
The poverty line in the country of Spencerville is $20,000.The distribution of income for Spencerville is as follows: 
The poverty rate in Spencerville is
A)15 percent.
B)33.3 percent.
C)50 percent.
D)66.7 percent.
The poverty rate in Spencerville is
A)15 percent.
B)33.3 percent.
C)50 percent.
D)66.7 percent.
Question
Question
Question
Question
Question
Question
Question
Question
Figure 20-1
Number of Poor
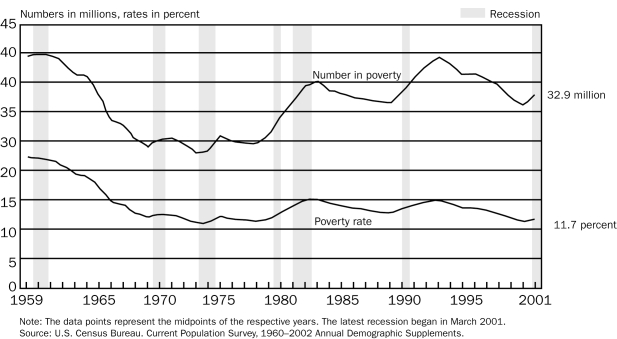
Refer to Figure 20-1.The absolute number of people in poverty
A)is higher in 2001 than in 1959.
B)is lower in 2001 than in 1959.
C)has not changed between 1959 and 2001.
D)has steadily decreased between 1959 and 2001.
Number of Poor
Refer to Figure 20-1.The absolute number of people in poverty
A)is higher in 2001 than in 1959.
B)is lower in 2001 than in 1959.
C)has not changed between 1959 and 2001.
D)has steadily decreased between 1959 and 2001.
Question
Figure 20-2
Poverty Rates by Age
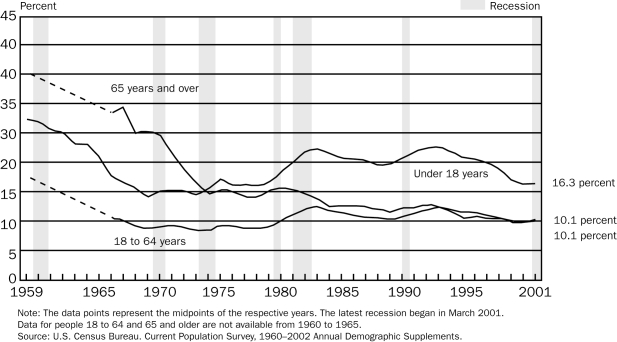
Refer to Figure 20-2.In 1968,the percent of adults aged 18 to 64 years in poverty is
A)higher than both the percentage of children under age 18 and the percentage of elderly aged 65 and over in poverty.
B)higher than the percentage of children under age 18 but is lower than the percentage of elderly aged 65 and over in poverty.
C)is lower than both the percentage of children under age 18 and the percentage of elderly aged 65 and over in poverty.
D)is lower than the percentage of children under age 18 but is higher than the percentage of elderly aged 65 and over in poverty.
Poverty Rates by Age
Refer to Figure 20-2.In 1968,the percent of adults aged 18 to 64 years in poverty is
A)higher than both the percentage of children under age 18 and the percentage of elderly aged 65 and over in poverty.
B)higher than the percentage of children under age 18 but is lower than the percentage of elderly aged 65 and over in poverty.
C)is lower than both the percentage of children under age 18 and the percentage of elderly aged 65 and over in poverty.
D)is lower than the percentage of children under age 18 but is higher than the percentage of elderly aged 65 and over in poverty.
Question
Figure 20-2
Poverty Rates by Age
Refer to Figure 20-2.In 1968,the percent of children under age 18 in poverty is
A)higher than both the percentage of adults aged 18 to 64 and the percentage of elderly aged 65 and over in poverty.
B)higher than the percentage of adults aged 18 to 64 but is lower than the percentage of elderly aged 65 and over in poverty.
C)lower than both the percentage of adults aged 18 to 64 and the percentage of elderly aged 65 and over in poverty.
D)lower than the percentage of adults aged 18 to 64 but is higher than the percentage of elderly aged 65 and over in poverty.
Question
Figure 20-2
Poverty Rates by Age
Refer to Figure 20-2.From 1969 to 2001,the percent of elderly aged 64 and over in poverty has
A)declined, while the percentage of children under age 18 in poverty has also declined.
B)declined, while the percentage of children under age 18 in poverty has increased.
C)increased, while the percentage of children under age 18 in poverty has declined.
D)increased, while the percentage of children under age 18 in poverty has also increased.
Question
Figure 20-1
Number of Poor
Refer to Figure 20-1.Between 1965 and 2001,during recessions (the shaded bars)the number of individuals in poverty has
A)increased.
B)decrease.
C)not changed.
D)decreased and then increased.
Number of Poor
Refer to Figure 20-1.Between 1965 and 2001,during recessions (the shaded bars)the number of individuals in poverty has
A)increased.
B)decrease.
C)not changed.
D)decreased and then increased.
Question
Question
Table 20-2
Poverty Thresholds in 2002, by Size of Family and Number of Related Children Under 18 Years
[Dollars]
![<strong>Table 20-2 Poverty Thresholds in 2002, by Size of Family and Number of Related Children Under 18 Years [Dollars] Source: U. S. Bureau of the Census, Current Population Survey. Refer to Table 20-2.What is the poverty line for a family of six with three children?</strong> A)$21,469 B)$24,797 C)$25,738 D)$28,718 <div style=padding-top: 35px>](https://storage.examlex.com/TB2178/11ea43b2_bcff_7870_a27f_db7bbac2951c_TB2178_00_TB2178_00_TB2178_00_TB2178_00_TB2178_00.jpg)
Source: U. S. Bureau of the Census, Current Population Survey.
Refer to Table 20-2.What is the poverty line for a family of six with three children?
A)$21,469
B)$24,797
C)$25,738
D)$28,718
Poverty Thresholds in 2002, by Size of Family and Number of Related Children Under 18 Years
[Dollars]
Source: U. S. Bureau of the Census, Current Population Survey.
Refer to Table 20-2.What is the poverty line for a family of six with three children?
A)$21,469
B)$24,797
C)$25,738
D)$28,718
Question
Table 20-2
Poverty Thresholds in 2002, by Size of Family and Number of Related Children Under 18 Years
[Dollars]
Source: U. S. Bureau of the Census, Current Population Survey.
Refer to Table 20-2.What is the poverty line for a 75 year old individual?
A)$8,628
B)$9,359
C)$12,353
D)$12,400
Poverty Thresholds in 2002, by Size of Family and Number of Related Children Under 18 Years
[Dollars]
Source: U. S. Bureau of the Census, Current Population Survey.
Refer to Table 20-2.What is the poverty line for a 75 year old individual?
A)$8,628
B)$9,359
C)$12,353
D)$12,400
Question
Table 20-2
Poverty Thresholds in 2002, by Size of Family and Number of Related Children Under 18 Years
[Dollars]
Source: U. S. Bureau of the Census, Current Population Survey.
Refer to Table 20-2.What is the poverty line for a family of eight with two children?
A)$14,494
B)$32,812
C)$33,121
D)$34,780
Poverty Thresholds in 2002, by Size of Family and Number of Related Children Under 18 Years
[Dollars]
Source: U. S. Bureau of the Census, Current Population Survey.
Refer to Table 20-2.What is the poverty line for a family of eight with two children?
A)$14,494
B)$32,812
C)$33,121
D)$34,780
Question
Table 20-2
Poverty Thresholds in 2002, by Size of Family and Number of Related Children Under 18 Years
[Dollars]
Source: U. S. Bureau of the Census, Current Population Survey.
Refer to Table 20-2.What is the poverty line for a family with one 35-year-old adult and one child?
A)$8,628
B)$9,359
C)$12,353
D)$12,400
Question
Figure 20-2
Poverty Rates by Age
Refer to Figure 20-2.In 1968,the percent of elderly aged 65 and over in poverty is
A)higher than both the percentage of adults aged 18 to 64 and the percentage of children under age 18 in poverty.
B)higher than the percentage of adults aged 18 to 64 but is lower than the percentage of children under age 18 in poverty.
C)lower than both the percentage of adults aged 18 to 64 and the percentage of children under age 18 in poverty.
D)is lower than the percentage of adults aged 18 to 64 but is higher than the percentage of children under age 18 in poverty.
Question
Question
Figure 20-2
Poverty Rates by Age
Refer to Figure 20-2.In 2001,the percent of elderly aged 65 and over in poverty is
A)higher than both the percentage of adults aged 18 to 64 and the percentage of children under age 18 in poverty.
B)higher than the percentage of adults aged 18 to 64 but is lower than the percentage of children under age 18 in poverty.
C)lower than both the percentage of adults aged 18 to 64 and the percentage of children under age 18 in poverty.
D)lower than the percentage of children under age 18 but is equal to the percentage of adults aged 18 to 64 in poverty.
Question
Question
Figure 20-2
Poverty Rates by Age
Refer to Figure 20-2.In 2001,the percent of adults between aged 18 and 64 in poverty is
A)higher than both the percentage of children under age 18 and the percentage of elderly aged 65 and over in poverty.
B)higher than the percentage of children under age 18 but is lower than the percentage of elderly aged 65 and over in poverty.
C)is lower than both the percentage of children under age 18 and the percentage of elderly aged 65 and over in poverty.
D)is lower than the percentage of children under age 18 and is equal to the percentage of elderly aged 65 and over in poverty.
Question
Figure 20-2
Poverty Rates by Age
Refer to Figure 20-2.In 2001,the percent of children under age 18 in poverty is
A)higher than both the percentage of adults aged 18 to 64 and the percentage of elderly aged 65 years and over in poverty.
B)higher than the percentage of adults aged 18 to 64 but is lower than the percentage of elderly aged 65 years and over in poverty.
C)lower than both the percentage of adults aged18 to 64 and the percentage of elderly aged 65 years and over in poverty.
D)lower than the percentage of adults aged 18 to 64 but is higher than the percentage of elderly aged 65 years and over in poverty.
Question
Table 20-2
Poverty Thresholds in 2002, by Size of Family and Number of Related Children Under 18 Years
[Dollars]
Source: U. S. Bureau of the Census, Current Population Survey.
Refer to Table 20-2.What is the poverty line for a family of three with one child?
A)$12,072
B)$12,400
C)$14,480
D)$14,494
Poverty Thresholds in 2002, by Size of Family and Number of Related Children Under 18 Years
[Dollars]
Source: U. S. Bureau of the Census, Current Population Survey.
Refer to Table 20-2.What is the poverty line for a family of three with one child?
A)$12,072
B)$12,400
C)$14,480
D)$14,494
Question
Figure 20-1
Number of Poor
Refer to Figure 20-1.Between 1959 and 2001 the poverty rate has
A)increased.
B)decreased.
C)stayed the same.
D)moved in the opposite direction of the number of people in poverty.
Number of Poor
Refer to Figure 20-1.Between 1959 and 2001 the poverty rate has
A)increased.
B)decreased.
C)stayed the same.
D)moved in the opposite direction of the number of people in poverty.

Unlock Deck
Sign up to unlock the cards in this deck!
Unlock Deck
Unlock Deck
1/247
Play
Full screen (f)
Deck 20: Income Inequality and Poverty
1
The government enacts policies to
A)make the distribution of income more efficient.
B)make the distribution of income more fair.
C)maximize the use of the welfare system.
D)minimize the use of in-kind transfers.
A)make the distribution of income more efficient.
B)make the distribution of income more fair.
C)maximize the use of the welfare system.
D)minimize the use of in-kind transfers.
B
2
In 2003,what percentage of U.S.families had income levels below $98,200?
A)5 percent
B)20 percent
C)80 percent
D)95 percent
A)5 percent
B)20 percent
C)80 percent
D)95 percent
C
3
Based on data from 2003,approximately what percent of all income in the United States did the top fifth of all families receive?
A)78 percent
B)48 percent
C)21 percent
D)4 percent
A)78 percent
B)48 percent
C)21 percent
D)4 percent
B
4
Government programs that take money from high-income people and give it to low-income people typically
A)improve economic efficiency by reducing poverty.
B)reduce economic efficiency because they distort incentives.
C)have no effect on economic efficiency because they both reduce poverty and distort incentives.
D)sometimes improve, sometimes reduce, and sometimes have no effect on economic efficiency.
Unlock Deck
Unlock for access to all 247 flashcards in this deck.
Unlock Deck
k this deck
5
When measuring income distribution in the United States,the income share of the top fifth of all families is
A)over 50 percent.
B)more than 10 times the income of the bottom fifth.
C)around 25 percent.
D)not much different from the income of the top 5 percent.
A)over 50 percent.
B)more than 10 times the income of the bottom fifth.
C)around 25 percent.
D)not much different from the income of the top 5 percent.
Unlock Deck
Unlock for access to all 247 flashcards in this deck.
Unlock Deck
k this deck
6
Why is it difficult to compare household income distributions among countries?
A)Countries collect data in different ways.
B)Some countries collect data on expenditures instead of incomes.
C)The task is not difficult because international agreements require countries to standardize their income accounting procedures.
D)Both a and b are correct.
A)Countries collect data in different ways.
B)Some countries collect data on expenditures instead of incomes.
C)The task is not difficult because international agreements require countries to standardize their income accounting procedures.
D)Both a and b are correct.
Unlock Deck
Unlock for access to all 247 flashcards in this deck.
Unlock Deck
k this deck
7
When the government redistributes income to achieve greater equality,it
A)distorts incentives.
B)improves allocative efficiency.
C)focuses on illegal immigrants.
D)relies on foreign aid to help balance the budget.
A)distorts incentives.
B)improves allocative efficiency.
C)focuses on illegal immigrants.
D)relies on foreign aid to help balance the budget.
Unlock Deck
Unlock for access to all 247 flashcards in this deck.
Unlock Deck
k this deck
8
When a government enacts policies that redistribute income,which of the following will not occur?
A)The government will distort incentives.
B)Income will be fairly distributed.
C)People will alter their market behaviors.
D)Markets will become less efficient at allocating resources to their highest valued use.
A)The government will distort incentives.
B)Income will be fairly distributed.
C)People will alter their market behaviors.
D)Markets will become less efficient at allocating resources to their highest valued use.
Unlock Deck
Unlock for access to all 247 flashcards in this deck.
Unlock Deck
k this deck
9
Economists study poverty and income inequality in order to answer which of the following questions?
A)What are people's wages?
B)How does labor-force experience affect wages?
C)How much inequality is there in society?
D)How do people adjust their behavior due to taxation?
A)What are people's wages?
B)How does labor-force experience affect wages?
C)How much inequality is there in society?
D)How do people adjust their behavior due to taxation?
Unlock Deck
Unlock for access to all 247 flashcards in this deck.
Unlock Deck
k this deck
10
A government's policy of redistributing income makes the income distribution more equitable,
A)distorts incentives, and makes the allocation of resources more efficient.
B)alters behavior, and makes the allocation of resources more efficient.
C)distorts incentives but does not alter behavior.
D)distorts incentives, and makes the allocation of resources less efficient.
A)distorts incentives, and makes the allocation of resources more efficient.
B)alters behavior, and makes the allocation of resources more efficient.
C)distorts incentives but does not alter behavior.
D)distorts incentives, and makes the allocation of resources less efficient.
Unlock Deck
Unlock for access to all 247 flashcards in this deck.
Unlock Deck
k this deck
11
Income inequality in an economy is traditionally measured by
A)using a Bell curve.
B)calculating the percentage of families that fall into broad income classifications.
C)referring to standard international distribution tables.
D)using a Poisson distribution.
A)using a Bell curve.
B)calculating the percentage of families that fall into broad income classifications.
C)referring to standard international distribution tables.
D)using a Poisson distribution.
Unlock Deck
Unlock for access to all 247 flashcards in this deck.
Unlock Deck
k this deck
12
Based on U.S.income data from 2003,approximately what percent of all income did the bottom fifth of all families receive?
A)48 percent
B)21 percent
C)10 percent
D)4 percent
A)48 percent
B)21 percent
C)10 percent
D)4 percent
Unlock Deck
Unlock for access to all 247 flashcards in this deck.
Unlock Deck
k this deck
13
The marketplace acts to allocate resources
A)fairly.
B)to those most desiring them.
C)efficiently.
D)both efficiently and equitably.
A)fairly.
B)to those most desiring them.
C)efficiently.
D)both efficiently and equitably.
Unlock Deck
Unlock for access to all 247 flashcards in this deck.
Unlock Deck
k this deck
14
The invisible hand of the marketplace acts to allocate resources
A)efficiently but does not necessarily ensure that resources are allocated fairly.
B)both fairly and efficiently.
C)fairly but does not necessarily ensure that resources are allocated efficiently.
D)neither fairly nor efficiently.
A)efficiently but does not necessarily ensure that resources are allocated fairly.
B)both fairly and efficiently.
C)fairly but does not necessarily ensure that resources are allocated efficiently.
D)neither fairly nor efficiently.
Unlock Deck
Unlock for access to all 247 flashcards in this deck.
Unlock Deck
k this deck
15
Labor earnings make up what part of total income in the U.S.economy?
A)all of it
B)three-fourths
C)one-half
D)one-fourth
A)all of it
B)three-fourths
C)one-half
D)one-fourth
Unlock Deck
Unlock for access to all 247 flashcards in this deck.
Unlock Deck
k this deck
16
In the United States,labor earnings are what percent of total income?
A)75 percent
B)70 percent
C)65 percent
D)50 percent
A)75 percent
B)70 percent
C)65 percent
D)50 percent
Unlock Deck
Unlock for access to all 247 flashcards in this deck.
Unlock Deck
k this deck
17
When the government enacts policies to make the distribution of income more equitable,which of the following occurs?
A)a less efficient allocation of resources
B)a distortion of incentives
C)altered behavior
D)All of the above are correct.
A)a less efficient allocation of resources
B)a distortion of incentives
C)altered behavior
D)All of the above are correct.
Unlock Deck
Unlock for access to all 247 flashcards in this deck.
Unlock Deck
k this deck
18
Which of the following is not a question that economists try to answer when measuring the distribution of income?
A)How much inequality is there in our society?
B)How many people live in poverty?
C)How often do people receive raises?
D)What problems arise in measuring the amount of inequality?
A)How much inequality is there in our society?
B)How many people live in poverty?
C)How often do people receive raises?
D)What problems arise in measuring the amount of inequality?
Unlock Deck
Unlock for access to all 247 flashcards in this deck.
Unlock Deck
k this deck
19
Based on U.S.income data from 2003,the top fifth of all families received
A)more than 10 times more income than the bottom fifth.
B)approximately 5 times more income than the bottom fifth.
C)twice as much income as the bottom fifth.
D)an equal share of income as the bottom fifth.
A)more than 10 times more income than the bottom fifth.
B)approximately 5 times more income than the bottom fifth.
C)twice as much income as the bottom fifth.
D)an equal share of income as the bottom fifth.
Unlock Deck
Unlock for access to all 247 flashcards in this deck.
Unlock Deck
k this deck
20
U.S.income data over the last sixty years suggests that the distribution of income
A)has gradually become more equal over the entire time period.
B)has gradually become less equal over the entire time period.
C)gradually became less equal until about 1970, then became more equal from 1970 to 2003.
D)gradually became more equal until about 1970, then became less equal from 1970 to 2003.
Unlock Deck
Unlock for access to all 247 flashcards in this deck.
Unlock Deck
k this deck
21
Worldwide economic growth has
A)increased inequality among individuals worldwide.
B)benefited wealthier nations at the expense of poorer nations.
C)reduced the number of people living in extreme poverty.
D)Both a and b are correct.
A)increased inequality among individuals worldwide.
B)benefited wealthier nations at the expense of poorer nations.
C)reduced the number of people living in extreme poverty.
D)Both a and b are correct.
Unlock Deck
Unlock for access to all 247 flashcards in this deck.
Unlock Deck
k this deck
22
A commonly-used gauge of poverty is the
A)income inequality rate.
B)average income rate.
C)poverty rate.
D)social inequality rate.
A)income inequality rate.
B)average income rate.
C)poverty rate.
D)social inequality rate.
Unlock Deck
Unlock for access to all 247 flashcards in this deck.
Unlock Deck
k this deck
23
On average,the distribution of income tends to be
A)less equal in richer countries than in poorer countries.
B)more equal in richer countries than in poorer countries.
C)similar between richer and poorer countries.
D)random across richer and poorer countries.
A)less equal in richer countries than in poorer countries.
B)more equal in richer countries than in poorer countries.
C)similar between richer and poorer countries.
D)random across richer and poorer countries.
Unlock Deck
Unlock for access to all 247 flashcards in this deck.
Unlock Deck
k this deck
24
The poverty rate is
A)a measure of income inequality across families.
B)the percentage of the population whose family income falls below a specified level.
C)an absolute level of income set by the federal government for each family size.
D)measured by the number of in-kind transfers that a family receives.
A)a measure of income inequality across families.
B)the percentage of the population whose family income falls below a specified level.
C)an absolute level of income set by the federal government for each family size.
D)measured by the number of in-kind transfers that a family receives.
Unlock Deck
Unlock for access to all 247 flashcards in this deck.
Unlock Deck
k this deck
25
Which of the following represents a problem in measuring inequality?
A)Measurements of income distributions typically include in-kind transfers, which distort the measure of inequality.
B)A normal life-cycle pattern causes inequality in the income distribution but may not reflect inequality in living standards.
C)Transitory income is a better measure of inequality than permanent income.
D)Both a and b are correct.
Unlock Deck
Unlock for access to all 247 flashcards in this deck.
Unlock Deck
k this deck
26
Which of the following is not correct?
A)Measurements of income inequality usually do not include in-kind transfers.
B)Measurements of income inequality use lifetime incomes rather than annual incomes.
C)Measurements of income inequality would be more meaningful if they reflected permanent rather than current income.
D)Poverty is long-term problem for relatively few families.
Unlock Deck
Unlock for access to all 247 flashcards in this deck.
Unlock Deck
k this deck
27
Which of the following does not explain the rise in income inequality from 1970 to 2003?
A)increased international trade with low-wage countries
B)changes in technology
C)a reduction in the demand for unskilled labor
D)an increase in minimum wages
A)increased international trade with low-wage countries
B)changes in technology
C)a reduction in the demand for unskilled labor
D)an increase in minimum wages
Unlock Deck
Unlock for access to all 247 flashcards in this deck.
Unlock Deck
k this deck
28
Which of the following is associated with worldwide economic growth?
A)A decrease in individual income inequality worldwide.
B)An increase in free trade.
C)The establishment of stronger property rights.
D)All of the above are correct.
A)A decrease in individual income inequality worldwide.
B)An increase in free trade.
C)The establishment of stronger property rights.
D)All of the above are correct.
Unlock Deck
Unlock for access to all 247 flashcards in this deck.
Unlock Deck
k this deck
29
If income were equally distributed among households,
A)each household's relative share of income would increase.
B)each household's relative share of income would decrease.
C)50 percent of the households would receive exactly 50 percent of the income.
D)the rich would become richer, the poor would become poorer.
A)each household's relative share of income would increase.
B)each household's relative share of income would decrease.
C)50 percent of the households would receive exactly 50 percent of the income.
D)the rich would become richer, the poor would become poorer.
Unlock Deck
Unlock for access to all 247 flashcards in this deck.
Unlock Deck
k this deck
30
The United States has relatively greater income
A)inequality than developing countries but greater equality than other developed countries.
B)inequality than both developing and other developed countries.
C)equality than developing countries but greater inequality than other developed countries.
D)equality than both developing and other developed countries.
Unlock Deck
Unlock for access to all 247 flashcards in this deck.
Unlock Deck
k this deck
31
When we compare the income distribution of the United States to those of other countries,we find that the U.S.
A)has one of the most unequal income distributions.
B)has one of the most equal income distributions.
C)ranks in the middle of the group.
D)is second to China as the most unequal distribution.
A)has one of the most unequal income distributions.
B)has one of the most equal income distributions.
C)ranks in the middle of the group.
D)is second to China as the most unequal distribution.
Unlock Deck
Unlock for access to all 247 flashcards in this deck.
Unlock Deck
k this deck
32
Over the past 50 years,the U.S.poverty rate was at its lowest level in
A)1973.
B)1983.
C)1993.
D)2003.
A)1973.
B)1983.
C)1993.
D)2003.
Unlock Deck
Unlock for access to all 247 flashcards in this deck.
Unlock Deck
k this deck
33
The poverty rate is based on a family's
A)income, in-kind transfers, and other government aid.
B)income and in-kind transfers.
C)in-kind transfers only.
D)income only.
A)income, in-kind transfers, and other government aid.
B)income and in-kind transfers.
C)in-kind transfers only.
D)income only.
Unlock Deck
Unlock for access to all 247 flashcards in this deck.
Unlock Deck
k this deck
34
Based on U.S.data for 2003,the poverty rate is the highest for which group of people?
A)children
B)married couples
C)female households, no spouse present
D)the elderly
A)children
B)married couples
C)female households, no spouse present
D)the elderly
Unlock Deck
Unlock for access to all 247 flashcards in this deck.
Unlock Deck
k this deck
35
In 2003,the poverty rate in the United States was approximately
A)2.5 percent.
B)12.5 percent.
C)20 percent.
D)50 percent.
A)2.5 percent.
B)12.5 percent.
C)20 percent.
D)50 percent.
Unlock Deck
Unlock for access to all 247 flashcards in this deck.
Unlock Deck
k this deck
36
The poverty rate is a measure of the percentage of people whose incomes fall below
A)an absolute level of income.
B)the median income for a family of three.
C)a relative level of income.
D)the bottom 20 percent of the income distribution.
A)an absolute level of income.
B)the median income for a family of three.
C)a relative level of income.
D)the bottom 20 percent of the income distribution.
Unlock Deck
Unlock for access to all 247 flashcards in this deck.
Unlock Deck
k this deck
37
Worldwide economic growth has
A)reduced poverty, even in very poor countries.
B)led to rising literacy rates and falling child labor rates.
C)reduced inequality among individuals worldwide.
D)All of the above are correct.
A)reduced poverty, even in very poor countries.
B)led to rising literacy rates and falling child labor rates.
C)reduced inequality among individuals worldwide.
D)All of the above are correct.
Unlock Deck
Unlock for access to all 247 flashcards in this deck.
Unlock Deck
k this deck
38
Table 20-1
Refer to Table 20-1.Seventy-five percent of all families have incomes below what level?
A)$28,000
B)$50,000
C)$85,000
D)There is insufficient information to answer this question.
Refer to Table 20-1.Seventy-five percent of all families have incomes below what level?
A)$28,000
B)$50,000
C)$85,000
D)There is insufficient information to answer this question.
Unlock Deck
Unlock for access to all 247 flashcards in this deck.
Unlock Deck
k this deck
39
In 2003,what percentage of U.S.families had income levels above $98,200?
A)5 percent
B)20 percent
C)80 percent
D)95 percent
A)5 percent
B)20 percent
C)80 percent
D)95 percent
Unlock Deck
Unlock for access to all 247 flashcards in this deck.
Unlock Deck
k this deck
40
The country that has the highest degree of income inequality is
A)the United States.
B)Germany.
C)Russia.
D)South Africa.
A)the United States.
B)Germany.
C)Russia.
D)South Africa.
Unlock Deck
Unlock for access to all 247 flashcards in this deck.
Unlock Deck
k this deck
41
The poverty line is adjusted each year to reflect changes in the
A)number of people currently on public assistance.
B)level of prices.
C)nutritional content of an "adequate" diet.
D)size of a family.
A)number of people currently on public assistance.
B)level of prices.
C)nutritional content of an "adequate" diet.
D)size of a family.
Unlock Deck
Unlock for access to all 247 flashcards in this deck.
Unlock Deck
k this deck
42
The poverty line in the country of Grinnell is $10,000.The distribution of income for Grinnell is as follows:
The poverty rate in Grinnell is
A)5 percent.
B)16.7 percent.
C)50 percent.
D)83.3 percent.
The poverty rate in Grinnell is
A)5 percent.
B)16.7 percent.
C)50 percent.
D)83.3 percent.
Unlock Deck
Unlock for access to all 247 flashcards in this deck.
Unlock Deck
k this deck
43
The poverty line in the country of Abbyville is $15,000.The distribution of income for Abbyville is as follows:
The poverty rate in Abbyville is
A)12 percent.
B)32 percent.
C)50 percent.
D)68 percent.
The poverty rate in Abbyville is
A)12 percent.
B)32 percent.
C)50 percent.
D)68 percent.
Unlock Deck
Unlock for access to all 247 flashcards in this deck.
Unlock Deck
k this deck
44
Measures of poverty that fail to account for the value of in-kind transfers
A)understate the actual poverty rate.
B)have little effect on the validity of reported poverty rates.
C)are generally more reliable measures of actual poverty rates.
D)overstate the actual poverty rate.
A)understate the actual poverty rate.
B)have little effect on the validity of reported poverty rates.
C)are generally more reliable measures of actual poverty rates.
D)overstate the actual poverty rate.
Unlock Deck
Unlock for access to all 247 flashcards in this deck.
Unlock Deck
k this deck
45
Which of the following groups has the highest poverty rate?
A)blacks
B)Asians, Pacific Islanders
C)children (under age 18)
D)female-headed households
A)blacks
B)Asians, Pacific Islanders
C)children (under age 18)
D)female-headed households
Unlock Deck
Unlock for access to all 247 flashcards in this deck.
Unlock Deck
k this deck
46
The poverty line in the country of Equalia is $10,000.The distribution of income for Equalia is as follows:
The poverty rate in Equalia is
A)11.1 percent.
B)16.7 percent.
C)27.8 percent.
D)55.5 percent.
The poverty rate in Equalia is
A)11.1 percent.
B)16.7 percent.
C)27.8 percent.
D)55.5 percent.
Unlock Deck
Unlock for access to all 247 flashcards in this deck.
Unlock Deck
k this deck
47
In 2003,the poverty line for a family of four in the U.S.was approximately
A)$56,680.
B)$24,400.
C)$18,810.
D)$12,603.
A)$56,680.
B)$24,400.
C)$18,810.
D)$12,603.
Unlock Deck
Unlock for access to all 247 flashcards in this deck.
Unlock Deck
k this deck
48
Measuring poverty using an absolute income scale like the poverty line can be misleading because
A)income measures do not include the value of in-kind transfers.
B)money is more highly valued by the poor than by the rich.
C)the poor are not likely to participate in the labor market.
D)income measures are not adjusted for the effects of labor-market discrimination.
A)income measures do not include the value of in-kind transfers.
B)money is more highly valued by the poor than by the rich.
C)the poor are not likely to participate in the labor market.
D)income measures are not adjusted for the effects of labor-market discrimination.
Unlock Deck
Unlock for access to all 247 flashcards in this deck.
Unlock Deck
k this deck
49
The poverty line calculation includes adjustments for
A)transportation costs.
B)child care costs.
C)the level of prices.
D)the Earned Income Tax Credit.
A)transportation costs.
B)child care costs.
C)the level of prices.
D)the Earned Income Tax Credit.
Unlock Deck
Unlock for access to all 247 flashcards in this deck.
Unlock Deck
k this deck
50
If the U.S.government determines that the cost of feeding an urban family of six is $6,000 per year,then the official poverty line for a family of that type is
A)$6,000.
B)$12,000.
C)$18,000.
D)$36,000.
A)$6,000.
B)$12,000.
C)$18,000.
D)$36,000.
Unlock Deck
Unlock for access to all 247 flashcards in this deck.
Unlock Deck
k this deck
51
In 2003,the poverty rate in the United States was 12.5 percent.This means that 12.5 percent
A)of the population had a total family income that fell below the poverty line.
B)of the population had a total family income that was above the poverty line.
C)of the population had individual adjusted gross income below the poverty rate.
D)of children were poor.
A)of the population had a total family income that fell below the poverty line.
B)of the population had a total family income that was above the poverty line.
C)of the population had individual adjusted gross income below the poverty rate.
D)of children were poor.
Unlock Deck
Unlock for access to all 247 flashcards in this deck.
Unlock Deck
k this deck
52
The poverty line is not adjusted for which of the following?
A)food stamps
B)regional cost-of-living differences
C)Earned Income Tax Credit
D)All of the above are correct.
A)food stamps
B)regional cost-of-living differences
C)Earned Income Tax Credit
D)All of the above are correct.
Unlock Deck
Unlock for access to all 247 flashcards in this deck.
Unlock Deck
k this deck
53
The income level below which families are said to be poor is known as the
A)income maintenance threshold.
B)poverty line.
C)bottom quintile of the income distribution.
D)minimum wage.
A)income maintenance threshold.
B)poverty line.
C)bottom quintile of the income distribution.
D)minimum wage.
Unlock Deck
Unlock for access to all 247 flashcards in this deck.
Unlock Deck
k this deck
54
The poverty line reflects an annual income equal to approximately
A)five times the cost of providing an adequate diet.
B)four times the cost of providing an adequate diet.
C)three times the cost of providing an adequate diet.
D)two times the cost of providing an adequate diet.
A)five times the cost of providing an adequate diet.
B)four times the cost of providing an adequate diet.
C)three times the cost of providing an adequate diet.
D)two times the cost of providing an adequate diet.
Unlock Deck
Unlock for access to all 247 flashcards in this deck.
Unlock Deck
k this deck
55
The poverty line in the country of Spencerville is $20,000.The distribution of income for Spencerville is as follows:
The poverty rate in Spencerville is
A)15 percent.
B)33.3 percent.
C)50 percent.
D)66.7 percent.
The poverty rate in Spencerville is
A)15 percent.
B)33.3 percent.
C)50 percent.
D)66.7 percent.
Unlock Deck
Unlock for access to all 247 flashcards in this deck.
Unlock Deck
k this deck
56
Since the early 1970s,average incomes have
A)increased, which has reduced the poverty rate.
B)increased, yet the poverty rate has not decreased appreciably.
C)decreased, while the poverty rate has remained unchanged.
D)remained relatively unchanged, while the poverty rate has decreased.
A)increased, which has reduced the poverty rate.
B)increased, yet the poverty rate has not decreased appreciably.
C)decreased, while the poverty rate has remained unchanged.
D)remained relatively unchanged, while the poverty rate has decreased.
Unlock Deck
Unlock for access to all 247 flashcards in this deck.
Unlock Deck
k this deck
57
Which of the following statements is correct?
A)The poverty line is a relative standard.
B)Economic growth that raises all incomes will decrease the number of families in poverty.
C)Increasing income inequality reduces poverty.
D)Economic growth, by definition, affects all families equally.
A)The poverty line is a relative standard.
B)Economic growth that raises all incomes will decrease the number of families in poverty.
C)Increasing income inequality reduces poverty.
D)Economic growth, by definition, affects all families equally.
Unlock Deck
Unlock for access to all 247 flashcards in this deck.
Unlock Deck
k this deck
58
The poverty line is
A)an absolute level of income set by the federal government below which a family is considered to be in poverty.
B)approximately equal to three times the cost of providing an adequate diet.
C)adjusted annually to reflect changes in price levels.
D)All of the above are correct.
A)an absolute level of income set by the federal government below which a family is considered to be in poverty.
B)approximately equal to three times the cost of providing an adequate diet.
C)adjusted annually to reflect changes in price levels.
D)All of the above are correct.
Unlock Deck
Unlock for access to all 247 flashcards in this deck.
Unlock Deck
k this deck
59
Poverty is found to be correlated with
A)age and race but not family composition.
B)race only.
C)race and family composition but not age.
D)age, race, and family composition.
A)age and race but not family composition.
B)race only.
C)race and family composition but not age.
D)age, race, and family composition.
Unlock Deck
Unlock for access to all 247 flashcards in this deck.
Unlock Deck
k this deck
60
The percentage of families with incomes below the poverty line
A)is defined as the 10 percent of U.S.households with the lowest incomes.
B)is known as the poverty rate.
C)is known as the unemployment rate.
D)rises as the general income level rises.
A)is defined as the 10 percent of U.S.households with the lowest incomes.
B)is known as the poverty rate.
C)is known as the unemployment rate.
D)rises as the general income level rises.
Unlock Deck
Unlock for access to all 247 flashcards in this deck.
Unlock Deck
k this deck
61
Which of the following individuals would be statistically most likely to be poor?
A)an elderly black woman
B)an white child living with married parents
C)a Hispanic child living with married parents
D)a black child living with his mother in a female-headed household
A)an elderly black woman
B)an white child living with married parents
C)a Hispanic child living with married parents
D)a black child living with his mother in a female-headed household
Unlock Deck
Unlock for access to all 247 flashcards in this deck.
Unlock Deck
k this deck
62
Which of the following is not an example of in-kind transfers?
A)food stamps
B)Medicare
C)the Earned Income Tax Credit
D)housing vouchers
A)food stamps
B)Medicare
C)the Earned Income Tax Credit
D)housing vouchers
Unlock Deck
Unlock for access to all 247 flashcards in this deck.
Unlock Deck
k this deck
63
Figure 20-1
Number of Poor
Refer to Figure 20-1.The absolute number of people in poverty
A)is higher in 2001 than in 1959.
B)is lower in 2001 than in 1959.
C)has not changed between 1959 and 2001.
D)has steadily decreased between 1959 and 2001.
Number of Poor
Refer to Figure 20-1.The absolute number of people in poverty
A)is higher in 2001 than in 1959.
B)is lower in 2001 than in 1959.
C)has not changed between 1959 and 2001.
D)has steadily decreased between 1959 and 2001.
Unlock Deck
Unlock for access to all 247 flashcards in this deck.
Unlock Deck
k this deck
64
Figure 20-2
Poverty Rates by Age
Refer to Figure 20-2.In 1968,the percent of adults aged 18 to 64 years in poverty is
A)higher than both the percentage of children under age 18 and the percentage of elderly aged 65 and over in poverty.
B)higher than the percentage of children under age 18 but is lower than the percentage of elderly aged 65 and over in poverty.
C)is lower than both the percentage of children under age 18 and the percentage of elderly aged 65 and over in poverty.
D)is lower than the percentage of children under age 18 but is higher than the percentage of elderly aged 65 and over in poverty.
Unlock Deck
Unlock for access to all 247 flashcards in this deck.
Unlock Deck
k this deck
65
Figure 20-2
Poverty Rates by Age
Refer to Figure 20-2.In 1968,the percent of children under age 18 in poverty is
A)higher than both the percentage of adults aged 18 to 64 and the percentage of elderly aged 65 and over in poverty.
B)higher than the percentage of adults aged 18 to 64 but is lower than the percentage of elderly aged 65 and over in poverty.
C)lower than both the percentage of adults aged 18 to 64 and the percentage of elderly aged 65 and over in poverty.
D)lower than the percentage of adults aged 18 to 64 but is higher than the percentage of elderly aged 65 and over in poverty.
Unlock Deck
Unlock for access to all 247 flashcards in this deck.
Unlock Deck
k this deck
66
Figure 20-2
Poverty Rates by Age
Refer to Figure 20-2.From 1969 to 2001,the percent of elderly aged 64 and over in poverty has
A)declined, while the percentage of children under age 18 in poverty has also declined.
B)declined, while the percentage of children under age 18 in poverty has increased.
C)increased, while the percentage of children under age 18 in poverty has declined.
D)increased, while the percentage of children under age 18 in poverty has also increased.
Unlock Deck
Unlock for access to all 247 flashcards in this deck.
Unlock Deck
k this deck
67
Figure 20-1
Number of Poor
Refer to Figure 20-1.Between 1965 and 2001,during recessions (the shaded bars)the number of individuals in poverty has
A)increased.
B)decrease.
C)not changed.
D)decreased and then increased.
Number of Poor
Refer to Figure 20-1.Between 1965 and 2001,during recessions (the shaded bars)the number of individuals in poverty has
A)increased.
B)decrease.
C)not changed.
D)decreased and then increased.
Unlock Deck
Unlock for access to all 247 flashcards in this deck.
Unlock Deck
k this deck
68
In comparison to the average poverty rate,
A)children and the elderly are more likely to be poor.
B)Children and the elderly are less likely to be poor.
C)Children are more likely to be poor, but the elderly are less likely to be poor.
D)Children are less likely to be poor, but the elderly are more likely to be poor.
A)children and the elderly are more likely to be poor.
B)Children and the elderly are less likely to be poor.
C)Children are more likely to be poor, but the elderly are less likely to be poor.
D)Children are less likely to be poor, but the elderly are more likely to be poor.
Unlock Deck
Unlock for access to all 247 flashcards in this deck.
Unlock Deck
k this deck
69
Table 20-2
Poverty Thresholds in 2002, by Size of Family and Number of Related Children Under 18 Years
[Dollars]
Source: U. S. Bureau of the Census, Current Population Survey.
Refer to Table 20-2.What is the poverty line for a family of six with three children?
A)$21,469
B)$24,797
C)$25,738
D)$28,718
Poverty Thresholds in 2002, by Size of Family and Number of Related Children Under 18 Years
[Dollars]
Source: U. S. Bureau of the Census, Current Population Survey.
Refer to Table 20-2.What is the poverty line for a family of six with three children?
A)$21,469
B)$24,797
C)$25,738
D)$28,718
Unlock Deck
Unlock for access to all 247 flashcards in this deck.
Unlock Deck
k this deck
70
Table 20-2
Poverty Thresholds in 2002, by Size of Family and Number of Related Children Under 18 Years
[Dollars]
Source: U. S. Bureau of the Census, Current Population Survey.
Refer to Table 20-2.What is the poverty line for a 75 year old individual?
A)$8,628
B)$9,359
C)$12,353
D)$12,400
Poverty Thresholds in 2002, by Size of Family and Number of Related Children Under 18 Years
[Dollars]
Source: U. S. Bureau of the Census, Current Population Survey.
Refer to Table 20-2.What is the poverty line for a 75 year old individual?
A)$8,628
B)$9,359
C)$12,353
D)$12,400
Unlock Deck
Unlock for access to all 247 flashcards in this deck.
Unlock Deck
k this deck
71
Table 20-2
Poverty Thresholds in 2002, by Size of Family and Number of Related Children Under 18 Years
[Dollars]
Source: U. S. Bureau of the Census, Current Population Survey.
Refer to Table 20-2.What is the poverty line for a family of eight with two children?
A)$14,494
B)$32,812
C)$33,121
D)$34,780
Poverty Thresholds in 2002, by Size of Family and Number of Related Children Under 18 Years
[Dollars]
Source: U. S. Bureau of the Census, Current Population Survey.
Refer to Table 20-2.What is the poverty line for a family of eight with two children?
A)$14,494
B)$32,812
C)$33,121
D)$34,780
Unlock Deck
Unlock for access to all 247 flashcards in this deck.
Unlock Deck
k this deck
72
Table 20-2
Poverty Thresholds in 2002, by Size of Family and Number of Related Children Under 18 Years
[Dollars]
Source: U. S. Bureau of the Census, Current Population Survey.
Refer to Table 20-2.What is the poverty line for a family with one 35-year-old adult and one child?
A)$8,628
B)$9,359
C)$12,353
D)$12,400
Unlock Deck
Unlock for access to all 247 flashcards in this deck.
Unlock Deck
k this deck
73
Figure 20-2
Poverty Rates by Age
Refer to Figure 20-2.In 1968,the percent of elderly aged 65 and over in poverty is
A)higher than both the percentage of adults aged 18 to 64 and the percentage of children under age 18 in poverty.
B)higher than the percentage of adults aged 18 to 64 but is lower than the percentage of children under age 18 in poverty.
C)lower than both the percentage of adults aged 18 to 64 and the percentage of children under age 18 in poverty.
D)is lower than the percentage of adults aged 18 to 64 but is higher than the percentage of children under age 18 in poverty.
Unlock Deck
Unlock for access to all 247 flashcards in this deck.
Unlock Deck
k this deck
74
If the value of in-kind transfers are taken into account,the number of families living in poverty in the United States would
A)increase by about 1 percent.
B)decrease by about 1 percent.
C)decrease by about 5 percent.
D)decrease by about 10 percent.
A)increase by about 1 percent.
B)decrease by about 1 percent.
C)decrease by about 5 percent.
D)decrease by about 10 percent.
Unlock Deck
Unlock for access to all 247 flashcards in this deck.
Unlock Deck
k this deck
75
Figure 20-2
Poverty Rates by Age
Refer to Figure 20-2.In 2001,the percent of elderly aged 65 and over in poverty is
A)higher than both the percentage of adults aged 18 to 64 and the percentage of children under age 18 in poverty.
B)higher than the percentage of adults aged 18 to 64 but is lower than the percentage of children under age 18 in poverty.
C)lower than both the percentage of adults aged 18 to 64 and the percentage of children under age 18 in poverty.
D)lower than the percentage of children under age 18 but is equal to the percentage of adults aged 18 to 64 in poverty.
Unlock Deck
Unlock for access to all 247 flashcards in this deck.
Unlock Deck
k this deck
76
Poverty is correlated with
A)race.
B)age.
C)family composition.
D)All of the above are correct.
A)race.
B)age.
C)family composition.
D)All of the above are correct.
Unlock Deck
Unlock for access to all 247 flashcards in this deck.
Unlock Deck
k this deck
77
Figure 20-2
Poverty Rates by Age
Refer to Figure 20-2.In 2001,the percent of adults between aged 18 and 64 in poverty is
A)higher than both the percentage of children under age 18 and the percentage of elderly aged 65 and over in poverty.
B)higher than the percentage of children under age 18 but is lower than the percentage of elderly aged 65 and over in poverty.
C)is lower than both the percentage of children under age 18 and the percentage of elderly aged 65 and over in poverty.
D)is lower than the percentage of children under age 18 and is equal to the percentage of elderly aged 65 and over in poverty.
Unlock Deck
Unlock for access to all 247 flashcards in this deck.
Unlock Deck
k this deck
78
Figure 20-2
Poverty Rates by Age
Refer to Figure 20-2.In 2001,the percent of children under age 18 in poverty is
A)higher than both the percentage of adults aged 18 to 64 and the percentage of elderly aged 65 years and over in poverty.
B)higher than the percentage of adults aged 18 to 64 but is lower than the percentage of elderly aged 65 years and over in poverty.
C)lower than both the percentage of adults aged18 to 64 and the percentage of elderly aged 65 years and over in poverty.
D)lower than the percentage of adults aged 18 to 64 but is higher than the percentage of elderly aged 65 years and over in poverty.
Unlock Deck
Unlock for access to all 247 flashcards in this deck.
Unlock Deck
k this deck
79
Table 20-2
Poverty Thresholds in 2002, by Size of Family and Number of Related Children Under 18 Years
[Dollars]
Source: U. S. Bureau of the Census, Current Population Survey.
Refer to Table 20-2.What is the poverty line for a family of three with one child?
A)$12,072
B)$12,400
C)$14,480
D)$14,494
Poverty Thresholds in 2002, by Size of Family and Number of Related Children Under 18 Years
[Dollars]
Source: U. S. Bureau of the Census, Current Population Survey.
Refer to Table 20-2.What is the poverty line for a family of three with one child?
A)$12,072
B)$12,400
C)$14,480
D)$14,494
Unlock Deck
Unlock for access to all 247 flashcards in this deck.
Unlock Deck
k this deck
80
Figure 20-1
Number of Poor
Refer to Figure 20-1.Between 1959 and 2001 the poverty rate has
A)increased.
B)decreased.
C)stayed the same.
D)moved in the opposite direction of the number of people in poverty.
Number of Poor
Refer to Figure 20-1.Between 1959 and 2001 the poverty rate has
A)increased.
B)decreased.
C)stayed the same.
D)moved in the opposite direction of the number of people in poverty.
Unlock Deck
Unlock for access to all 247 flashcards in this deck.
Unlock Deck
k this deck
Unlock Deck
Unlock for access to all 247 flashcards in this deck.


