Deck 16: Growth of Populations
Full screen (f)
Question
According to the figure shown,human populations began to experience exponential growth around 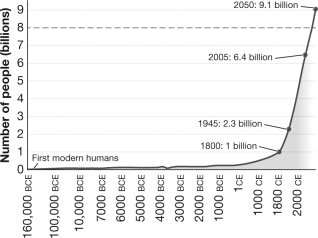
A)160,000 BCE
B)1800
C)1945
D)2005
A)160,000 BCE
B)1800
C)1945
D)2005
Question
Question
Question
Question
Question
Question
Question
Question
Question
Which of the following statements accurately describes information shown in this figure? 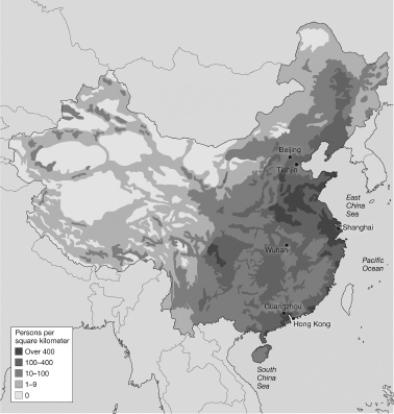
A)The population size in China is over 400 million people.
B)The population size in China has increased most quickly in eastern China.
C)The population density is highest in western China.
D)The population density is highest along the eastern coast of China.
A)The population size in China is over 400 million people.
B)The population size in China has increased most quickly in eastern China.
C)The population density is highest in western China.
D)The population density is highest along the eastern coast of China.
Question
Question
Question
Question
Question
According to the figure shown,human populations are projected to reach carrying capacity in approximately ________ years. 
A)15
B)35
C)75
D)85
A)15
B)35
C)75
D)85
Question
Question
Question
Question
Question
Question
Question
This figure shows that the human population was small and relatively stable for nearly 12,000 years but has increased dramatically in the past 200 years.How might this increase in population growth be explained? 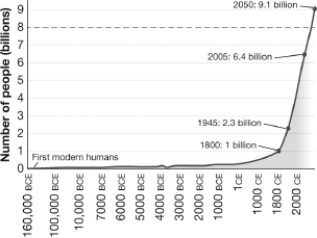
A)Disease prevented any significant growth of the human population.
B)For most of human history people were too malnourished to have children.
C)People simply chose to have fewer children in the past than at present.
D)Prior human populations were at existing carrying capacities but newly developed technologies have raised the carrying capacity and permitted the recent expansion.
Question
This graph shows the growth of a population of Paramecium caudatum.The greatest amount of daily growth occurred when the population was at approximately ________ percent of its carrying capacity. 
A)10
B)25
C)50
D)100
A)10
B)25
C)50
D)100
Question
Question
Question
The carrying capacity for Paramecia caudatum as shown in this figure is 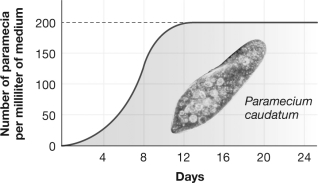
A)12 days.
B)200/ml of medium.
C)100/ml of medium.
D)24 days.
A)12 days.
B)200/ml of medium.
C)100/ml of medium.
D)24 days.
Question
Question
Question
Question
Question
Question
Question
Question
Question
Question
Question
Question
Question
In the figure shown,the willow tree population leveled off at 475 trees and remained stable in the early 1980s.This most likely occurred because the 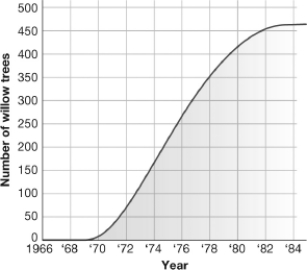
A)trees occupied all of the available space that willows were able to occupy.
B)tree seedlings were shaded by the grasses shown in the illustration.
C)population growth rate exceeded the death rate.
D)trees depleted all of the nutrients in the soil and the trees could no longer grow.
A)trees occupied all of the available space that willows were able to occupy.
B)tree seedlings were shaded by the grasses shown in the illustration.
C)population growth rate exceeded the death rate.
D)trees depleted all of the nutrients in the soil and the trees could no longer grow.
Question
Question
Question
Question
Question
Question
Question
Question
Question
Question
Question
Question
Question
Question
Question
Question
Question
Question
Question
Question
Question
Question
Question
Question
Question
Question

Unlock Deck
Sign up to unlock the cards in this deck!
Unlock Deck
Unlock Deck
1/65
Play
Full screen (f)
Deck 16: Growth of Populations
1
According to the figure shown,human populations began to experience exponential growth around
A)160,000 BCE
B)1800
C)1945
D)2005
A)160,000 BCE
B)1800
C)1945
D)2005
B
2
Which of the following choices best explains why some introduced species experience an initial period of exponential growth when they first move from their native habitat into a new habitat?
A)They do not yet have any natural predators in their new habitat.
B)Most introduced species show better survival in new habitats than in their old ones.
C)Because most native species display exponential growth,many introduced species will do so also.
D)Native species always leave open habitat types that a new species can inhabit.
A
3
Which of the following statements does NOT explain why population density is often difficult to measure?
A)Individuals may be difficult to detect within some habitats.
B)The population size may be very large.
C)An accurate count of the population size may not be available.
D)Individuals may be moving between populations.
A)Individuals may be difficult to detect within some habitats.
B)The population size may be very large.
C)An accurate count of the population size may not be available.
D)Individuals may be moving between populations.
B
4
Which of the following populations would be most likely to experience a J-shaped growth pattern?
A)all of the animals in the San Diego Zoo
B)single-celled Paramecia without a constant food supply
C)a founding colony of rats on a small island with abundant resources
D)a beehive infected midsummer with a deadly bacterial disease
A)all of the animals in the San Diego Zoo
B)single-celled Paramecia without a constant food supply
C)a founding colony of rats on a small island with abundant resources
D)a beehive infected midsummer with a deadly bacterial disease
Unlock Deck
Unlock for access to all 65 flashcards in this deck.
Unlock Deck
k this deck
5
A population of 100 individuals has a doubling time of 25 years.What size will this population be in 100 years?
A)100
B)400
C)800
D)1,600
A)100
B)400
C)800
D)1,600
Unlock Deck
Unlock for access to all 65 flashcards in this deck.
Unlock Deck
k this deck
6
Which of the following pieces of information would be most useful in determining whether a population is undergoing logistic growth versus exponential growth?
A)total population size taken during a current census
B)population doubling time
C)the carrying capacity for the same species in a different environment
D)the shape of the growth curve for the population over time
A)total population size taken during a current census
B)population doubling time
C)the carrying capacity for the same species in a different environment
D)the shape of the growth curve for the population over time
Unlock Deck
Unlock for access to all 65 flashcards in this deck.
Unlock Deck
k this deck
7
The maximum population size that can be supported by its habitat is known as
A)maximum increase.
B)carrying capacity.
C)exponential growth.
D)population balance.
A)maximum increase.
B)carrying capacity.
C)exponential growth.
D)population balance.
Unlock Deck
Unlock for access to all 65 flashcards in this deck.
Unlock Deck
k this deck
8
Nene,Hawaiian geese,live on Maui.Their population density is approximately 0.2 per square kilometer and Maui is approximately 1,800 square kilometers in size.Approximately how many nene live on Maui?
A)18
B)130
C)360
D)1,800
A)18
B)130
C)360
D)1,800
Unlock Deck
Unlock for access to all 65 flashcards in this deck.
Unlock Deck
k this deck
9
The term population density describes the
A)body size of different species.
B)number of individuals per unit area.
C)number of populations per unit area.
D)number of species per unit area.
A)body size of different species.
B)number of individuals per unit area.
C)number of populations per unit area.
D)number of species per unit area.
Unlock Deck
Unlock for access to all 65 flashcards in this deck.
Unlock Deck
k this deck
10
Which of the following statements accurately describes information shown in this figure?
A)The population size in China is over 400 million people.
B)The population size in China has increased most quickly in eastern China.
C)The population density is highest in western China.
D)The population density is highest along the eastern coast of China.
A)The population size in China is over 400 million people.
B)The population size in China has increased most quickly in eastern China.
C)The population density is highest in western China.
D)The population density is highest along the eastern coast of China.
Unlock Deck
Unlock for access to all 65 flashcards in this deck.
Unlock Deck
k this deck
11
A new species is introduced into a given area.The population size begins to grow slowly,then at a very rapid rate,and finally levels off at a stable number.This growth pattern is best represented by a(n)
A)oscillating cycle.
B)J-shaped population curve.
C)C-shaped population curve.
D)S-shaped population curve.
A)oscillating cycle.
B)J-shaped population curve.
C)C-shaped population curve.
D)S-shaped population curve.
Unlock Deck
Unlock for access to all 65 flashcards in this deck.
Unlock Deck
k this deck
12
Which of the following has the highest population density?
A)1 grasshopper living in an area of 10 square meters
B)100 rabbits living in an area of 10,000 square meters
C)200 sparrows living in an area of 20,000 square meters
D)1,500 oysters living in an area of 1,500 square meters
A)1 grasshopper living in an area of 10 square meters
B)100 rabbits living in an area of 10,000 square meters
C)200 sparrows living in an area of 20,000 square meters
D)1,500 oysters living in an area of 1,500 square meters
Unlock Deck
Unlock for access to all 65 flashcards in this deck.
Unlock Deck
k this deck
13
The definition of an area,relative to a population study,
A)is constant.
B)is always 1 square meter.
C)depends on the questions being asked.
D)depends on whether the area is terrestrial or aquatic.
A)is constant.
B)is always 1 square meter.
C)depends on the questions being asked.
D)depends on whether the area is terrestrial or aquatic.
Unlock Deck
Unlock for access to all 65 flashcards in this deck.
Unlock Deck
k this deck
14
A population will remain at a constant size when emigration equals immigration and
A)food is not a limiting factor.
B)births equal deaths.
C)predators leave the area.
D)available space remains the same.
A)food is not a limiting factor.
B)births equal deaths.
C)predators leave the area.
D)available space remains the same.
Unlock Deck
Unlock for access to all 65 flashcards in this deck.
Unlock Deck
k this deck
15
According to the figure shown,human populations are projected to reach carrying capacity in approximately ________ years.
A)15
B)35
C)75
D)85
A)15
B)35
C)75
D)85
Unlock Deck
Unlock for access to all 65 flashcards in this deck.
Unlock Deck
k this deck
16
A population of 100 individuals is undergoing exponential growth with a constant growth rate of 0.2 per year.What size will this population be in 2 years?
A)100
B)120
C)144
D)200
A)100
B)120
C)144
D)200
Unlock Deck
Unlock for access to all 65 flashcards in this deck.
Unlock Deck
k this deck
17
The size of a population can be decreased by
A)a higher birth rate.
B)immigration.
C)emigration.
D)a reduced death rate.
A)a higher birth rate.
B)immigration.
C)emigration.
D)a reduced death rate.
Unlock Deck
Unlock for access to all 65 flashcards in this deck.
Unlock Deck
k this deck
18
Which of the following is a true statement?
A)The population density is equal across all areas of China.
B)China has the largest human population in the world.
C)China's one-child policy allows one birth per couple every ten years.
D)Chinese citizens are allowed to apply for a waiver if they want multiple children.
A)The population density is equal across all areas of China.
B)China has the largest human population in the world.
C)China's one-child policy allows one birth per couple every ten years.
D)Chinese citizens are allowed to apply for a waiver if they want multiple children.
Unlock Deck
Unlock for access to all 65 flashcards in this deck.
Unlock Deck
k this deck
19
A giant puffball mushroom is capable of producing and releasing trillions of spores.With this many spores produced,why do giant puffball mushrooms undergo logistic growth in established habitats?
A)Puffball mushrooms use chemicals to limit the number of spores that survive to ensure that adults have access to nutrients.
B)The length of time for spore germination to occur is one factor that leads to logistic growth in all species.
C)Limiting resources,such as food,water,and space control the maximum population size of all species.
D)Mushrooms are biologically unique organisms that are incapable of experiencing exponential growth even in habitats with unlimited resources.
Unlock Deck
Unlock for access to all 65 flashcards in this deck.
Unlock Deck
k this deck
20
A population is counted at 100 individuals in 1998.In 2006,a new count found 1,600 individuals.What is the doubling time for the population?
A)0.5 year
B)1 year
C)1.5 years
D)2 years
A)0.5 year
B)1 year
C)1.5 years
D)2 years
Unlock Deck
Unlock for access to all 65 flashcards in this deck.
Unlock Deck
k this deck
21
Which of the following factors has probably contributed the least to declining fertility rates in China over the past 50 years?
A)declining infant mortality rates
B)increasing food prices
C)increasing cost of living spaces
D)China's one-child policy
A)declining infant mortality rates
B)increasing food prices
C)increasing cost of living spaces
D)China's one-child policy
Unlock Deck
Unlock for access to all 65 flashcards in this deck.
Unlock Deck
k this deck
22
This figure shows that the human population was small and relatively stable for nearly 12,000 years but has increased dramatically in the past 200 years.How might this increase in population growth be explained?
A)Disease prevented any significant growth of the human population.
B)For most of human history people were too malnourished to have children.
C)People simply chose to have fewer children in the past than at present.
D)Prior human populations were at existing carrying capacities but newly developed technologies have raised the carrying capacity and permitted the recent expansion.
Unlock Deck
Unlock for access to all 65 flashcards in this deck.
Unlock Deck
k this deck
23
This graph shows the growth of a population of Paramecium caudatum.The greatest amount of daily growth occurred when the population was at approximately ________ percent of its carrying capacity.
A)10
B)25
C)50
D)100
A)10
B)25
C)50
D)100
Unlock Deck
Unlock for access to all 65 flashcards in this deck.
Unlock Deck
k this deck
24
The top of the "S" in an S-shaped curve indicates that the population
A)is on the verge of collapse.
B)is experiencing abnormally heavy pressure from predators.
C)has reached its carrying capacity.
D)is poised for further exponential growth.
A)is on the verge of collapse.
B)is experiencing abnormally heavy pressure from predators.
C)has reached its carrying capacity.
D)is poised for further exponential growth.
Unlock Deck
Unlock for access to all 65 flashcards in this deck.
Unlock Deck
k this deck
25
Studies of the population-size cycles seen between the snowshoe hare and the Canadian lynx showed that
A)lynx populations decrease in size when hare populations increase in size.
B)lynx populations increase in size when hare populations decrease in size.
C)lynx populations decrease in size when hare populations decrease in size.
D)There is no relationship between population sizes of snowshoe hare and Canadian lynx.
Unlock Deck
Unlock for access to all 65 flashcards in this deck.
Unlock Deck
k this deck
26
The carrying capacity for Paramecia caudatum as shown in this figure is
A)12 days.
B)200/ml of medium.
C)100/ml of medium.
D)24 days.
A)12 days.
B)200/ml of medium.
C)100/ml of medium.
D)24 days.
Unlock Deck
Unlock for access to all 65 flashcards in this deck.
Unlock Deck
k this deck
27
For most populations,irregular fluctuations in size or density
A)are less commonly experienced than the smooth J-shaped growth curve.
B)occur commonly before carrying capacity is reached.
C)are more common than the smooth J-shaped growth curve.
D)occur only when density-independent factors dominate.
A)are less commonly experienced than the smooth J-shaped growth curve.
B)occur commonly before carrying capacity is reached.
C)are more common than the smooth J-shaped growth curve.
D)occur only when density-independent factors dominate.
Unlock Deck
Unlock for access to all 65 flashcards in this deck.
Unlock Deck
k this deck
28
The effects of pollution are generally considered to be density-independent because
A)the contamination level of any organism is unaffected by variations in population density.
B)when food supplies become limited,the organisms are more likely to consume contaminated foods.
C)at high densities the organisms are more likely to contact the pollutant.
D)when the organisms are stressed by overcrowding,the pollutant becomes more toxic.
Unlock Deck
Unlock for access to all 65 flashcards in this deck.
Unlock Deck
k this deck
29
Which of the following statements about carrying capacity is true?
A)An S-shaped curve represents a population's ability to increase its numbers above the carrying capacity of its habitat.
B)J-shaped curves show the immediate limiting effect of carrying capacity on a newly introduced organism.
C)The carrying capacity is the same for all organisms in the same area.
D)The carrying capacity is established by the factor with the most limited availability.
Unlock Deck
Unlock for access to all 65 flashcards in this deck.
Unlock Deck
k this deck
30
In 1978,a drought on the Galapagos Islands caused a reduction in the production of seeds that one of Darwin's finches,a kind of bird,fed upon.This caused a decrease from 1,400 to 200 birds.This population change factor
A)would not be considered a part of the carrying capacity for these birds.
B)was density-dependent.
C)was density-independent.
D)resulted in exponential growth for the bird population.
A)would not be considered a part of the carrying capacity for these birds.
B)was density-dependent.
C)was density-independent.
D)resulted in exponential growth for the bird population.
Unlock Deck
Unlock for access to all 65 flashcards in this deck.
Unlock Deck
k this deck
31
The carrying capacity of owls in an Alaskan forest is seven per square kilometer.What will happen if twelve owls are confined to a 1-square-kilometer area?
A)The owls will survive together and develop ways to share resources.
B)The owls might survive but the population size in the future will most likely be close to seven.
C)The population of owl prey organisms will increase proportionately to support a larger population of owls.
D)A short-term exponential growth of owls will occur because more mating pairs will form.
Unlock Deck
Unlock for access to all 65 flashcards in this deck.
Unlock Deck
k this deck
32
Which of the following populations would be most vulnerable to an outbreak of disease?
A)10 grasshoppers living in an area of 100 square meters
B)100 rabbits living in an area of 10,000 square meters
C)200 sparrows living in an area of 20,000 square meters
D)250,000 people living in an area of 100,000 square meters
A)10 grasshoppers living in an area of 100 square meters
B)100 rabbits living in an area of 10,000 square meters
C)200 sparrows living in an area of 20,000 square meters
D)250,000 people living in an area of 100,000 square meters
Unlock Deck
Unlock for access to all 65 flashcards in this deck.
Unlock Deck
k this deck
33
Which of the following would likely occur as a population reaches carrying capacity?
A)Density-independent deaths would increase.
B)Density-dependent deaths would increase.
C)Use of resources,such as food and space,would decrease.
D)Birth rates would increase to maintain population size.
A)Density-independent deaths would increase.
B)Density-dependent deaths would increase.
C)Use of resources,such as food and space,would decrease.
D)Birth rates would increase to maintain population size.
Unlock Deck
Unlock for access to all 65 flashcards in this deck.
Unlock Deck
k this deck
34
Which of the following situations illustrates a link between the effects of density-dependent and density-independent factors?
A)A flood causes a river to overflow and drown a herd of deer.
B)A drought occurs;a small herd of deer is able to survive,whereas a larger herd in the same area perishes.
C)A population of deer increases to a size at which individuals are competing with each other to get enough food.
D)None of the above are correct because density-dependent and density-independent factors cannot affect the same population of organisms at the same time.
Unlock Deck
Unlock for access to all 65 flashcards in this deck.
Unlock Deck
k this deck
35
Lynx feed on rabbits,and the growth curves for these two species fluctuate together.This relationship is an example of a(n)
A)S-shaped growth curve.
B)J-shaped growth curve.
C)irregular fluctuation.
D)tightly linked cycle.
A)S-shaped growth curve.
B)J-shaped growth curve.
C)irregular fluctuation.
D)tightly linked cycle.
Unlock Deck
Unlock for access to all 65 flashcards in this deck.
Unlock Deck
k this deck
36
Density-dependent factors are more likely to limit population growth when
A)there are more individuals living in the same amount of space.
B)the population moves into a larger habitat.
C)food is abundant.
D)weather conditions become milder.
A)there are more individuals living in the same amount of space.
B)the population moves into a larger habitat.
C)food is abundant.
D)weather conditions become milder.
Unlock Deck
Unlock for access to all 65 flashcards in this deck.
Unlock Deck
k this deck
37
Is it reasonable to expect that all habitats suitable for a given organism will have the same carrying capacity for that organism?
A)Yes,unless the carrying capacities are the same,the habitat would not be suitable.
B)Yes,the carrying capacity is determined solely by the type of organism being considered.
C)No,an organism may be able to live in many locations,but the resources it requires may be available in varying amounts.
D)No,it is not possible for two habitats to have the same carrying capacity.
Unlock Deck
Unlock for access to all 65 flashcards in this deck.
Unlock Deck
k this deck
38
When an isolated population reaches its carrying capacity
A)the birth rate > the death rate.
B)the birth rate = the death rate.
C)the birth rate < the death rate.
D)It is not possible to generalize these values.
A)the birth rate > the death rate.
B)the birth rate = the death rate.
C)the birth rate < the death rate.
D)It is not possible to generalize these values.
Unlock Deck
Unlock for access to all 65 flashcards in this deck.
Unlock Deck
k this deck
39
In the figure shown,the willow tree population leveled off at 475 trees and remained stable in the early 1980s.This most likely occurred because the
A)trees occupied all of the available space that willows were able to occupy.
B)tree seedlings were shaded by the grasses shown in the illustration.
C)population growth rate exceeded the death rate.
D)trees depleted all of the nutrients in the soil and the trees could no longer grow.
A)trees occupied all of the available space that willows were able to occupy.
B)tree seedlings were shaded by the grasses shown in the illustration.
C)population growth rate exceeded the death rate.
D)trees depleted all of the nutrients in the soil and the trees could no longer grow.
Unlock Deck
Unlock for access to all 65 flashcards in this deck.
Unlock Deck
k this deck
40
The decrease in the availability of food or cover that accompanies increasing population size illustrates the concept of a(n)
A)density-dependent factor.
B)density-independent factor.
C)exponential growth factor.
D)logistic growth factor.
A)density-dependent factor.
B)density-independent factor.
C)exponential growth factor.
D)logistic growth factor.
Unlock Deck
Unlock for access to all 65 flashcards in this deck.
Unlock Deck
k this deck
41
China's one-child policy was designed to reduce the population ________ in China.
Unlock Deck
Unlock for access to all 65 flashcards in this deck.
Unlock Deck
k this deck
42
Explain why logistic growth curves have an "S" shape.
Unlock Deck
Unlock for access to all 65 flashcards in this deck.
Unlock Deck
k this deck
43
If there are 100 people living in a 2-square-kilometer area,the population density is ________ people per square kilometer.
Unlock Deck
Unlock for access to all 65 flashcards in this deck.
Unlock Deck
k this deck
44
Why is the March 2013 merger of the National Population and Family Planning Commission and the Ministry of Health considered significant?
A)The merger allowed documents recording births to be housed within a single agency.
B)The merger signified that births were being restricted primarily for health reasons.
C)The merger was a concession to demands from rural workers.
D)The merger was a sign of demotion for the National Population and Family Planning Commission.
Unlock Deck
Unlock for access to all 65 flashcards in this deck.
Unlock Deck
k this deck
45
By imposing the one-child policy,China's government is attempting to manipulate which of the following factors?
A)death rate
B)birth rate
C)carrying capacity
D)food supply
A)death rate
B)birth rate
C)carrying capacity
D)food supply
Unlock Deck
Unlock for access to all 65 flashcards in this deck.
Unlock Deck
k this deck
46
China's population ________ is 137 people per square kilometer.
Unlock Deck
Unlock for access to all 65 flashcards in this deck.
Unlock Deck
k this deck
47
In the absence of a one-child policy,which of the following would be expected to control population growth in a developed country?
A)declining resources
B)declining mortality rates
C)better access to healthcare
D)educated women
A)declining resources
B)declining mortality rates
C)better access to healthcare
D)educated women
Unlock Deck
Unlock for access to all 65 flashcards in this deck.
Unlock Deck
k this deck
48
Use a specific example to explain how population density may change for people living in one country without any change in population size.
Unlock Deck
Unlock for access to all 65 flashcards in this deck.
Unlock Deck
k this deck
49
Predation increases are responsible for density-________ changes in population size.
Unlock Deck
Unlock for access to all 65 flashcards in this deck.
Unlock Deck
k this deck
50
One measure of population growth is the period in which a population increases to twice its size.This is referred to as the ________ of the population.
Unlock Deck
Unlock for access to all 65 flashcards in this deck.
Unlock Deck
k this deck
51
Population size ________ when the combination of death and emigration rates is lower than the combination of birth and immigration rates.
Unlock Deck
Unlock for access to all 65 flashcards in this deck.
Unlock Deck
k this deck
52
A population of 10 yeast cells is put into a flask with growth media that contains all of the nutrients required for growth.The yeast has a doubling time of two hours;four hours after adding the yeast to the flask the population size is 40 cells.After three days the population size stabilizes at around 500 cells.Is this population exhibiting logistic or exponential growth? Explain your reasoning.
Unlock Deck
Unlock for access to all 65 flashcards in this deck.
Unlock Deck
k this deck
53
Explain whether a death rate increase from influenza is an example of a density-dependent population change or a density-independent population change.
Unlock Deck
Unlock for access to all 65 flashcards in this deck.
Unlock Deck
k this deck
54
In November 2013,the one-child policy was officially relaxed to allow a second birth to some couples.Which of the following couples are now allowed a second birth?
A)couples in which one parent is an only child
B)couples in which both parents are only children
C)couples in which one parent is an orphan
D)couples in which both parents are orphans
A)couples in which one parent is an only child
B)couples in which both parents are only children
C)couples in which one parent is an orphan
D)couples in which both parents are orphans
Unlock Deck
Unlock for access to all 65 flashcards in this deck.
Unlock Deck
k this deck
55
Which of the following has NOT been shown to be a consequence of China's one-child policy?
A)an unbalanced age ratio with a growing elderly population and a much smaller working population
B)a skewed sex ratio with a larger proportion of the population being male than female
C)a dramatic decrease in the birth rate that began shortly after implementation of the one-child policy
D)human-rights abuses,such as forced abortions
Unlock Deck
Unlock for access to all 65 flashcards in this deck.
Unlock Deck
k this deck
56
At room temperature,a population of dangerous bacteria on a piece of raw chicken increases from 100,000 to 400,000 in 40 minutes.Its doubling time is ________ minutes.
Unlock Deck
Unlock for access to all 65 flashcards in this deck.
Unlock Deck
k this deck
57
If we humans do not limit our population growth rate,we will exceed the ________ of our environment,leading to a larger population than the environment can support.
Unlock Deck
Unlock for access to all 65 flashcards in this deck.
Unlock Deck
k this deck
58
Which of the following has been amplified by China's one-child policy?
A)an unbalanced age ratio with a growing population of younger people and a shrinking elderly population
B)an increase in the number of primary-school students in rural areas of China
C)a larger proportion of males compared to the proportion of females born in China annually
D)an increase in the number of children born annually to couples in which one parent is an only child
Unlock Deck
Unlock for access to all 65 flashcards in this deck.
Unlock Deck
k this deck
59
Weather is a density-________ factor that can affect the size of a population.
Unlock Deck
Unlock for access to all 65 flashcards in this deck.
Unlock Deck
k this deck
60
In what year did China implement the one-child policy?
A)1949
B)1967
C)1978
D)1994
A)1949
B)1967
C)1978
D)1994
Unlock Deck
Unlock for access to all 65 flashcards in this deck.
Unlock Deck
k this deck
61
Match each term to a statement listed below.
a.population size
b.population density
c.carrying capacity
d.logistic growth
e.exponential growth
total number of individuals in a population within a given area
a.population size
b.population density
c.carrying capacity
d.logistic growth
e.exponential growth
total number of individuals in a population within a given area
Unlock Deck
Unlock for access to all 65 flashcards in this deck.
Unlock Deck
k this deck
62
Match each term to a statement listed below.
a.population size
b.population density
c.carrying capacity
d.logistic growth
e.exponential growth
unlimited growth of a population with no constraint on resources
a.population size
b.population density
c.carrying capacity
d.logistic growth
e.exponential growth
unlimited growth of a population with no constraint on resources
Unlock Deck
Unlock for access to all 65 flashcards in this deck.
Unlock Deck
k this deck
63
Match each term to a statement listed below.
a.population size
b.population density
c.carrying capacity
d.logistic growth
e.exponential growth
the maximum sustainable population size in a given environment
a.population size
b.population density
c.carrying capacity
d.logistic growth
e.exponential growth
the maximum sustainable population size in a given environment
Unlock Deck
Unlock for access to all 65 flashcards in this deck.
Unlock Deck
k this deck
64
Describe one negative consequence that has been linked to China's one-child policy,and explain how this consequence is impacting China.
Unlock Deck
Unlock for access to all 65 flashcards in this deck.
Unlock Deck
k this deck
65
Match each term to a statement listed below.
a.population size
b.population density
c.carrying capacity
d.logistic growth
e.exponential growth
number of individuals within a population per unit of area
a.population size
b.population density
c.carrying capacity
d.logistic growth
e.exponential growth
number of individuals within a population per unit of area
Unlock Deck
Unlock for access to all 65 flashcards in this deck.
Unlock Deck
k this deck
Unlock Deck
Unlock for access to all 65 flashcards in this deck.


