Deck 6: Long-Run Economic Growth: Sources and Policies
Full screen (f)
Question
Question
Question
Question
Question
Question
Question
Question
Question
Question
Question
Question
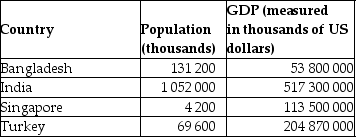
Calculate the GDP per capita for each country in the following table. Which country has the highest standard of living? Why?
_____________________________________________________________________________________________
_____________________________________________________________________________________________
_____________________________________________________________________________________________
_____________________________________________________________________________________________
Question
Question
Question
Question
Question
Question
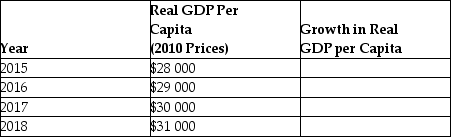
Use the following table to calculate the average annual growth rate in GDP. Also calculate the total percentage change in growth from 2015 to 2018. Explain the difference between the average annual growth rate in real per capita GDP from 2015 to 2018 and the total percentage change in growth from 2015 to 2018.
_____________________________________________________________________________________________
_____________________________________________________________________________________________
_____________________________________________________________________________________________
_____________________________________________________________________________________________
Question
Question
Refer to Table 6.1 for the following question.
Table 6.1
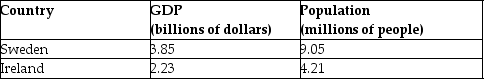
Refer to Table 6.1. Which country has a higher standard of living and why?
A)Sweden has a higher standard of living because their GDP is higher.
B)Ireland has a higher standard of living because their GDP per capita is higher.
C)Sweden has a higher standard of living because their GDP per capita is higher.
D)Ireland has a higher standard of living because growth in GDP is greater in Ireland than in Sweden.
Table 6.1
Refer to Table 6.1. Which country has a higher standard of living and why?
A)Sweden has a higher standard of living because their GDP is higher.
B)Ireland has a higher standard of living because their GDP per capita is higher.
C)Sweden has a higher standard of living because their GDP per capita is higher.
D)Ireland has a higher standard of living because growth in GDP is greater in Ireland than in Sweden.
Question
Question
Question
Question
Refer to Figure 6.1 for the following questions.
Figure 6.1
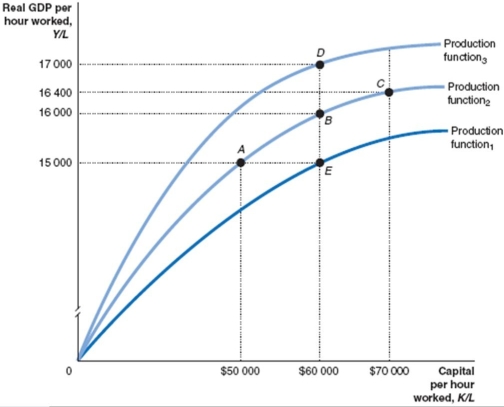
The movement from A to E in Figure 6.1 illustrates:
A)negative technological change.
B)a decline in capital per worker.
C)zero returns to capital.
D)diminishing returns to labour.
Figure 6.1
The movement from A to E in Figure 6.1 illustrates:
A)negative technological change.
B)a decline in capital per worker.
C)zero returns to capital.
D)diminishing returns to labour.
Question
Question
Question
Question
Question
Question
Question
Refer to Figure 6.1 for the following questions.
Figure 6.1
The movement from A to B to C in Figure 6.1 illustrates:
A)an improvement in technology.
B)a decline in capital per worker.
C)diminishing returns to capital.
D)diminishing returns to labour.
Figure 6.1
The movement from A to B to C in Figure 6.1 illustrates:
A)an improvement in technology.
B)a decline in capital per worker.
C)diminishing returns to capital.
D)diminishing returns to labour.
Question
Question
Question
Refer to Figure 6.1 for the following questions.
Figure 6.1
The movement from A to D in Figure 6.1 illustrates:
A)an improvement in technology.
B)a decline in capital per worker.
C)diminishing returns to capital.
D)diminishing returns to labour.
Figure 6.1
The movement from A to D in Figure 6.1 illustrates:
A)an improvement in technology.
B)a decline in capital per worker.
C)diminishing returns to capital.
D)diminishing returns to labour.
Question
Question
Question
Question
Question
Question
Refer to Figure 6.1 for the following questions.
Figure 6.1
The movement from E to B to D in Figure 6.1 illustrates:
A)an improvement in technology.
B)a decline in capital per worker.
C)diminishing returns to capital.
D)increasing returns to labour.
Figure 6.1
The movement from E to B to D in Figure 6.1 illustrates:
A)an improvement in technology.
B)a decline in capital per worker.
C)diminishing returns to capital.
D)increasing returns to labour.
Question
Question
Question
Question
Question
Question
Using the points on the following diagram, identify which combinations of these points illustrate diminishing returns to capital. Give a brief explanation to support your answer.

_____________________________________________________________________________________________
_____________________________________________________________________________________________
_____________________________________________________________________________________________
_____________________________________________________________________________________________
Question
Question
Question
Question
Question
Question
Question
Starting at point E in the following diagram, identify which combinations of points illustrate technological change. Give a brief explanation to support your answer.

_____________________________________________________________________________________________
_____________________________________________________________________________________________
_____________________________________________________________________________________________
_____________________________________________________________________________________________
Question
Question
Question
Question
Question
Question
Question
Question
Question
Question
Question
Question
Question
Question
Question
Question
Question
Question
Question
Question
Question
Question
Question
Question
Question
Question
Question

Unlock Deck
Sign up to unlock the cards in this deck!
Unlock Deck
Unlock Deck
1/118
Play
Full screen (f)
Deck 6: Long-Run Economic Growth: Sources and Policies
1
Which of the following countries was identified as a newly industrialising country in the 1980s and1990s, but is not identified as high-income country?
A)United States
B)Australia
C)Hong Kong
D)Brazil
A)United States
B)Australia
C)Hong Kong
D)Brazil
Hong Kong
2
________ is considered a newly industrialised country, ________ a developing country, and ________ a high income country.
A)Japan; Hong Kong; South Korea
B)Malaysia; Malawi; Japan
C)Canada; Singapore; Malawi
D)Honduras; New Zealand; South Korea
A)Japan; Hong Kong; South Korea
B)Malaysia; Malawi; Japan
C)Canada; Singapore; Malawi
D)Honduras; New Zealand; South Korea
Malaysia; Malawi; Japan
3
Economically, the best measure of a country's standard of living is:
A)GDP per unit of capital.
B)GDP per capita.
C)GDP Per hour of labour.
D)total GDP.
A)GDP per unit of capital.
B)GDP per capita.
C)GDP Per hour of labour.
D)total GDP.
GDP per capita.
4
GDP in a country grew from $10 billion to $14 billion over the span of five years. The average annual growth rate of GDP was:
A)4%.
B)7%.
C)10%.
D)40%.
A)4%.
B)7%.
C)10%.
D)40%.
Unlock Deck
Unlock for access to all 118 flashcards in this deck.
Unlock Deck
k this deck
5
Since the world began, most records show that little or no increases in real GDP per capita occurred until around the 1800s.
Unlock Deck
Unlock for access to all 118 flashcards in this deck.
Unlock Deck
k this deck
6
What do economists call the small group of East Asian countries that experienced high rates of growth in the 1980s and 1990s?
A)education deprived countries
B)countries with low standards of living
C)newly industrialising countries
D)industrial countries
A)education deprived countries
B)countries with low standards of living
C)newly industrialising countries
D)industrial countries
Unlock Deck
Unlock for access to all 118 flashcards in this deck.
Unlock Deck
k this deck
7
Which of the following is not a reason why the Industrial Revolution occurred when and where it did?
A)The British government was committed to upholding private property rights.
B)The British government was able to eliminate arbitrary increases in taxes.
C)The British government was able to more easily nationalise firms.
D)Institutional changes by the British government helped in protecting wealth.
Unlock Deck
Unlock for access to all 118 flashcards in this deck.
Unlock Deck
k this deck
8
Which of the following accurately describes economic growth and standards of living from BC to 1300 AD?
A)Standards of living in 1300 AD were substantially better than what they were BC.
B)Standards of living substantially declined from BC to 1300 AD.
C)Significant economic growth took place from BC to 1300 AD.
D)No sustained economic growth occurred from BC to 1300 AD.
A)Standards of living in 1300 AD were substantially better than what they were BC.
B)Standards of living substantially declined from BC to 1300 AD.
C)Significant economic growth took place from BC to 1300 AD.
D)No sustained economic growth occurred from BC to 1300 AD.
Unlock Deck
Unlock for access to all 118 flashcards in this deck.
Unlock Deck
k this deck
9
In the long run, _________ differences in GDP per capita are the result of _______________differences in economic growth rates.
A)small; large
B)large; no
C)large; small
D)small; no
A)small; large
B)large; no
C)large; small
D)small; no
Unlock Deck
Unlock for access to all 118 flashcards in this deck.
Unlock Deck
k this deck
10
Which of the following countries was identified as a newly industrialised country as of 2014?
A)Philippines
B)Canada
C)Taiwan
D)Singapore
A)Philippines
B)Canada
C)Taiwan
D)Singapore
Unlock Deck
Unlock for access to all 118 flashcards in this deck.
Unlock Deck
k this deck
11
The Industrial Revolution in Britain:
A)marked the beginning of significant economic growth in the world.
B)started around the year 1950.
C)produced goods exclusively using human or animal power.
D)had no impact on standards of living in the world.
A)marked the beginning of significant economic growth in the world.
B)started around the year 1950.
C)produced goods exclusively using human or animal power.
D)had no impact on standards of living in the world.
Unlock Deck
Unlock for access to all 118 flashcards in this deck.
Unlock Deck
k this deck
12
Calculate the GDP per capita for each country in the following table. Which country has the highest standard of living? Why?
_____________________________________________________________________________________________
_____________________________________________________________________________________________
_____________________________________________________________________________________________
_____________________________________________________________________________________________
Unlock Deck
Unlock for access to all 118 flashcards in this deck.
Unlock Deck
k this deck
13
GDP in a country grew from $10 billion to $15 billion over the span of five years. The percentage change in GDP was:
A)4%.
B)7%.
C)40%.
D)50%.
A)4%.
B)7%.
C)40%.
D)50%.
Unlock Deck
Unlock for access to all 118 flashcards in this deck.
Unlock Deck
k this deck
14
If a country's real GDP is rising by 4% per year while its population is rising at 3% per year, which of the following is true?
A)The country's standard of living is falling.
B)The country's standard of living is rising.
C)Growth in nominal GDP outweighs growth in the population.
D)Growth in nominal GDP is less than the growth in the population.
A)The country's standard of living is falling.
B)The country's standard of living is rising.
C)Growth in nominal GDP outweighs growth in the population.
D)Growth in nominal GDP is less than the growth in the population.
Unlock Deck
Unlock for access to all 118 flashcards in this deck.
Unlock Deck
k this deck
15
Describe the pattern of growth in GDP per capita in the world before the Industrial Revolution.
_____________________________________________________________________________________________
_____________________________________________________________________________________________
_____________________________________________________________________________________________
_____________________________________________________________________________________________
Unlock Deck
Unlock for access to all 118 flashcards in this deck.
Unlock Deck
k this deck
16
Mechanical power from around 1750 onward led to significant increases in labour productivity and economic growth.
Unlock Deck
Unlock for access to all 118 flashcards in this deck.
Unlock Deck
k this deck
17
In comparing China and Japan in terms of growth rates and standards of living, we find:
A)life expectancy is longer in China than in Japan.
B)GDP growth rates currently are higher in China, while the standard of living is lower.
C)infant mortality is higher in Japan.
D)life expectancy at birth is higher in China than in Japan.
A)life expectancy is longer in China than in Japan.
B)GDP growth rates currently are higher in China, while the standard of living is lower.
C)infant mortality is higher in Japan.
D)life expectancy at birth is higher in China than in Japan.
Unlock Deck
Unlock for access to all 118 flashcards in this deck.
Unlock Deck
k this deck
18
Use the following table to calculate the average annual growth rate in GDP. Also calculate the total percentage change in growth from 2015 to 2018. Explain the difference between the average annual growth rate in real per capita GDP from 2015 to 2018 and the total percentage change in growth from 2015 to 2018.
_____________________________________________________________________________________________
_____________________________________________________________________________________________
_____________________________________________________________________________________________
_____________________________________________________________________________________________
Unlock Deck
Unlock for access to all 118 flashcards in this deck.
Unlock Deck
k this deck
19
During which of the following periods was global growth in GDP per capita the strongest?
A)Prior to 500 AD.
B)500 AD to 1800 AD.
C)1800-1900 AD.
D)1900-2000 AD.
A)Prior to 500 AD.
B)500 AD to 1800 AD.
C)1800-1900 AD.
D)1900-2000 AD.
Unlock Deck
Unlock for access to all 118 flashcards in this deck.
Unlock Deck
k this deck
20
Refer to Table 6.1 for the following question.
Table 6.1
Refer to Table 6.1. Which country has a higher standard of living and why?
A)Sweden has a higher standard of living because their GDP is higher.
B)Ireland has a higher standard of living because their GDP per capita is higher.
C)Sweden has a higher standard of living because their GDP per capita is higher.
D)Ireland has a higher standard of living because growth in GDP is greater in Ireland than in Sweden.
Unlock Deck
Unlock for access to all 118 flashcards in this deck.
Unlock Deck
k this deck
21
Labour productivity can be explained by:
A)technological change and the quantity of capital per hour.
B)diminishing returns and the quantity of labour per hour.
C)diminishing returns and the quantity of capital per hour.
D)technological change and the quantity of labour per hour.
A)technological change and the quantity of capital per hour.
B)diminishing returns and the quantity of labour per hour.
C)diminishing returns and the quantity of capital per hour.
D)technological change and the quantity of labour per hour.
Unlock Deck
Unlock for access to all 118 flashcards in this deck.
Unlock Deck
k this deck
22
Suppose the economy gains more capital per hour worked and experiences technological change. This is shown in Figure 6.1 by the movement from:
A)E to B to D.
B)A to B to C.
C)A to E.
D)A to D.
A)E to B to D.
B)A to B to C.
C)A to E.
D)A to D.
Unlock Deck
Unlock for access to all 118 flashcards in this deck.
Unlock Deck
k this deck
23
An increase in ________ shifts ________ the production function, and makes it possible to produce a higher level of GDP with ________ capital per hour worked.
A)technology; down; the same amount of
B)technology; up; the same amount of
C)consumption; up; a lesser amount
D)labour productivity; down; the same amount of
A)technology; down; the same amount of
B)technology; up; the same amount of
C)consumption; up; a lesser amount
D)labour productivity; down; the same amount of
Unlock Deck
Unlock for access to all 118 flashcards in this deck.
Unlock Deck
k this deck
24
Refer to Figure 6.1 for the following questions.
Figure 6.1
The movement from A to E in Figure 6.1 illustrates:
A)negative technological change.
B)a decline in capital per worker.
C)zero returns to capital.
D)diminishing returns to labour.
Figure 6.1
The movement from A to E in Figure 6.1 illustrates:
A)negative technological change.
B)a decline in capital per worker.
C)zero returns to capital.
D)diminishing returns to labour.
Unlock Deck
Unlock for access to all 118 flashcards in this deck.
Unlock Deck
k this deck
25
If the per-worker production function shifts up:
A)it now takes more capital per hour worked to get the same amount of real GDP per hour worked.
B)an economy can increase its real GDP per hour worked without changing the level of capital per hour worked.
C)the per-worker production function becomes flatter.
D)negative technological change has occurred in the economy.
Unlock Deck
Unlock for access to all 118 flashcards in this deck.
Unlock Deck
k this deck
26
In Figure 6.1, more capital per hour worked is shown by the movement from:
A)B to D.
B)A to B.
C)B to E.
D)B to A.
A)B to D.
B)A to B.
C)B to E.
D)B to A.
Unlock Deck
Unlock for access to all 118 flashcards in this deck.
Unlock Deck
k this deck
27
According to 'new growth theory', the accumulation of ________ capital is subject to diminishing returns at the ________ level, but not at the level of the economy as a whole.
A)physical; firm
B)technological; personal
C)knowledge; firm
D)physical; production
A)physical; firm
B)technological; personal
C)knowledge; firm
D)physical; production
Unlock Deck
Unlock for access to all 118 flashcards in this deck.
Unlock Deck
k this deck
28
How do economic growth rates affect a nation's standard of living?
_____________________________________________________________________________________________
_____________________________________________________________________________________________
_____________________________________________________________________________________________
_____________________________________________________________________________________________
Unlock Deck
Unlock for access to all 118 flashcards in this deck.
Unlock Deck
k this deck
29
What are the three common ways of classifying the world economies based on their level of economic development?
_____________________________________________________________________________________________
_____________________________________________________________________________________________
_____________________________________________________________________________________________
_____________________________________________________________________________________________
Unlock Deck
Unlock for access to all 118 flashcards in this deck.
Unlock Deck
k this deck
30
In the long run, a country will experience an increasing standard of living only if it experiences:
A)a high rate of consumption.
B)continuous technological change.
C)a high rate of labour force growth.
D)a slow rate of population growth.
A)a high rate of consumption.
B)continuous technological change.
C)a high rate of labour force growth.
D)a slow rate of population growth.
Unlock Deck
Unlock for access to all 118 flashcards in this deck.
Unlock Deck
k this deck
31
Refer to Figure 6.1 for the following questions.
Figure 6.1
The movement from A to B to C in Figure 6.1 illustrates:
A)an improvement in technology.
B)a decline in capital per worker.
C)diminishing returns to capital.
D)diminishing returns to labour.
Figure 6.1
The movement from A to B to C in Figure 6.1 illustrates:
A)an improvement in technology.
B)a decline in capital per worker.
C)diminishing returns to capital.
D)diminishing returns to labour.
Unlock Deck
Unlock for access to all 118 flashcards in this deck.
Unlock Deck
k this deck
32
What changes are explained by an economic growth model?
A)Real GDP per capita in the long run
B)Nominal GDP per capita in the long run
C)Real GDP per capita in the short run
D)Nominal GDP per capita in the short run
A)Real GDP per capita in the long run
B)Nominal GDP per capita in the long run
C)Real GDP per capita in the short run
D)Nominal GDP per capita in the short run
Unlock Deck
Unlock for access to all 118 flashcards in this deck.
Unlock Deck
k this deck
33
Which of the following combination of points illustrates changes in the Soviet Union's economy from 1950-1980, as illustrated in Figure 6.1?
A)E to B
B)B to D
C)B to E
D)A to B to C
A)E to B
B)B to D
C)B to E
D)A to B to C
Unlock Deck
Unlock for access to all 118 flashcards in this deck.
Unlock Deck
k this deck
34
Refer to Figure 6.1 for the following questions.
Figure 6.1
The movement from A to D in Figure 6.1 illustrates:
A)an improvement in technology.
B)a decline in capital per worker.
C)diminishing returns to capital.
D)diminishing returns to labour.
Figure 6.1
The movement from A to D in Figure 6.1 illustrates:
A)an improvement in technology.
B)a decline in capital per worker.
C)diminishing returns to capital.
D)diminishing returns to labour.
Unlock Deck
Unlock for access to all 118 flashcards in this deck.
Unlock Deck
k this deck
35
The 'per-worker production function' shows the relationship between ________ per hour worked and ________ per hour worked, holding ________ constant.
A)labour; real GDP; technology
B)capital; real GDP; technology
C)labour; capital; real GDP
D)capital; labour; real GDP
A)labour; real GDP; technology
B)capital; real GDP; technology
C)labour; capital; real GDP
D)capital; labour; real GDP
Unlock Deck
Unlock for access to all 118 flashcards in this deck.
Unlock Deck
k this deck
36
Which of the following is true about technological change?
A)It will shift down the per-worker production function.
B)It will shift up the per-worker production function.
C)It will move the economy to a point beneath the per-worker production function.
D)It will move the economy along a given per-worker production function.
A)It will shift down the per-worker production function.
B)It will shift up the per-worker production function.
C)It will move the economy to a point beneath the per-worker production function.
D)It will move the economy along a given per-worker production function.
Unlock Deck
Unlock for access to all 118 flashcards in this deck.
Unlock Deck
k this deck
37
A change in the ability of a firm to produce a given level of output with a given level of inputs is called:
A)human capital investment.
B)an increase in labour productivity
C)technological change.
D)a movement along a given per-worker production function.
A)human capital investment.
B)an increase in labour productivity
C)technological change.
D)a movement along a given per-worker production function.
Unlock Deck
Unlock for access to all 118 flashcards in this deck.
Unlock Deck
k this deck
38
'New growth theory' states that increases in ________ capital will result in ________ at the ________ level.
A)knowledge; increasing returns to scale; firm
B)physical; decreasing returns to scale; firm
C)knowledge; decreasing returns to scale; economy
D)knowledge; increasing returns to scale; economy
A)knowledge; increasing returns to scale; firm
B)physical; decreasing returns to scale; firm
C)knowledge; decreasing returns to scale; economy
D)knowledge; increasing returns to scale; economy
Unlock Deck
Unlock for access to all 118 flashcards in this deck.
Unlock Deck
k this deck
39
Which of the following describes the Soviet Union's economy between 1950 and the 1980s?
A)The Soviet economy grew rapidly due to an increase in capital per worker.
B)The Soviet economy increased capital per worker very slowly from 1950 through 1980.
C)The Soviet economy grew slowly because of the slow rate of technological change.
D)The Soviet economy grew because it added labour through immigration - its policy in the 1950s.
Unlock Deck
Unlock for access to all 118 flashcards in this deck.
Unlock Deck
k this deck
40
Refer to Figure 6.1 for the following questions.
Figure 6.1
The movement from E to B to D in Figure 6.1 illustrates:
A)an improvement in technology.
B)a decline in capital per worker.
C)diminishing returns to capital.
D)increasing returns to labour.
Figure 6.1
The movement from E to B to D in Figure 6.1 illustrates:
A)an improvement in technology.
B)a decline in capital per worker.
C)diminishing returns to capital.
D)increasing returns to labour.
Unlock Deck
Unlock for access to all 118 flashcards in this deck.
Unlock Deck
k this deck
41
Economist Paul Romer argued that:
A)technological change was determined by forces outside of the market.
B)at the firm level, diminishing returns to labour occur.
C)at the economy level, knowledge capital is subject to increasing returns.
D)knowledge capital is excludable but rival.
A)technological change was determined by forces outside of the market.
B)at the firm level, diminishing returns to labour occur.
C)at the economy level, knowledge capital is subject to increasing returns.
D)knowledge capital is excludable but rival.
Unlock Deck
Unlock for access to all 118 flashcards in this deck.
Unlock Deck
k this deck
42
What reasons does Paul Romer give to support his claim that firms 'free ride' on 'knowledge capital'?
_____________________________________________________________________________________________
_____________________________________________________________________________________________
_____________________________________________________________________________________________
_____________________________________________________________________________________________
Unlock Deck
Unlock for access to all 118 flashcards in this deck.
Unlock Deck
k this deck
43
Suggest two policies the government could pursue to help increase the accumulation of knowledge.
_____________________________________________________________________________________________
_____________________________________________________________________________________________
_____________________________________________________________________________________________
_____________________________________________________________________________________________
Unlock Deck
Unlock for access to all 118 flashcards in this deck.
Unlock Deck
k this deck
44
Technological change causes a movement along a per-worker production function.
Unlock Deck
Unlock for access to all 118 flashcards in this deck.
Unlock Deck
k this deck
45
The Soviet Union's economic growth rate slowed despite rapid increases in capital per hour worked.
Unlock Deck
Unlock for access to all 118 flashcards in this deck.
Unlock Deck
k this deck
46
Using the points on the following diagram, identify which combinations of these points illustrate diminishing returns to capital. Give a brief explanation to support your answer.
_____________________________________________________________________________________________
_____________________________________________________________________________________________
_____________________________________________________________________________________________
_____________________________________________________________________________________________
Unlock Deck
Unlock for access to all 118 flashcards in this deck.
Unlock Deck
k this deck
47
Knowledge capital is ________ in production and ________. As a result, firms ________ free ride.
A)non-rival; non-excludable; can
B)non-rival; excludable; can
C)rival; non-excludable; cannot
D)non-rival; non-excludable; cannot
A)non-rival; non-excludable; can
B)non-rival; excludable; can
C)rival; non-excludable; cannot
D)non-rival; non-excludable; cannot
Unlock Deck
Unlock for access to all 118 flashcards in this deck.
Unlock Deck
k this deck
48
For how long does a patent give a firm the exclusive legal right to a product in Australia?
A)10 years
B)17 years
C)20 years
D)50 years
A)10 years
B)17 years
C)20 years
D)50 years
Unlock Deck
Unlock for access to all 118 flashcards in this deck.
Unlock Deck
k this deck
49
According to Joseph Schumpeter (1942), the 'theory of creative destruction' describes a process by which:
A)new products unleash a gale of destruction that creates other new products.
B)new products unleash a gale of destruction that drives old products out of the market.
C)new products are created by the destruction of capital.
D)the creation of new products never involves the destruction of old products.
Unlock Deck
Unlock for access to all 118 flashcards in this deck.
Unlock Deck
k this deck
50
If a book, film, or piece of software was created today, for how long would Australian copyright law guarantee exclusive legal rights to the creator to use the creation?
A)10 years
B)20 years
C)the creator's lifetime plus 50 years for the creator's heirs
D)the creator's lifetime plus 70 years for the creator's heirs
A)10 years
B)20 years
C)the creator's lifetime plus 50 years for the creator's heirs
D)the creator's lifetime plus 70 years for the creator's heirs
Unlock Deck
Unlock for access to all 118 flashcards in this deck.
Unlock Deck
k this deck
51
Which of the following is not a policy that can increase the accumulation of knowledge capital?
A)subsidised research and development
B)patent laws to encourage innovation
C)free provision of education
D)removing patent laws to allow for the spread of knowledge
A)subsidised research and development
B)patent laws to encourage innovation
C)free provision of education
D)removing patent laws to allow for the spread of knowledge
Unlock Deck
Unlock for access to all 118 flashcards in this deck.
Unlock Deck
k this deck
52
Your friend owns an ice cream stand which he works by himself. He produces about 25 ice creams per hour. He wants to be able to produce twice as many ice creams per hour so he buys a second machine. He notices that he can only produce 10 more ice creams an hour. He jokes that he could have doubled his output with the second machine if he only had four hands. Using your knowledge of the production process, explain to your friend what you think has happened when he added more capital to his production process.
_____________________________________________________________________________________________
_____________________________________________________________________________________________
_____________________________________________________________________________________________
_____________________________________________________________________________________________
Unlock Deck
Unlock for access to all 118 flashcards in this deck.
Unlock Deck
k this deck
53
Starting at point E in the following diagram, identify which combinations of points illustrate technological change. Give a brief explanation to support your answer.
_____________________________________________________________________________________________
_____________________________________________________________________________________________
_____________________________________________________________________________________________
_____________________________________________________________________________________________
Unlock Deck
Unlock for access to all 118 flashcards in this deck.
Unlock Deck
k this deck
54
The economic growth model focuses on the long-run increase in the productivity of capital.
Unlock Deck
Unlock for access to all 118 flashcards in this deck.
Unlock Deck
k this deck
55
Because 'knowledge capital' is non-excludable and non-rival, firms have an incentive to ________ the research and development of other firms.
A)make bids on
B)not use
C)ignore
D)'free ride' on
A)make bids on
B)not use
C)ignore
D)'free ride' on
Unlock Deck
Unlock for access to all 118 flashcards in this deck.
Unlock Deck
k this deck
56
What is the 'economic growth model'?
_____________________________________________________________________________________________
_____________________________________________________________________________________________
_____________________________________________________________________________________________
_____________________________________________________________________________________________
Unlock Deck
Unlock for access to all 118 flashcards in this deck.
Unlock Deck
k this deck
57
The owner of a firm wants some advice on how to increase productivity. Suggest three ways the entrepreneur could increase labour productivity through improving technology.
_____________________________________________________________________________________________
_____________________________________________________________________________________________
_____________________________________________________________________________________________
_____________________________________________________________________________________________
Unlock Deck
Unlock for access to all 118 flashcards in this deck.
Unlock Deck
k this deck
58
According to 'new growth theory', the market will lead firms to accumulate the efficient level of knowledge capital.
Unlock Deck
Unlock for access to all 118 flashcards in this deck.
Unlock Deck
k this deck
59
According to Joseph Schumpeter, which of the factors of production is central to economic growth?
A)land
B)labour
C)natural resources
D)the entrepreneur
A)land
B)labour
C)natural resources
D)the entrepreneur
Unlock Deck
Unlock for access to all 118 flashcards in this deck.
Unlock Deck
k this deck
60
Which of the following is true about 'new growth theory'?
A)It states that the rate of technological change is determined outside the working of the market system.
B)It does not adequately explain the factors that determine productivity.
C)It states that the rate of technological change is unaffected by economic incentives.
D)It states that the rate of technological change is caused by economic incentives.
Unlock Deck
Unlock for access to all 118 flashcards in this deck.
Unlock Deck
k this deck
61
Because Australian labour markets are more controlled and regulated than those in many European countries, labour productivity has grown relatively faster in Australia.
Unlock Deck
Unlock for access to all 118 flashcards in this deck.
Unlock Deck
k this deck
62
The economic growth model predicts that ________ across countries will converge over time.
A)income levels
B)GDP per capita
C)foreign direct investment rates
D)growth rates
A)income levels
B)GDP per capita
C)foreign direct investment rates
D)growth rates
Unlock Deck
Unlock for access to all 118 flashcards in this deck.
Unlock Deck
k this deck
63
What does the economic growth model predict?
A)GDP per capita of poor countries will grow more rapidly than in rich countries.
B)GDP per capita of rich countries will grow more rapidly than in poor countries.
C)governments must centrally direct the economy for economic growth to occur.
D)GDP per capita of poor countries will never change.
A)GDP per capita of poor countries will grow more rapidly than in rich countries.
B)GDP per capita of rich countries will grow more rapidly than in poor countries.
C)governments must centrally direct the economy for economic growth to occur.
D)GDP per capita of poor countries will never change.
Unlock Deck
Unlock for access to all 118 flashcards in this deck.
Unlock Deck
k this deck
64
The productivity slowdown experienced in Australia from the mid-1970s to the mid-1990s was actually a global phenomenon.
Unlock Deck
Unlock for access to all 118 flashcards in this deck.
Unlock Deck
k this deck
65
Empirical evidence from 1960-2012 shows that convergence in economic growth is occurring in which of the following cases?
A)Low income industrial countries are catching up to high income industrial countries.
B)Low income developing countries are catching up to high income industrial countries.
C)Low income industrial countries are catching up to high income developing countries.
D)All low income countries are catching up to all high income countries.
Unlock Deck
Unlock for access to all 118 flashcards in this deck.
Unlock Deck
k this deck
66
Some economists argued that the productivity slowdown of the mid-1970s to the early 1990s was due to changes in oil prices that:
A)increased production costs, causing firms to reorganise production to conserve energy, which reduced output per worker.
B)decreased production costs, causing firms to reorganise production to conserve energy, which reduced output per worker.
C)increased production costs, causing firms to reorganise production to conserve energy, which increased output per worker.
D)decreased production costs, causing firms to increase production, which reduced output per worker.
Unlock Deck
Unlock for access to all 118 flashcards in this deck.
Unlock Deck
k this deck
67
The best explanation of the labour productivity slowdown in Australia from 1973 through the early 1990s is:
A)tariff protection.
B)market deregulation.
C)high oil prices during that period.
D)technological change occurring too rapidly.
A)tariff protection.
B)market deregulation.
C)high oil prices during that period.
D)technological change occurring too rapidly.
Unlock Deck
Unlock for access to all 118 flashcards in this deck.
Unlock Deck
k this deck
68
The decline in labour productivity rates between 2006 and 2015 resulted in:
A)a rise in labour union membership.
B)an increase in government spending on infrastructure.
C)increased market regulations.
D)decreased investment in technology.
A)a rise in labour union membership.
B)an increase in government spending on infrastructure.
C)increased market regulations.
D)decreased investment in technology.
Unlock Deck
Unlock for access to all 118 flashcards in this deck.
Unlock Deck
k this deck
69
What reasons explain the increase in productivity growth rates that occurred in Australia from the early 1990s to the early 2000s?
_____________________________________________________________________________________________
_____________________________________________________________________________________________
_____________________________________________________________________________________________
_____________________________________________________________________________________________
Unlock Deck
Unlock for access to all 118 flashcards in this deck.
Unlock Deck
k this deck
70
Information technology industries such as computers, mobile phones, computer programming and software:
A)significantly increased labour productivity in the 1990s in Australia.
B)have significantly reduced labour productivity as they have created distractions at work.
C)are unlikely to increase labour productivity into the future, as their benefits have already been gained.
D)increased labour productivity in the 1980s in Australia, but led to a slowdown in labour productivity in the 1990s.
Unlock Deck
Unlock for access to all 118 flashcards in this deck.
Unlock Deck
k this deck
71
Investment and technological changes led to strong economic growth and productivity growth in Australia for approximately 30 years after the end of World War II.
Unlock Deck
Unlock for access to all 118 flashcards in this deck.
Unlock Deck
k this deck
72
Use production functions from the economic growth model to explain why America grew at a much faster rate than the Soviet Union in the latter half of the 20th century.
_____________________________________________________________________________________________
_____________________________________________________________________________________________
_____________________________________________________________________________________________
_____________________________________________________________________________________________
Unlock Deck
Unlock for access to all 118 flashcards in this deck.
Unlock Deck
k this deck
73
What period in Australia's economic history is known as the 'Long Boom'?
A)1940-1970
B)1991-1994
C)2006-2012
D)1861-1891
A)1940-1970
B)1991-1994
C)2006-2012
D)1861-1891
Unlock Deck
Unlock for access to all 118 flashcards in this deck.
Unlock Deck
k this deck
74
The Australian economy experienced a faster increase in productivity between 1995 and 2008 compared to most other leading industrial economies in the G7. Which of the following helps to explain this?
A)Australian unions imposed stricter work rules as compared to unions in the G7.
B)Australian government regulations impose stricter work rules as compared to government regulations in the G7.
C)Australian labour markets were more flexible than labour markets in many other industrial countries.
D)Australian workers could obtain unemployment benefit payments for a longer period of time as compared to the G7 countries.
Unlock Deck
Unlock for access to all 118 flashcards in this deck.
Unlock Deck
k this deck
75
Which of the following was not experienced in the Australian economy from the mid- to late-1800s?
A)an expansion of the labour force
B)a booming export market
C)an increase in capital per hour worked
D)a general decline in labour productivity due to a lack of capital
A)an expansion of the labour force
B)a booming export market
C)an increase in capital per hour worked
D)a general decline in labour productivity due to a lack of capital
Unlock Deck
Unlock for access to all 118 flashcards in this deck.
Unlock Deck
k this deck
76
Which of the following is not an explanation for the revival in the growth of productivity starting in Australia in the early 1990s?
A)Information and communication innovations that were increasingly geared toward improving business processes and not consumer products.
B)High productivity growth in the agricultural sector.
C)Internet use that had increased the efficiency of how firms buy and sell to each other and to consumers.
D)Mobile phones and wireless Internet access increased worker flexibility.
Unlock Deck
Unlock for access to all 118 flashcards in this deck.
Unlock Deck
k this deck
77
One of the results of Paul Romer's new growth theory is that investment in research and development will be too low in an economy. Explain how he comes to this conclusion.
_____________________________________________________________________________________________
_____________________________________________________________________________________________
_____________________________________________________________________________________________
_____________________________________________________________________________________________
Unlock Deck
Unlock for access to all 118 flashcards in this deck.
Unlock Deck
k this deck
78
Because of the productivity slowdown in Australia from the mid-1970s through to the early 1990s:
A)real GDP per capita grew more rapidly.
B)real GDP per capita grew more slowly.
C)the standard of living did not change.
D)the standard of living increased in Australia.
A)real GDP per capita grew more rapidly.
B)real GDP per capita grew more slowly.
C)the standard of living did not change.
D)the standard of living increased in Australia.
Unlock Deck
Unlock for access to all 118 flashcards in this deck.
Unlock Deck
k this deck
79
High oil prices consistently explain why productivity growth rates slow down.
Unlock Deck
Unlock for access to all 118 flashcards in this deck.
Unlock Deck
k this deck
80
Given the fact that the productivity slowdown affected all industrial countries, which of the following explanations for the productivity slowdown in Australia is not likely to be correct?
A)a deterioration of Australia's education system causing a decline in the quality of labour
B)tariff protection
C)lack of sufficient technological change
D)highly regulated markets
A)a deterioration of Australia's education system causing a decline in the quality of labour
B)tariff protection
C)lack of sufficient technological change
D)highly regulated markets
Unlock Deck
Unlock for access to all 118 flashcards in this deck.
Unlock Deck
k this deck
Unlock Deck
Unlock for access to all 118 flashcards in this deck.


