Deck 28: Canadian Inflation,unemployment,and Business Cycle
Full screen (f)
Question
Use the figure below to answer the following questions.
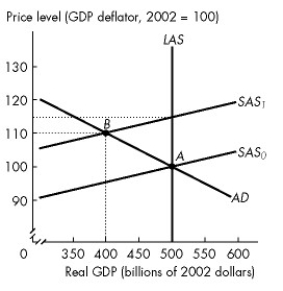
Figure 28.1.2
Refer to Figure 28.1.2.The economy is in long-run equilibrium.If the short-run aggregate supply curve shifts leftward from SAS0 to SAS1,ceteris paribus,then people expected
A)a 10 percent inflation.
B)the price level to rise to 110.
C)the real wage rate to fall by 10 percent.
D)a real GDP decrease of $50 billion.
E)a 15 percent inflation.
Question
Question
Use the figure below to answer the following questions.
Figure 28.1.2
Refer to Figure 28.1.2.Complete the following sentence.The figure illustrates
A)cost-push inflation.
B)demand-pull inflation.
C)a cost-push inflation spiral.
D)a one time rise in the price level.
E)A and C are both correct.
Figure 28.1.2
Refer to Figure 28.1.2.Complete the following sentence.The figure illustrates
A)cost-push inflation.
B)demand-pull inflation.
C)a cost-push inflation spiral.
D)a one time rise in the price level.
E)A and C are both correct.
Question
Question
Question
Question
Question
Question
Question
Use the figure below to answer the following questions.
Figure 28.1.2
Refer to Figure 28.1.2.The economy is in long-run equilibrium.If the short-run aggregate supply curve shifts leftward from SAS0 to SAS1,ceteris paribus,then the actual inflation rate
A)is greater than the expected inflation rate.
B)is less than the expected inflation rate.
C)is the same as the expected inflation rate.
D)cannot be determined without more information.
E)depends on what happens to wage settlements.
Question
Question
Use the figure below to answer the following questions.
Figure 28.1.2
Refer to Figure 28.1.2.If the short-run aggregate supply curve does not shift,and remains at SAS0,then the expected inflation rate is
A)zero.
B)10 percent.
C)15 percent.
D)5 percent.
E)-10 percent.
Figure 28.1.2
Refer to Figure 28.1.2.If the short-run aggregate supply curve does not shift,and remains at SAS0,then the expected inflation rate is
A)zero.
B)10 percent.
C)15 percent.
D)5 percent.
E)-10 percent.
Question
Use the figure below to answer the following questions.
Figure 28.1.2
Refer to Figure 28.1.2.Consider the market for labour as the short-run aggregate supply curve shifts leftward from SAS0 to SAS1.This shift could have been the result of an agreement between workers and employers for a
A)10 percent decrease in the money wage rate.
B)10 percent increase in the money wage rate.
C)15 percent decrease in the money wage rate.
D)15 percent increase in the money wage rate.
E)10 percent increase in the real wage rate.
Question
Question
Question
Use the figure below to answer the following questions.
Figure 28.1.2
Refer to Figure 28.1.2.If SAS shifts from SAS0 to SAS1,then
A)inflation is expected to be 10 percent.
B)inflation will be 10 percent.
C)a recession will occur.
D)unemployment will fall.
E)B and C.
Figure 28.1.2
Refer to Figure 28.1.2.If SAS shifts from SAS0 to SAS1,then
A)inflation is expected to be 10 percent.
B)inflation will be 10 percent.
C)a recession will occur.
D)unemployment will fall.
E)B and C.
Question
Use the figure below to answer the following questions.
Figure 28.1.2
Refer to Figure 28.1.2.The vertical distance between SAS0 and SAS1 represents the
A)actual inflation rate.
B)expected increase in real GDP.
C)actual decrease in real GDP.
D)expected inflation rate.
E)expected decrease in the real wage rate.
Figure 28.1.2
Refer to Figure 28.1.2.The vertical distance between SAS0 and SAS1 represents the
A)actual inflation rate.
B)expected increase in real GDP.
C)actual decrease in real GDP.
D)expected inflation rate.
E)expected decrease in the real wage rate.
Question
Question
Use the figure below to answer the following question.
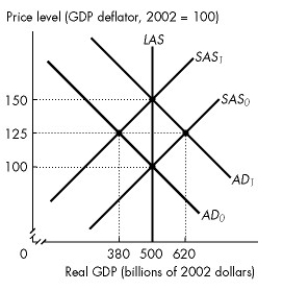
Figure 28.1.1
Refer to Figure 28.1.1.The figure illustrates an economy initially in equilibrium at the intersection of the SAS0 curve and the AD0 curve.Which of the following shifts the short-run aggregate supply curve from SAS0 to SAS1?
A)an increase in the price of oil
B)an increase in the price level
C)an increase in the marginal product of labour
D)an increase in the demand for money
E)a decrease in the money wage rate
Question
Question
Question
Question
Use the figure below to answer the following questions.

Figure 28.1.3
Refer to Figure 28.1.3.Assume that the figure illustrates an economy initially in equilibrium at the intersection of the SAS0 curve and the AD0 curve.If the aggregate demand curve is expected to remain at AD0 but shifts to AD1,the new equilibrium real GDP is ________ and the new equilibrium price level is ________.
A)$380 billion; 125
B)$500 billion; 150
C)$500 billion; 100
D)$620 billion; 125
E)$500 billion; 125
Question
Question
Use the figure below to answer the following question.
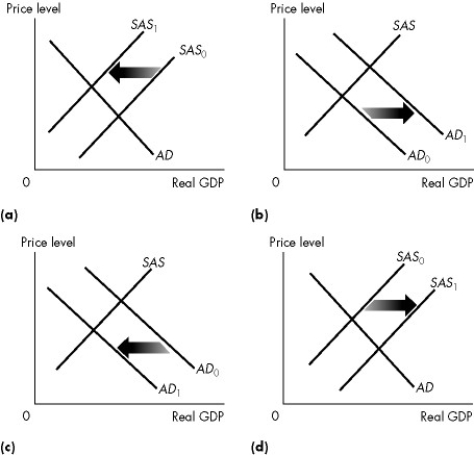
Figure 28.1.5
Refer to Figure 28.1.5.Which one of the graphs in the figure represents an economy experiencing stagflation?
A)(a)
B)(b)
C)(c)
D)(d)
E)none of the above
Figure 28.1.5
Refer to Figure 28.1.5.Which one of the graphs in the figure represents an economy experiencing stagflation?
A)(a)
B)(b)
C)(c)
D)(d)
E)none of the above
Question
Question
Question
Use the figure below to answer the following question.
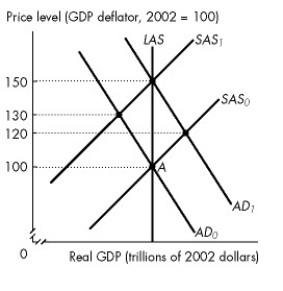
Figure 28.1.4
Refer to Figure 28.1.4.The figure illustrates an economy initially in equilibrium at point A.If the quantity of money is expected to increase by 50 percent,what is the rational expectation of the price level?
A)100
B)120
C)130
D)150
E)We cannot tell without more information on wage negotiations.
Question
Question
Use the figure below to answer the following question.
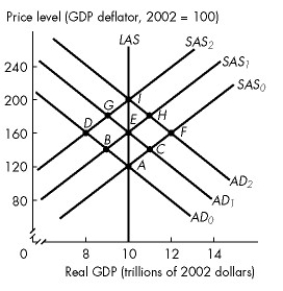
Figure 28.1.6
Refer to Figure 28.1.6.Starting at point A,the initial effect of a demand-pull inflation is a move to point ________.As a demand-pull inflation spiral proceeds,it follows the path ________.
A) E; I
B)C; E, H, I
C)C; B, H, G, I
D)B; E, G, I
E)none of the above
Figure 28.1.6
Refer to Figure 28.1.6.Starting at point A,the initial effect of a demand-pull inflation is a move to point ________.As a demand-pull inflation spiral proceeds,it follows the path ________.
A) E; I
B)C; E, H, I
C)C; B, H, G, I
D)B; E, G, I
E)none of the above
Question
Use the figure below to answer the following questions.
Figure 28.1.3
Refer to Figure 28.1.3.Assume that the figure illustrates an economy initially in equilibrium at the intersection of the SAS0 curve and the AD0 curve.If the aggregate demand curve is correctly expected to shift to AD1,new equilibrium real GDP is ________ and the new equilibrium price level is ________.
A)$380 billion; 125
B)$500 billion; 150
C)$500 billion; 100
D)$620 billion; 125
E)$500 billion; 125
Question
Use the figure below to answer the following question.
Figure 28.1.6
Refer to Figure 28.1.6.Starting at point A,the initial effect of a cost-push inflation is a move to point ________.As a cost-push inflation spiral proceeds,it follows the path ________.
A)C; B, H, G, I
B)C; E, H, I
C)B; E, G, I
D)E; I
E)C; F
Figure 28.1.6
Refer to Figure 28.1.6.Starting at point A,the initial effect of a cost-push inflation is a move to point ________.As a cost-push inflation spiral proceeds,it follows the path ________.
A)C; B, H, G, I
B)C; E, H, I
C)B; E, G, I
D)E; I
E)C; F
Question
Question
Question
Question
Question
Question
Use the figure below to answer the following question.
Figure 28.1.5
Refer to Figure 28.1.5.Which one of the graphs in the figure represents an economy with the price level expected to remain constant?
A)(a)
B)(b)
C)(c)
D)(d)
E)none of the above
Figure 28.1.5
Refer to Figure 28.1.5.Which one of the graphs in the figure represents an economy with the price level expected to remain constant?
A)(a)
B)(b)
C)(c)
D)(d)
E)none of the above
Question
Use the figure below to answer the following questions.
Figure 28.1.3
Refer to Figure 28.1.3.Assume that the figure illustrates an economy initially in equilibrium at the intersection of the SAS0 curve and the AD0 curve.If the aggregate demand curve is expected to shift to AD1 but remains at AD0,the new equilibrium real GDP is ________ and the new equilibrium price level is ________.
A)$380 billion; 100
B)$500 billion; 150
C)$500 billion; 100
D)$620 billion; 125
E)$380 billion; 125
Question
Question
Use the table below to answer the following questions.
Table 28.2.1
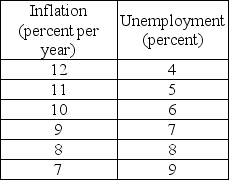
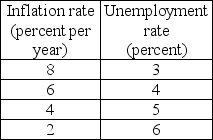
Refer to Table 28.2.1.The table gives points on the short-run Phillips curve for the country of Ruritania.If the expected inflation rate is 10 percent,and the inflation rate unexpectedly falls to 8 percent,what is the unemployment rate?
A)4 percent
B)5 percent
C)6 percent
D)7 percent
E)8 percent
Table 28.2.1
Refer to Table 28.2.1.The table gives points on the short-run Phillips curve for the country of Ruritania.If the expected inflation rate is 10 percent,and the inflation rate unexpectedly falls to 8 percent,what is the unemployment rate?
A)4 percent
B)5 percent
C)6 percent
D)7 percent
E)8 percent
Question
Use the table below to answer the following questions.
Table 28.2.1
Refer to Table 28.2.1.The table gives points on the short-run Phillips curve for the country of Ruritania.If the expected inflation rate is 10 percent,and the inflation rate unexpectedly rises to 12 percent,what is the unemployment rate?
A)4 percent
B)5 percent
C)6 percent
D)7 percent
E)9 percent
Question
Question
Question
Question
Use the figure below to answer the following questions.
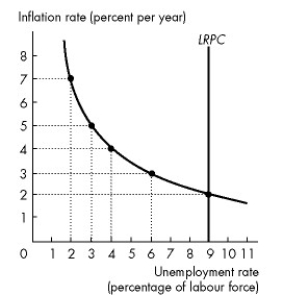
Figure 28.2.2
Refer to Figure 28.2.2.The figure illustrates an economy's Phillips curves. If the expected inflation rate changes to 3 percent,the
A)short run Phillips curve will shift upward and the long run Phillips curve will not change.
B)short run Phillips curve will shift downward and the long run Phillips curve will not change.
C)short run Phillips curve will shift upward and the long run Phillips curve will shift leftward.
D)short run Phillips curve will shift upward and the long run Phillips curve will shift rightward.
E)short run Phillips curve will shift downward and the long run Phillips curve will shift rightward.
Question
Question
Use the figure below to answer the following questions.
Figure 28.2.2
Refer to Figure 28.2.2.The figure illustrates an economy's Phillips curves.What is the natural unemployment rate?
A)9 percent
B)6 percent
C)4 percent
D)7 percent
E)cannot be determined without more information
Figure 28.2.2
Refer to Figure 28.2.2.The figure illustrates an economy's Phillips curves.What is the natural unemployment rate?
A)9 percent
B)6 percent
C)4 percent
D)7 percent
E)cannot be determined without more information
Question
Question
Question
Use the figure below to answer the following questions.
Figure 28.2.2
Refer to Figure 28.2.2.The figure illustrates an economy's Phillips curves.If the current inflation rate is 3 percent,what is the current unemployment rate?
A)9 percent
B)6 percent
C)4 percent
D)3 percent
E)cannot be determined without more information
Figure 28.2.2
Refer to Figure 28.2.2.The figure illustrates an economy's Phillips curves.If the current inflation rate is 3 percent,what is the current unemployment rate?
A)9 percent
B)6 percent
C)4 percent
D)3 percent
E)cannot be determined without more information
Question
Use the figure below to answer the following questions.
Figure 28.2.2
Refer to Figure 28.2.2.The figure illustrates an economy's Phillips curves.If the current inflation rate is 4 percent,what is the current unemployment rate?
A)9 percent
B)6 percent
C)4 percent
D)3 percent
E)cannot be determined without more information
Figure 28.2.2
Refer to Figure 28.2.2.The figure illustrates an economy's Phillips curves.If the current inflation rate is 4 percent,what is the current unemployment rate?
A)9 percent
B)6 percent
C)4 percent
D)3 percent
E)cannot be determined without more information
Question
Use the table below to answer the following questions.
Table 28.2.1
Refer to Table 28.2.1.The table gives points on the short-run Phillips curve for the country of Ruritania.If the expected inflation rate is 10 percent,what is the natural unemployment rate?
A)4 percent
B)5 percent
C)6 percent
D)7 percent
E)9 percent
Table 28.2.1
Refer to Table 28.2.1.The table gives points on the short-run Phillips curve for the country of Ruritania.If the expected inflation rate is 10 percent,what is the natural unemployment rate?
A)4 percent
B)5 percent
C)6 percent
D)7 percent
E)9 percent
Question
Use the figure below to answer the following questions.
Figure 28.2.2
Refer to Figure 28.2.2.The figure illustrates an economy's Phillips curves.What is the expected inflation rate?
A)9 percent
B)4 percent
C)2 percent
D)7 percent
E)cannot be determined without more information
Figure 28.2.2
Refer to Figure 28.2.2.The figure illustrates an economy's Phillips curves.What is the expected inflation rate?
A)9 percent
B)4 percent
C)2 percent
D)7 percent
E)cannot be determined without more information
Question
Question
Question
Question
Use the table below to answer the following questions.
Table 28.2.1
Refer to Table 28.2.1.The table gives points on the short-run Phillips curve for the country of Ruritania.If the expected inflation rate is 10 percent,and the inflation rate unexpectedly rises to 12 percent and stays there for some period of time,the expected inflation rate becomes ________ percent and the natural unemployment rate is ________ percent.
A)12; 4
B)10; 4
C)10; 6
D)12; 6
E)12; 5
Question
Use the figure below to answer the following questions.
Figure 28.2.2
Refer to Figure 28.2.2.The figure illustrates an economy's Phillips curves.If the current inflation rate is 4 percent,what is the natural unemployment rate?
A)9 percent
B)6 percent
C)4 percent
D)3 percent
E)cannot be determined without more information
Figure 28.2.2
Refer to Figure 28.2.2.The figure illustrates an economy's Phillips curves.If the current inflation rate is 4 percent,what is the natural unemployment rate?
A)9 percent
B)6 percent
C)4 percent
D)3 percent
E)cannot be determined without more information
Question
Question
Use the figure below to answer the following questions.
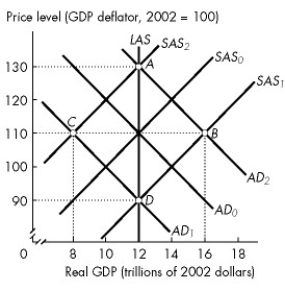
Figure 28.3.1
Refer to Figure 28.3.1.Suppose the economy moves from point D to point B.According to the monetarist theory of the business cycle,what could have caused this movement?
A)a decrease in the money wage rate
B)an increase in uncertainty about future sales and profits
C)an increase in the growth rate of the quantity of money
D)an increase in the money wage rate
E)a decrease in exports
Question
Question
Table 28.2.2
Refer to Table 28.2.2.The economy's natural unemployment rate is 4 percent.Table 28.2.2 gives some points on the economy's short-run Phillips curve.When the unemployment rate is 4 percent ________.
A)actual inflation is greater than expected inflation
B)actual inflation is less than expected inflation
C)and the inflation rate is 6 percent a year, the short-run and long-run Phillips curves intersect
D)and the expected inflation rate is 8 percent a year, the short-run Phillips curve shifts downward
E)aggregate demand increases
Question
Question
Question
Use the figure below to answer the following questions.
Figure 28.3.1
Refer to Figure 28.3.1.Suppose the economy moves from point A to point C.According to the monetarist theory of the business cycle,what could have caused this movement?
A)an increase in the money wage rate
B)an increase in the growth rate of the quantity of money
C)a decrease in the growth rate of the quantity of money
D)an increase in uncertainty
E)animal spirits
Question
Question
Question
Table 28.2.2
Refer to Table 28.2.2.The economy's natural unemployment rate is 4 percent.Table 28.2.2 gives some points on the economy's short-run Phillips curve.If the expected inflation rate rises to 8 percent a year,________.
A)the long-run Phillips curve shifts leftward
B)the short-run Phillips curve shifts upward
C)the short-run Phillips curve shifts downward
D)Both A and B are correct.
E)Both A and C are correct.
Question
Question
Question
Question
Question
Question
Question
Question
Question
Question
Question

Unlock Deck
Sign up to unlock the cards in this deck!
Unlock Deck
Unlock Deck
1/101
Play
Full screen (f)
Deck 28: Canadian Inflation,unemployment,and Business Cycle
1
Use the figure below to answer the following questions.
Figure 28.1.2
Refer to Figure 28.1.2.The economy is in long-run equilibrium.If the short-run aggregate supply curve shifts leftward from SAS0 to SAS1,ceteris paribus,then people expected
A)a 10 percent inflation.
B)the price level to rise to 110.
C)the real wage rate to fall by 10 percent.
D)a real GDP decrease of $50 billion.
E)a 15 percent inflation.
E
2
Demand-pull inflation occurs when
A)aggregate demand increases.
B)aggregate supply decreases.
C)input costs rise.
D)people incorrectly forecast inflation.
E)unemployment is above the natural rate.
A)aggregate demand increases.
B)aggregate supply decreases.
C)input costs rise.
D)people incorrectly forecast inflation.
E)unemployment is above the natural rate.
A
3
Use the figure below to answer the following questions.
Figure 28.1.2
Refer to Figure 28.1.2.Complete the following sentence.The figure illustrates
A)cost-push inflation.
B)demand-pull inflation.
C)a cost-push inflation spiral.
D)a one time rise in the price level.
E)A and C are both correct.
Figure 28.1.2
Refer to Figure 28.1.2.Complete the following sentence.The figure illustrates
A)cost-push inflation.
B)demand-pull inflation.
C)a cost-push inflation spiral.
D)a one time rise in the price level.
E)A and C are both correct.
D
4
Cost-push inflation can result from an initial
A)decrease in personal income taxes.
B)increase in personal income taxes.
C)increase in government expenditure.
D)increase in the money wage rate.
E)increase in transfer payments.
A)decrease in personal income taxes.
B)increase in personal income taxes.
C)increase in government expenditure.
D)increase in the money wage rate.
E)increase in transfer payments.
Unlock Deck
Unlock for access to all 101 flashcards in this deck.
Unlock Deck
k this deck
5
Which one of the following can create a demand-pull inflation?
A)a sharp increase in the price of oil
B)higher wages negotiated by unions
C)a cut in the interest rate
D)a decrease in investment as a result of a decrease in expected future profits
E)a decrease in government expenditure on goods and services
A)a sharp increase in the price of oil
B)higher wages negotiated by unions
C)a cut in the interest rate
D)a decrease in investment as a result of a decrease in expected future profits
E)a decrease in government expenditure on goods and services
Unlock Deck
Unlock for access to all 101 flashcards in this deck.
Unlock Deck
k this deck
6
Which of the following would cause the aggregate demand curve to keep shifting rightward year after year?
A)a one-time tax cut
B)a one-time increase in government expenditures on goods and services
C)inflation
D)excess wage demands
E)a persistent increase in the quantity of money
A)a one-time tax cut
B)a one-time increase in government expenditures on goods and services
C)inflation
D)excess wage demands
E)a persistent increase in the quantity of money
Unlock Deck
Unlock for access to all 101 flashcards in this deck.
Unlock Deck
k this deck
7
Suppose the economy is in long-run equilibrium when the price of oil rises.Which one of the following is not a short-run effect of this situation?
A)an increase in real GDP above long-run real GDP
B)an increase in the price level
C)a decrease in real GDP
D)an increase in unemployment
E)a decrease in consumer spending
A)an increase in real GDP above long-run real GDP
B)an increase in the price level
C)a decrease in real GDP
D)an increase in unemployment
E)a decrease in consumer spending
Unlock Deck
Unlock for access to all 101 flashcards in this deck.
Unlock Deck
k this deck
8
At full employment an increase in the quantity of money (ceteris paribus)can create a
A)demand-pull inflation, as can an increase in government expenditure.
B)demand-pull inflation, but an increase in government expenditure cannot.
C)cost-push inflation, as can an increase in government expenditure.
D)cost-push inflation, but an increase in government expenditure cannot.
E)demand-pull and a cost-push inflation, as can an increase in government expenditure.
Unlock Deck
Unlock for access to all 101 flashcards in this deck.
Unlock Deck
k this deck
9
Stagflation can result from
A)a leftward shift of the demand curve.
B)a rightward shift of the demand curve.
C)a leftward shift of the short-run aggregate supply curve.
D)a rightward shift of the short-run aggregate supply curve.
E)a rightward shift of the long-run aggregate supply curve.
A)a leftward shift of the demand curve.
B)a rightward shift of the demand curve.
C)a leftward shift of the short-run aggregate supply curve.
D)a rightward shift of the short-run aggregate supply curve.
E)a rightward shift of the long-run aggregate supply curve.
Unlock Deck
Unlock for access to all 101 flashcards in this deck.
Unlock Deck
k this deck
10
Use the figure below to answer the following questions.
Figure 28.1.2
Refer to Figure 28.1.2.The economy is in long-run equilibrium.If the short-run aggregate supply curve shifts leftward from SAS0 to SAS1,ceteris paribus,then the actual inflation rate
A)is greater than the expected inflation rate.
B)is less than the expected inflation rate.
C)is the same as the expected inflation rate.
D)cannot be determined without more information.
E)depends on what happens to wage settlements.
Unlock Deck
Unlock for access to all 101 flashcards in this deck.
Unlock Deck
k this deck
11
Suppose OPEC unexpectedly collapses,which leads to a fall in the price of oil. As a result,the price level
A)rises, and real GDP increases.
B)rises, and real GDP decreases.
C)falls, and real GDP increases.
D)falls, and real GDP decreases.
E)rises, and real GDP remains the same.
A)rises, and real GDP increases.
B)rises, and real GDP decreases.
C)falls, and real GDP increases.
D)falls, and real GDP decreases.
E)rises, and real GDP remains the same.
Unlock Deck
Unlock for access to all 101 flashcards in this deck.
Unlock Deck
k this deck
12
Use the figure below to answer the following questions.
Figure 28.1.2
Refer to Figure 28.1.2.If the short-run aggregate supply curve does not shift,and remains at SAS0,then the expected inflation rate is
A)zero.
B)10 percent.
C)15 percent.
D)5 percent.
E)-10 percent.
Figure 28.1.2
Refer to Figure 28.1.2.If the short-run aggregate supply curve does not shift,and remains at SAS0,then the expected inflation rate is
A)zero.
B)10 percent.
C)15 percent.
D)5 percent.
E)-10 percent.
Unlock Deck
Unlock for access to all 101 flashcards in this deck.
Unlock Deck
k this deck
13
Use the figure below to answer the following questions.
Figure 28.1.2
Refer to Figure 28.1.2.Consider the market for labour as the short-run aggregate supply curve shifts leftward from SAS0 to SAS1.This shift could have been the result of an agreement between workers and employers for a
A)10 percent decrease in the money wage rate.
B)10 percent increase in the money wage rate.
C)15 percent decrease in the money wage rate.
D)15 percent increase in the money wage rate.
E)10 percent increase in the real wage rate.
Unlock Deck
Unlock for access to all 101 flashcards in this deck.
Unlock Deck
k this deck
14
Inflation resulting from an increase in aggregate demand is called
A)cost-push inflation.
B)demand-pull inflation.
C)anticipated inflation.
D)unanticipated inflation.
E)political inflation.
A)cost-push inflation.
B)demand-pull inflation.
C)anticipated inflation.
D)unanticipated inflation.
E)political inflation.
Unlock Deck
Unlock for access to all 101 flashcards in this deck.
Unlock Deck
k this deck
15
Stagflation occurs when the economy experiences both
A)rising inflation and increasing real GDP.
B)falling inflation and decreasing real GDP.
C)rising inflation and decreasing real GDP.
D)falling inflation and increasing real GDP.
E)low exports and low imports.
A)rising inflation and increasing real GDP.
B)falling inflation and decreasing real GDP.
C)rising inflation and decreasing real GDP.
D)falling inflation and increasing real GDP.
E)low exports and low imports.
Unlock Deck
Unlock for access to all 101 flashcards in this deck.
Unlock Deck
k this deck
16
Use the figure below to answer the following questions.
Figure 28.1.2
Refer to Figure 28.1.2.If SAS shifts from SAS0 to SAS1,then
A)inflation is expected to be 10 percent.
B)inflation will be 10 percent.
C)a recession will occur.
D)unemployment will fall.
E)B and C.
Figure 28.1.2
Refer to Figure 28.1.2.If SAS shifts from SAS0 to SAS1,then
A)inflation is expected to be 10 percent.
B)inflation will be 10 percent.
C)a recession will occur.
D)unemployment will fall.
E)B and C.
Unlock Deck
Unlock for access to all 101 flashcards in this deck.
Unlock Deck
k this deck
17
Use the figure below to answer the following questions.
Figure 28.1.2
Refer to Figure 28.1.2.The vertical distance between SAS0 and SAS1 represents the
A)actual inflation rate.
B)expected increase in real GDP.
C)actual decrease in real GDP.
D)expected inflation rate.
E)expected decrease in the real wage rate.
Figure 28.1.2
Refer to Figure 28.1.2.The vertical distance between SAS0 and SAS1 represents the
A)actual inflation rate.
B)expected increase in real GDP.
C)actual decrease in real GDP.
D)expected inflation rate.
E)expected decrease in the real wage rate.
Unlock Deck
Unlock for access to all 101 flashcards in this deck.
Unlock Deck
k this deck
18
A cost-price inflation spiral results if the policy response to stagflation is to keep
A)decreasing aggregate demand.
B)decreasing short-run aggregate supply.
C)increasing aggregate demand.
D)increasing short-run aggregate supply.
E)doing nothing.
A)decreasing aggregate demand.
B)decreasing short-run aggregate supply.
C)increasing aggregate demand.
D)increasing short-run aggregate supply.
E)doing nothing.
Unlock Deck
Unlock for access to all 101 flashcards in this deck.
Unlock Deck
k this deck
19
Use the figure below to answer the following question.
Figure 28.1.1
Refer to Figure 28.1.1.The figure illustrates an economy initially in equilibrium at the intersection of the SAS0 curve and the AD0 curve.Which of the following shifts the short-run aggregate supply curve from SAS0 to SAS1?
A)an increase in the price of oil
B)an increase in the price level
C)an increase in the marginal product of labour
D)an increase in the demand for money
E)a decrease in the money wage rate
Unlock Deck
Unlock for access to all 101 flashcards in this deck.
Unlock Deck
k this deck
20
An increase in the price level due to an increase in the price of oil
A)creates stagflation in the short-run and will trigger a cost-push inflation.
B)creates stagflation in the short-run and may trigger off a cost-push inflation.
C)increases output above potential GDP.
D)leads to an increase in the money wage rate.
E)leads to a decrease in the money wage rate.
A)creates stagflation in the short-run and will trigger a cost-push inflation.
B)creates stagflation in the short-run and may trigger off a cost-push inflation.
C)increases output above potential GDP.
D)leads to an increase in the money wage rate.
E)leads to a decrease in the money wage rate.
Unlock Deck
Unlock for access to all 101 flashcards in this deck.
Unlock Deck
k this deck
21
Suppose aggregate demand increases by more than expected.Which of the following describes what occurs?
A)Real GDP is greater than potential GDP.
B)The price level rises.
C)Unemployment falls.
D)The natural unemployment rate does not change.
E)All of the above.
A)Real GDP is greater than potential GDP.
B)The price level rises.
C)Unemployment falls.
D)The natural unemployment rate does not change.
E)All of the above.
Unlock Deck
Unlock for access to all 101 flashcards in this deck.
Unlock Deck
k this deck
22
The economy starts out at a full-employment equilibrium.Some events then occur that generate a cost-push inflation. Which of the following events might cause a cost-push inflation?
A)a decrease in exports
B)an increase in the quantity of money
C)a decrease in government expenditure
D)an increase in the money wage rate or an increase in the money prices of raw materials
E)an increase in taxes
A)a decrease in exports
B)an increase in the quantity of money
C)a decrease in government expenditure
D)an increase in the money wage rate or an increase in the money prices of raw materials
E)an increase in taxes
Unlock Deck
Unlock for access to all 101 flashcards in this deck.
Unlock Deck
k this deck
23
Use the figure below to answer the following questions.
Figure 28.1.3
Refer to Figure 28.1.3.Assume that the figure illustrates an economy initially in equilibrium at the intersection of the SAS0 curve and the AD0 curve.If the aggregate demand curve is expected to remain at AD0 but shifts to AD1,the new equilibrium real GDP is ________ and the new equilibrium price level is ________.
A)$380 billion; 125
B)$500 billion; 150
C)$500 billion; 100
D)$620 billion; 125
E)$500 billion; 125
Unlock Deck
Unlock for access to all 101 flashcards in this deck.
Unlock Deck
k this deck
24
A correctly anticipated increase in the quantity of money
A)increases the price level with no change in real GDP.
B)does not change the price level or real GDP.
C)does not change the price level but increases real GDP.
D)increases the price level and increases real GDP.
E)does not change the price level but decreases real GDP.
A)increases the price level with no change in real GDP.
B)does not change the price level or real GDP.
C)does not change the price level but increases real GDP.
D)increases the price level and increases real GDP.
E)does not change the price level but decreases real GDP.
Unlock Deck
Unlock for access to all 101 flashcards in this deck.
Unlock Deck
k this deck
25
Use the figure below to answer the following question.
Figure 28.1.5
Refer to Figure 28.1.5.Which one of the graphs in the figure represents an economy experiencing stagflation?
A)(a)
B)(b)
C)(c)
D)(d)
E)none of the above
Figure 28.1.5
Refer to Figure 28.1.5.Which one of the graphs in the figure represents an economy experiencing stagflation?
A)(a)
B)(b)
C)(c)
D)(d)
E)none of the above
Unlock Deck
Unlock for access to all 101 flashcards in this deck.
Unlock Deck
k this deck
26
An economy is in long-run equilibrium when aggregate supply unexpectedly decreases. Then real GDP (ceteris paribus)will be
A)above potential GDP.
B)below potential GDP.
C)equal to potential GDP.
D)either above, below, or equal to potential GDP depending on the position of the aggregate demand curve.
E)either above or equal to potential GDP depending on the position of the aggregate demand curve.
A)above potential GDP.
B)below potential GDP.
C)equal to potential GDP.
D)either above, below, or equal to potential GDP depending on the position of the aggregate demand curve.
E)either above or equal to potential GDP depending on the position of the aggregate demand curve.
Unlock Deck
Unlock for access to all 101 flashcards in this deck.
Unlock Deck
k this deck
27
The economy starts out at a full-employment equilibrium.Some events then occur that generate a demand-pull inflation. All of the following events except an increase in ________ might cause a demand-pull inflation.
A)the money wage rate
B)exports
C)the quantity of money
D)government expenditure
E)transfer payments
A)the money wage rate
B)exports
C)the quantity of money
D)government expenditure
E)transfer payments
Unlock Deck
Unlock for access to all 101 flashcards in this deck.
Unlock Deck
k this deck
28
Use the figure below to answer the following question.
Figure 28.1.4
Refer to Figure 28.1.4.The figure illustrates an economy initially in equilibrium at point A.If the quantity of money is expected to increase by 50 percent,what is the rational expectation of the price level?
A)100
B)120
C)130
D)150
E)We cannot tell without more information on wage negotiations.
Unlock Deck
Unlock for access to all 101 flashcards in this deck.
Unlock Deck
k this deck
29
Suppose the quantity of money is expected to remain unchanged but it actually increases.The price level
A)rises and real GDP increases.
B)rises and real GDP decreases.
C)falls and real GDP increases.
D)falls and real GDP decreases.
E)rises and real GDP stays the same.
A)rises and real GDP increases.
B)rises and real GDP decreases.
C)falls and real GDP increases.
D)falls and real GDP decreases.
E)rises and real GDP stays the same.
Unlock Deck
Unlock for access to all 101 flashcards in this deck.
Unlock Deck
k this deck
30
Use the figure below to answer the following question.
Figure 28.1.6
Refer to Figure 28.1.6.Starting at point A,the initial effect of a demand-pull inflation is a move to point ________.As a demand-pull inflation spiral proceeds,it follows the path ________.
A) E; I
B)C; E, H, I
C)C; B, H, G, I
D)B; E, G, I
E)none of the above
Figure 28.1.6
Refer to Figure 28.1.6.Starting at point A,the initial effect of a demand-pull inflation is a move to point ________.As a demand-pull inflation spiral proceeds,it follows the path ________.
A) E; I
B)C; E, H, I
C)C; B, H, G, I
D)B; E, G, I
E)none of the above
Unlock Deck
Unlock for access to all 101 flashcards in this deck.
Unlock Deck
k this deck
31
Use the figure below to answer the following questions.
Figure 28.1.3
Refer to Figure 28.1.3.Assume that the figure illustrates an economy initially in equilibrium at the intersection of the SAS0 curve and the AD0 curve.If the aggregate demand curve is correctly expected to shift to AD1,new equilibrium real GDP is ________ and the new equilibrium price level is ________.
A)$380 billion; 125
B)$500 billion; 150
C)$500 billion; 100
D)$620 billion; 125
E)$500 billion; 125
Unlock Deck
Unlock for access to all 101 flashcards in this deck.
Unlock Deck
k this deck
32
Use the figure below to answer the following question.
Figure 28.1.6
Refer to Figure 28.1.6.Starting at point A,the initial effect of a cost-push inflation is a move to point ________.As a cost-push inflation spiral proceeds,it follows the path ________.
A)C; B, H, G, I
B)C; E, H, I
C)B; E, G, I
D)E; I
E)C; F
Figure 28.1.6
Refer to Figure 28.1.6.Starting at point A,the initial effect of a cost-push inflation is a move to point ________.As a cost-push inflation spiral proceeds,it follows the path ________.
A)C; B, H, G, I
B)C; E, H, I
C)B; E, G, I
D)E; I
E)C; F
Unlock Deck
Unlock for access to all 101 flashcards in this deck.
Unlock Deck
k this deck
33
A forecast based on all the relevant information is
A)an adaptive expectation.
B)a future expectation.
C)a rational expectation.
D)always a correct expectation.
E)a perfect forecast.
A)an adaptive expectation.
B)a future expectation.
C)a rational expectation.
D)always a correct expectation.
E)a perfect forecast.
Unlock Deck
Unlock for access to all 101 flashcards in this deck.
Unlock Deck
k this deck
34
A forecast that is based on all the relevant information available is
A)usually no better than a random guess given that the future bears many uncertainties.
B)usually accurate.
C)called a rational expectation.
D)useful only in the prediction of cost-push inflation.
E)useful only in the prediction of demand-pull inflation.
A)usually no better than a random guess given that the future bears many uncertainties.
B)usually accurate.
C)called a rational expectation.
D)useful only in the prediction of cost-push inflation.
E)useful only in the prediction of demand-pull inflation.
Unlock Deck
Unlock for access to all 101 flashcards in this deck.
Unlock Deck
k this deck
35
When the price level is rising and simultaneously real GDP is decreasing
A)the natural unemployment rate is rising.
B)the natural unemployment rate is falling.
C)stagflation is occurring.
D)the economy is experiencing an expansionary gap.
E)Both A and C are correct.
A)the natural unemployment rate is rising.
B)the natural unemployment rate is falling.
C)stagflation is occurring.
D)the economy is experiencing an expansionary gap.
E)Both A and C are correct.
Unlock Deck
Unlock for access to all 101 flashcards in this deck.
Unlock Deck
k this deck
36
Suppose that the money prices of raw materials rise.With no action by the Bank of Canada, I. the aggregate demand curve shifts rightward and the price level rises.
II. the aggregate demand curve shifts rightward and the aggregate supply curve shifts leftward.
III. the initial outcome is lower employment and a rise in the price level.
A)I only
B)II only
C)III only
D)I and II only
E)I, II, and III
II. the aggregate demand curve shifts rightward and the aggregate supply curve shifts leftward.
III. the initial outcome is lower employment and a rise in the price level.
A)I only
B)II only
C)III only
D)I and II only
E)I, II, and III
Unlock Deck
Unlock for access to all 101 flashcards in this deck.
Unlock Deck
k this deck
37
Stagflation is the result of
A)a decrease in aggregate demand.
B)a decrease in short-run aggregate supply.
C)an increase in aggregate demand.
D)an increase in short-run aggregate supply.
E)a decrease in short-run aggregate supply combined with a simultaneous increase in aggregate supply.
A)a decrease in aggregate demand.
B)a decrease in short-run aggregate supply.
C)an increase in aggregate demand.
D)an increase in short-run aggregate supply.
E)a decrease in short-run aggregate supply combined with a simultaneous increase in aggregate supply.
Unlock Deck
Unlock for access to all 101 flashcards in this deck.
Unlock Deck
k this deck
38
Use the figure below to answer the following question.
Figure 28.1.5
Refer to Figure 28.1.5.Which one of the graphs in the figure represents an economy with the price level expected to remain constant?
A)(a)
B)(b)
C)(c)
D)(d)
E)none of the above
Figure 28.1.5
Refer to Figure 28.1.5.Which one of the graphs in the figure represents an economy with the price level expected to remain constant?
A)(a)
B)(b)
C)(c)
D)(d)
E)none of the above
Unlock Deck
Unlock for access to all 101 flashcards in this deck.
Unlock Deck
k this deck
39
Use the figure below to answer the following questions.
Figure 28.1.3
Refer to Figure 28.1.3.Assume that the figure illustrates an economy initially in equilibrium at the intersection of the SAS0 curve and the AD0 curve.If the aggregate demand curve is expected to shift to AD1 but remains at AD0,the new equilibrium real GDP is ________ and the new equilibrium price level is ________.
A)$380 billion; 100
B)$500 billion; 150
C)$500 billion; 100
D)$620 billion; 125
E)$380 billion; 125
Unlock Deck
Unlock for access to all 101 flashcards in this deck.
Unlock Deck
k this deck
40
A correctly anticipated increase in the quantity of money,in an economy with an unchanging long-run aggregate supply,will result in
A)a rise in the price level and an increase in real GDP.
B)a rise in the price level and a decrease in real GDP.
C)a proportional rise in the price level and no change in real GDP.
D)no change in the price level and an increase in real GDP.
E)no change in the price level and no change in real GDP.
A)a rise in the price level and an increase in real GDP.
B)a rise in the price level and a decrease in real GDP.
C)a proportional rise in the price level and no change in real GDP.
D)no change in the price level and an increase in real GDP.
E)no change in the price level and no change in real GDP.
Unlock Deck
Unlock for access to all 101 flashcards in this deck.
Unlock Deck
k this deck
41
Use the table below to answer the following questions.
Table 28.2.1
Refer to Table 28.2.1.The table gives points on the short-run Phillips curve for the country of Ruritania.If the expected inflation rate is 10 percent,and the inflation rate unexpectedly falls to 8 percent,what is the unemployment rate?
A)4 percent
B)5 percent
C)6 percent
D)7 percent
E)8 percent
Unlock Deck
Unlock for access to all 101 flashcards in this deck.
Unlock Deck
k this deck
42
Use the table below to answer the following questions.
Table 28.2.1
Refer to Table 28.2.1.The table gives points on the short-run Phillips curve for the country of Ruritania.If the expected inflation rate is 10 percent,and the inflation rate unexpectedly rises to 12 percent,what is the unemployment rate?
A)4 percent
B)5 percent
C)6 percent
D)7 percent
E)9 percent
Unlock Deck
Unlock for access to all 101 flashcards in this deck.
Unlock Deck
k this deck
43
For a given expected inflation rate,the higher the unemployment rate,the lower is the actual inflation rate.This relationship is the ________ Phillips curve.When the expected inflation rate changes,this is shown as a movement along the ________ Phillips curve.
A)short-run; short-run
B)long-run; long-run
C)long-run; natural
D)natural; short-run
E)short-run; long-run
A)short-run; short-run
B)long-run; long-run
C)long-run; natural
D)natural; short-run
E)short-run; long-run
Unlock Deck
Unlock for access to all 101 flashcards in this deck.
Unlock Deck
k this deck
44
An increase in the expected rate of inflation shifts the
A)short-run Phillips curve downward.
B)short-run Phillips curve upward.
C)long-run Phillips curve rightward.
D)long-run Phillips curve leftward.
E)B and C are correct.
A)short-run Phillips curve downward.
B)short-run Phillips curve upward.
C)long-run Phillips curve rightward.
D)long-run Phillips curve leftward.
E)B and C are correct.
Unlock Deck
Unlock for access to all 101 flashcards in this deck.
Unlock Deck
k this deck
45
The short-run Phillips curve shows the relationship between
A)the price level and real GDP in the short run.
B)the price level and unemployment in the short run.
C)unemployment and real GDP in the short run.
D)inflation and unemployment, when inflation expectations can change.
E)inflation and unemployment, when the expected inflation rate and the natural unemployment rate remain constant.
Unlock Deck
Unlock for access to all 101 flashcards in this deck.
Unlock Deck
k this deck
46
Use the figure below to answer the following questions.
Figure 28.2.2
Refer to Figure 28.2.2.The figure illustrates an economy's Phillips curves. If the expected inflation rate changes to 3 percent,the
A)short run Phillips curve will shift upward and the long run Phillips curve will not change.
B)short run Phillips curve will shift downward and the long run Phillips curve will not change.
C)short run Phillips curve will shift upward and the long run Phillips curve will shift leftward.
D)short run Phillips curve will shift upward and the long run Phillips curve will shift rightward.
E)short run Phillips curve will shift downward and the long run Phillips curve will shift rightward.
Unlock Deck
Unlock for access to all 101 flashcards in this deck.
Unlock Deck
k this deck
47
Along the short-run Phillips curve,everything remaining the same,the higher the
A)unemployment rate, the lower the inflation rate.
B)price level, the lower the inflation rate.
C)money wage rate, the lower is the unemployment rate.
D)quantity of money, the lower the unemployment rate.
E)growth rate of the quantity of money, the higher the inflation rate.
A)unemployment rate, the lower the inflation rate.
B)price level, the lower the inflation rate.
C)money wage rate, the lower is the unemployment rate.
D)quantity of money, the lower the unemployment rate.
E)growth rate of the quantity of money, the higher the inflation rate.
Unlock Deck
Unlock for access to all 101 flashcards in this deck.
Unlock Deck
k this deck
48
Use the figure below to answer the following questions.
Figure 28.2.2
Refer to Figure 28.2.2.The figure illustrates an economy's Phillips curves.What is the natural unemployment rate?
A)9 percent
B)6 percent
C)4 percent
D)7 percent
E)cannot be determined without more information
Figure 28.2.2
Refer to Figure 28.2.2.The figure illustrates an economy's Phillips curves.What is the natural unemployment rate?
A)9 percent
B)6 percent
C)4 percent
D)7 percent
E)cannot be determined without more information
Unlock Deck
Unlock for access to all 101 flashcards in this deck.
Unlock Deck
k this deck
49
If the natural unemployment rate rises
A)the long-run Phillips curve shifts rightward and the short-run Phillips curve does not change.
B)the long-run Phillips curve shifts leftward and the short-run Phillips curve does not change.
C)the short-run Phillips curve shifts rightward and the long-run Phillips curve does not change.
D)the short-run and long-run Phillips curves both shift leftward.
E)the short-run and long-run Phillips curves both shift rightward.
Unlock Deck
Unlock for access to all 101 flashcards in this deck.
Unlock Deck
k this deck
50
If the unemployment rate rises and the inflation rate falls,while the natural unemployment rate and the expected inflation rate remain constant,then we are studying a movement along the
A)aggregate demand curve.
B)long-run aggregate supply curve.
C)Friedman curve.
D)short-run Phillips curve.
E)Phelps-Friedman curve.
A)aggregate demand curve.
B)long-run aggregate supply curve.
C)Friedman curve.
D)short-run Phillips curve.
E)Phelps-Friedman curve.
Unlock Deck
Unlock for access to all 101 flashcards in this deck.
Unlock Deck
k this deck
51
Use the figure below to answer the following questions.
Figure 28.2.2
Refer to Figure 28.2.2.The figure illustrates an economy's Phillips curves.If the current inflation rate is 3 percent,what is the current unemployment rate?
A)9 percent
B)6 percent
C)4 percent
D)3 percent
E)cannot be determined without more information
Figure 28.2.2
Refer to Figure 28.2.2.The figure illustrates an economy's Phillips curves.If the current inflation rate is 3 percent,what is the current unemployment rate?
A)9 percent
B)6 percent
C)4 percent
D)3 percent
E)cannot be determined without more information
Unlock Deck
Unlock for access to all 101 flashcards in this deck.
Unlock Deck
k this deck
52
Use the figure below to answer the following questions.
Figure 28.2.2
Refer to Figure 28.2.2.The figure illustrates an economy's Phillips curves.If the current inflation rate is 4 percent,what is the current unemployment rate?
A)9 percent
B)6 percent
C)4 percent
D)3 percent
E)cannot be determined without more information
Figure 28.2.2
Refer to Figure 28.2.2.The figure illustrates an economy's Phillips curves.If the current inflation rate is 4 percent,what is the current unemployment rate?
A)9 percent
B)6 percent
C)4 percent
D)3 percent
E)cannot be determined without more information
Unlock Deck
Unlock for access to all 101 flashcards in this deck.
Unlock Deck
k this deck
53
Use the table below to answer the following questions.
Table 28.2.1
Refer to Table 28.2.1.The table gives points on the short-run Phillips curve for the country of Ruritania.If the expected inflation rate is 10 percent,what is the natural unemployment rate?
A)4 percent
B)5 percent
C)6 percent
D)7 percent
E)9 percent
Table 28.2.1
Refer to Table 28.2.1.The table gives points on the short-run Phillips curve for the country of Ruritania.If the expected inflation rate is 10 percent,what is the natural unemployment rate?
A)4 percent
B)5 percent
C)6 percent
D)7 percent
E)9 percent
Unlock Deck
Unlock for access to all 101 flashcards in this deck.
Unlock Deck
k this deck
54
Use the figure below to answer the following questions.
Figure 28.2.2
Refer to Figure 28.2.2.The figure illustrates an economy's Phillips curves.What is the expected inflation rate?
A)9 percent
B)4 percent
C)2 percent
D)7 percent
E)cannot be determined without more information
Figure 28.2.2
Refer to Figure 28.2.2.The figure illustrates an economy's Phillips curves.What is the expected inflation rate?
A)9 percent
B)4 percent
C)2 percent
D)7 percent
E)cannot be determined without more information
Unlock Deck
Unlock for access to all 101 flashcards in this deck.
Unlock Deck
k this deck
55
Along the short-run Phillips curve,if the actual unemployment rate falls below the natural unemployment rate,the
A)actual inflation rate will be equal to the expected inflation rate.
B)actual inflation rate will be greater than the expected inflation rate.
C)actual inflation rate will be less than the expected inflation rate.
D)actual inflation rate may be greater than, equal to, or less than the expected inflation rate
E)expected inflation rate will fall to zero.
Unlock Deck
Unlock for access to all 101 flashcards in this deck.
Unlock Deck
k this deck
56
A movement down along the short-run Phillips curve results from an unanticipated
A)decrease in aggregate demand.
B)increase in aggregate demand.
C)decrease in short-run aggregate supply.
D)increase in short-run aggregate supply.
E)increase in the natural unemployment rate.
A)decrease in aggregate demand.
B)increase in aggregate demand.
C)decrease in short-run aggregate supply.
D)increase in short-run aggregate supply.
E)increase in the natural unemployment rate.
Unlock Deck
Unlock for access to all 101 flashcards in this deck.
Unlock Deck
k this deck
57
If the natural unemployment rate falls
A)the long-run Phillips curve shifts rightward and the short-run Phillips curve does not change.
B)the long-run Phillips curve shifts leftward and the short-run Phillips curve does not change.
C)the short-run Phillips curve shifts rightward.
D)the short-run and long-run Phillips curves both shift leftward.
E)the short-run and long-run Phillips curves both shift rightward.
Unlock Deck
Unlock for access to all 101 flashcards in this deck.
Unlock Deck
k this deck
58
Use the table below to answer the following questions.
Table 28.2.1
Refer to Table 28.2.1.The table gives points on the short-run Phillips curve for the country of Ruritania.If the expected inflation rate is 10 percent,and the inflation rate unexpectedly rises to 12 percent and stays there for some period of time,the expected inflation rate becomes ________ percent and the natural unemployment rate is ________ percent.
A)12; 4
B)10; 4
C)10; 6
D)12; 6
E)12; 5
Unlock Deck
Unlock for access to all 101 flashcards in this deck.
Unlock Deck
k this deck
59
Use the figure below to answer the following questions.
Figure 28.2.2
Refer to Figure 28.2.2.The figure illustrates an economy's Phillips curves.If the current inflation rate is 4 percent,what is the natural unemployment rate?
A)9 percent
B)6 percent
C)4 percent
D)3 percent
E)cannot be determined without more information
Figure 28.2.2
Refer to Figure 28.2.2.The figure illustrates an economy's Phillips curves.If the current inflation rate is 4 percent,what is the natural unemployment rate?
A)9 percent
B)6 percent
C)4 percent
D)3 percent
E)cannot be determined without more information
Unlock Deck
Unlock for access to all 101 flashcards in this deck.
Unlock Deck
k this deck
60
The short-run Phillips curve shows the relationship between ________ holding constant the expected inflation rate and the natural unemployment rate.
A)the inflation rate and the economic growth rate
B)unemployment and the economic growth rate
C)the inflation rate and the unemployment rate
D)growth and potential GDP.
E)the inflation rate and the growth of the money wage rate.
A)the inflation rate and the economic growth rate
B)unemployment and the economic growth rate
C)the inflation rate and the unemployment rate
D)growth and potential GDP.
E)the inflation rate and the growth of the money wage rate.
Unlock Deck
Unlock for access to all 101 flashcards in this deck.
Unlock Deck
k this deck
61
Use the figure below to answer the following questions.
Figure 28.3.1
Refer to Figure 28.3.1.Suppose the economy moves from point D to point B.According to the monetarist theory of the business cycle,what could have caused this movement?
A)a decrease in the money wage rate
B)an increase in uncertainty about future sales and profits
C)an increase in the growth rate of the quantity of money
D)an increase in the money wage rate
E)a decrease in exports
Unlock Deck
Unlock for access to all 101 flashcards in this deck.
Unlock Deck
k this deck
62
In new classical cycle theory,________ bring fluctuations in real GDP around potential GDP.
A)unexpected changes in aggregate demand
B)expected changes in aggregate demand
C)fluctuations in money growth with rigid wages
D)fluctuations in investment coupled with rigid wages
E)expected changes in labour productivity
A)unexpected changes in aggregate demand
B)expected changes in aggregate demand
C)fluctuations in money growth with rigid wages
D)fluctuations in investment coupled with rigid wages
E)expected changes in labour productivity
Unlock Deck
Unlock for access to all 101 flashcards in this deck.
Unlock Deck
k this deck
63
Table 28.2.2
Refer to Table 28.2.2.The economy's natural unemployment rate is 4 percent.Table 28.2.2 gives some points on the economy's short-run Phillips curve.When the unemployment rate is 4 percent ________.
A)actual inflation is greater than expected inflation
B)actual inflation is less than expected inflation
C)and the inflation rate is 6 percent a year, the short-run and long-run Phillips curves intersect
D)and the expected inflation rate is 8 percent a year, the short-run Phillips curve shifts downward
E)aggregate demand increases
Unlock Deck
Unlock for access to all 101 flashcards in this deck.
Unlock Deck
k this deck
64
The Canadian long-run Phillips curve ________ when the expected inflation rate rises and ________ when the expected inflation rate falls. The Canadian long-run Phillips curve ________ when the natural unemployment rate increases and ________ when the natural unemployment rate decreases.
A)does not shift; does not shift; does not shift; does not shift
B)does not shift; does not shift; shifts rightward; shifts leftward
C)shifts upward; shifts downward; shifts rightward; shifts leftward
D)shifts rightward; shifts leftward; does not shift; does not shift
E)shifts rightward; shifts leftward; shifts rightward; shifts leftward
Unlock Deck
Unlock for access to all 101 flashcards in this deck.
Unlock Deck
k this deck
65
If the inflation rate is lower than the expected inflation rate,
A)unemployment is above the natural rate.
B)the natural unemployment rate will increase.
C)the expected inflation rate will increase.
D)unemployment is below the natural rate.
E)the economy is not operating on the short-run Phillips curve.
A)unemployment is above the natural rate.
B)the natural unemployment rate will increase.
C)the expected inflation rate will increase.
D)unemployment is below the natural rate.
E)the economy is not operating on the short-run Phillips curve.
Unlock Deck
Unlock for access to all 101 flashcards in this deck.
Unlock Deck
k this deck
66
Use the figure below to answer the following questions.
Figure 28.3.1
Refer to Figure 28.3.1.Suppose the economy moves from point A to point C.According to the monetarist theory of the business cycle,what could have caused this movement?
A)an increase in the money wage rate
B)an increase in the growth rate of the quantity of money
C)a decrease in the growth rate of the quantity of money
D)an increase in uncertainty
E)animal spirits
Unlock Deck
Unlock for access to all 101 flashcards in this deck.
Unlock Deck
k this deck
67
If there is a fully anticipated increase in the inflation rate
A)unemployment will be below the natural rate.
B)unemployment will be above the natural rate.
C)the natural unemployment rate will increase.
D)the economy is not operating on the LRPC curve.
E)the economy is operating on the LRPC curve.
A)unemployment will be below the natural rate.
B)unemployment will be above the natural rate.
C)the natural unemployment rate will increase.
D)the economy is not operating on the LRPC curve.
E)the economy is operating on the LRPC curve.
Unlock Deck
Unlock for access to all 101 flashcards in this deck.
Unlock Deck
k this deck
68
The ________ cycle theory states that only unexpected fluctuations in aggregate demand bring fluctuations in real GDP around potential GDP.
A)new Keynesian
B)new classical
C)Keynesian
D)monetarist
E)real business
A)new Keynesian
B)new classical
C)Keynesian
D)monetarist
E)real business
Unlock Deck
Unlock for access to all 101 flashcards in this deck.
Unlock Deck
k this deck
69
Table 28.2.2
Refer to Table 28.2.2.The economy's natural unemployment rate is 4 percent.Table 28.2.2 gives some points on the economy's short-run Phillips curve.If the expected inflation rate rises to 8 percent a year,________.
A)the long-run Phillips curve shifts leftward
B)the short-run Phillips curve shifts upward
C)the short-run Phillips curve shifts downward
D)Both A and B are correct.
E)Both A and C are correct.
Unlock Deck
Unlock for access to all 101 flashcards in this deck.
Unlock Deck
k this deck
70
In the Keynesian business cycle theory,business cycles begin with a change in
A)inflation expectations.
B)government expenditure.
C)business confidence.
D)monetary policy.
E)the money wage rate.
A)inflation expectations.
B)government expenditure.
C)business confidence.
D)monetary policy.
E)the money wage rate.
Unlock Deck
Unlock for access to all 101 flashcards in this deck.
Unlock Deck
k this deck
71
Which of the following is not a mainstream theory of the business cycle?
A)Keynesian cycle theory
B)Monetarist cycle theory
C)New Keynesian cycle theory
D)Real business cycle theory
E)New classical cycle theory
A)Keynesian cycle theory
B)Monetarist cycle theory
C)New Keynesian cycle theory
D)Real business cycle theory
E)New classical cycle theory
Unlock Deck
Unlock for access to all 101 flashcards in this deck.
Unlock Deck
k this deck
72
________ states that the main source of economic fluctuations is fluctuations in business confidence.
A)Real business cycle theory
B)New classical cycle theory
C)Keynesian cycle theory
D)Monetarist cycle theory
E)None of the above
A)Real business cycle theory
B)New classical cycle theory
C)Keynesian cycle theory
D)Monetarist cycle theory
E)None of the above
Unlock Deck
Unlock for access to all 101 flashcards in this deck.
Unlock Deck
k this deck
73
The Canadian short-run Phillips curve ________ when the expected inflation rate rises and ________ when the expected inflation rate falls. The Canadian short-run Phillips curve ________ when the natural unemployment rate increases and ________ when the natural unemployment rate decreases.
A)shifts downward; shifts upward; shifts rightward; shifts leftward
B)does not shift; does not shift; shifts rightward; shifts leftward
C)shifts upward; shifts downward; does not shift; does not shift
D)shifts upward; shifts downward; shifts rightward; shifts leftward
E)shifts upward; does not shift; shifts rightward; does not shift
Unlock Deck
Unlock for access to all 101 flashcards in this deck.
Unlock Deck
k this deck
74
Consider the short-run Phillips curve in Canada since the 1960s. Choose the best statement.
A)Canada's inflation/unemployment tradeoff is best shown as a series of shifting short-run Phillips curves that sometimes shift upward and sometimes shift downward.
B)Canada's inflation/unemployment tradeoff is undefined.
C)Canada's short-run Phillips curve is consistently shifting upward.
D)Canada's short-run Phillips curve is consistently shifting downward.
E)Canada's short-run Phillips curve is consistently shifting rightward.
Unlock Deck
Unlock for access to all 101 flashcards in this deck.
Unlock Deck
k this deck
75
The new classical theory argues that the primary factor leading to business cycles is
A)expected fluctuations in aggregate demand.
B)expected fluctuations in short-run aggregate supply.
C)unexpected fluctuations in aggregate demand.
D)unexpected fluctuations in short-run aggregate supply.
E)unexpected fluctuations in long-run aggregate supply.
A)expected fluctuations in aggregate demand.
B)expected fluctuations in short-run aggregate supply.
C)unexpected fluctuations in aggregate demand.
D)unexpected fluctuations in short-run aggregate supply.
E)unexpected fluctuations in long-run aggregate supply.
Unlock Deck
Unlock for access to all 101 flashcards in this deck.
Unlock Deck
k this deck
76
If the natural unemployment rate increases,the long-run Phillips curve ________,the short-run Phillips curve ________,and the expected inflation rate ________.
A)does not shift; does not shift; does not change
B)shifts rightward; shifts rightward; does not change
C)does not shift; shifts rightward; rises
D)shifts rightward; curve does not shift; falls
E)shifts rightward; shifts rightward; falls
A)does not shift; does not shift; does not change
B)shifts rightward; shifts rightward; does not change
C)does not shift; shifts rightward; rises
D)shifts rightward; curve does not shift; falls
E)shifts rightward; shifts rightward; falls
Unlock Deck
Unlock for access to all 101 flashcards in this deck.
Unlock Deck
k this deck
77
Both new Keynesian and new classical cycle theories claim that
A)animal spirits can trigger a business cycle.
B)shifts in the SAS curve are the main impulse for a business cycle.
C)unexpected changes in aggregate demand trigger a business cycle.
D)expected changes in the quantity of money can trigger a business cycle.
E)a change in the price of oil is the major cause of a business cycle.
Unlock Deck
Unlock for access to all 101 flashcards in this deck.
Unlock Deck
k this deck
78
According to ________,the business cycle is the result of aggregate demand growing at a fluctuating rate.
A)the Keynesian cycle theory only
B)only the Keynesian and monetarist cycle theories
C)the Keynesian, monetarist, and real business cycle theories
D)the Keynesian, monetarist, and new classical cycle theories
E)real business cycle theory
A)the Keynesian cycle theory only
B)only the Keynesian and monetarist cycle theories
C)the Keynesian, monetarist, and real business cycle theories
D)the Keynesian, monetarist, and new classical cycle theories
E)real business cycle theory
Unlock Deck
Unlock for access to all 101 flashcards in this deck.
Unlock Deck
k this deck
79
Which of the following are business cycle theories that regard fluctuations in aggregate demand as the factor that creates business cycles?
I. Keynesian cycle theory
II. real business cycle theory
III. monetarist cycle theory
A)I only
B)I and II
C)I and III
D)I, II and III
E)II and III
I. Keynesian cycle theory
II. real business cycle theory
III. monetarist cycle theory
A)I only
B)I and II
C)I and III
D)I, II and III
E)II and III
Unlock Deck
Unlock for access to all 101 flashcards in this deck.
Unlock Deck
k this deck
80
The key difference between new classical cycle theory and new Keynesian cycle theory is that the new classical cycle theory believes that ________ while the new Keynesian cycle theory believes that ________.
A)expected changes in aggregate demand change real GDP; expected changes in aggregate demand do not change real GDP
B)only unexpected changes in aggregate demand change real GDP; only expected changes in aggregate demand change real GDP
C)only unexpected changes in aggregate demand change real GDP; both expected and unexpected changes in aggregate demand change real GDP
D)the short-run aggregate supply curve is horizontal; the short-run aggregate supply curve is vertical.
E)expected and unexpected changes in aggregate demand change real GDP; only changes in labour productivity change aggregate demand
Unlock Deck
Unlock for access to all 101 flashcards in this deck.
Unlock Deck
k this deck
Unlock Deck
Unlock for access to all 101 flashcards in this deck.


