Deck 53: Population Ecology
Full screen (f)
Question
Question
Question
Question
Use the survivorship curves in Figure 53.1 to answer the following questions.
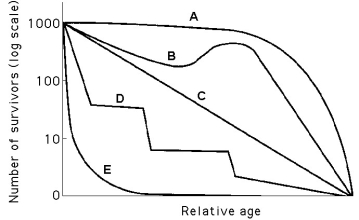
Figure 53.1
Which curve best describes survivorship in humans who live in developed nations?
Figure 53.1
Which curve best describes survivorship in humans who live in developed nations?
Question
Question
Question
Use the survivorship curves in Figure 53.1 to answer the following questions.
Figure 53.1
Which curve best describes survivorship in marine mollusks?
Figure 53.1
Which curve best describes survivorship in marine mollusks?
Question
Question
Question
Question
Question
Use the survivorship curves in Figure 53.1 to answer the following questions.
Figure 53.1
Which curve best describes survivorship in songbirds?
Figure 53.1
Which curve best describes survivorship in songbirds?
Question
Question
Question
Question
Question
Question
Use the survivorship curves in Figure 53.1 to answer the following questions.
Figure 53.1
Which curve best describes survivorship in elephants?
Figure 53.1
Which curve best describes survivorship in elephants?
Question
Use the survivorship curves in Figure 53.1 to answer the following questions.
Figure 53.1
Which curve best describes survivorship in a marine crustacean that molts?
Figure 53.1
Which curve best describes survivorship in a marine crustacean that molts?
Question
Use the survivorship curves in Figure 53.1 to answer the following questions.
Figure 53.1
Which curve best describes survivorship that is independent of age?
Figure 53.1
Which curve best describes survivorship that is independent of age?
Question
Question
Question
Please read the paragraph below and review Figure 53.2 to answer the following questions.
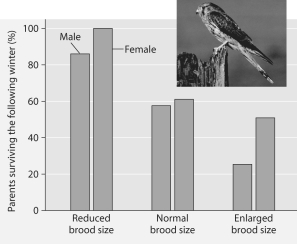
Researchers in the Netherlands studied the effects of parental caregiving in European kestrels over 5 years. The researchers transferred chicks among nests to produce reduced broods (three or four chicks), normal broods (five or six), and enlarged broods (seven or eight). They then measured the percentage of male and female parent birds that survived the following winter. (Both males and females provide care for chicks.)
Brood Size Manipulations in the Kestrel: Effects on Offspring and Parent Survival
Figure 53.2
Which of the following pairs of reproductive strategies is consistent with energetic trade-off and reproductive success?
A)Pioneer species of plants produce many very small, highly airborne seeds, while large elephants that are very good parents produce many offspring.
B)Female rabbits that suffer high predation rates may produce several litters per breeding season, and coconuts produce few fruits, but most survive when they encounter proper growing conditions.
C)Species that have to broadcast to distant habitats tend to produce seeds with heavy protective seed coats, and animals that are caring parents produce fewer offspring with lower infant mortality.
D)Free-living insects lay thousands of eggs and provide no parental care, while flowers take good care of their seeds until they are ready to germinate.
E)Some mammals will not reproduce when environmental resources are low so they can survive until conditions get better, and plants that produce many small seeds are likely found in stable environments.
Question
Question
Question
Question
Question
Question
Question
Please read the paragraph below and review Figure 53.2 to answer the following questions.
Researchers in the Netherlands studied the effects of parental caregiving in European kestrels over 5 years. The researchers transferred chicks among nests to produce reduced broods (three or four chicks), normal broods (five or six), and enlarged broods (seven or eight). They then measured the percentage of male and female parent birds that survived the following winter. (Both males and females provide care for chicks.)
Brood Size Manipulations in the Kestrel: Effects on Offspring and Parent Survival
Figure 53.2
Which of the following is a conclusion that can be drawn from this graph?
A)Female survivability is more negatively affected by larger brood size than is male survivability.
B)Male survivability decreased by 50% between reduced and enlarged brood treatments.
C)Both males and females had increases in daily hunting with the enlarged brood size.
D)There appears to be a negative correlation between brood enlargements and parental survival.
E)Chicks in reduced brood treatment received more food, weight gain, and reduced mortality.
Question
Question
Question
Question
Question
Question
Question
Question
Question
Question
Question
Question
Question
Which of the following graphs illustrates the population growth curve of single bacterium growing in a flask of ideal medium at optimum temperature over a 24-hour period?
A)
B)
C)
D)
E)
A)
B)
C)
D)
E)
Question
Which of the following graphs refer to this equation?
=0.5 N
A)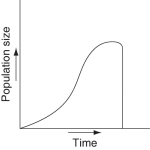
B)
C)
D)
E)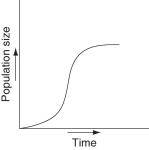
=0.5 N
A)
B)
C)
D)
E)
Question
Question
Which of the following is a likely graphic outcome of a population of deer introduced to an island with an adequate herbivory and without natural predators, parasites, or disease?
A)
B)
C)
D)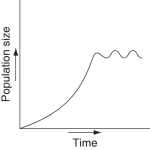
E)
A)
B)
C)
D)
E)
Question
Question
Question
Which of the following graphs illustrates the growth curve of a population of snowshoe hares over several seasons in northern Canada?
A)
B)
C)
D)
E)
A)
B)
C)
D)
E)
Question
Question
Question
Question
Question
Which of the following graphs illustrates the growth curve of a small population of rodents that has grown to reach a static carrying capacity?
A)
B)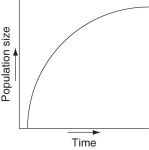
C)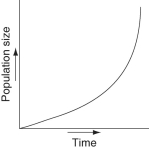
D)
E)
A)
B)
C)
D)
E)
Question
Question
Question
Question
Question
Question
Question
Question
Question
Question
Question
Question
Question
The following questions refer to Figure 53.3, which depicts the age structure of three populations.
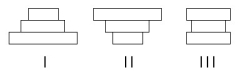
Figure 53.3
Assuming these age-structure diagrams describe human populations, which population is likely to experience zero population growth (ZPG)?
A)I
B)II
C)III
D)I and II
E)II and III
Figure 53.3
Assuming these age-structure diagrams describe human populations, which population is likely to experience zero population growth (ZPG)?
A)I
B)II
C)III
D)I and II
E)II and III
Question
Question
Question
The following questions refer to Figure 53.3, which depicts the age structure of three populations.
Figure 53.3
Which population appears to be stable?
A)I
B)II
C)III
D)I and II
E)II and III
Figure 53.3
Which population appears to be stable?
A)I
B)II
C)III
D)I and II
E)II and III
Question
The following questions refer to Figure 53.3, which depicts the age structure of three populations.
Figure 53.3
Which population is in the process of decreasing?
A)I
B)II
C)III
D)I and II
E)II and III
Figure 53.3
Which population is in the process of decreasing?
A)I
B)II
C)III
D)I and II
E)II and III
Question
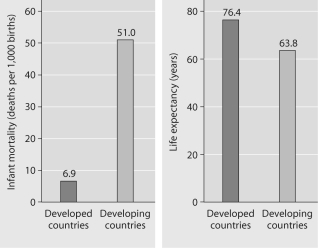 Infant mortality and life expectancy at birth in developed and developing countries. (Data as of 2005.) Figure 53.4
What is a logical conclusion that can be drawn from the graphs above?
A)Developed countries have lower infant mortality rates and lower life expectancy than developing countries.
B)Developed countries have higher infant mortality rates and lower life expectancy than developing countries.
C)Developed countries have lower infant mortality rates and higher life expectancy than developing countries.
D)Developed countries have higher infant mortality rates and higher life expectancy than developing countries.
Question
Question
Question
The following questions refer to Figure 53.3, which depicts the age structure of three populations.
Figure 53.3
Assuming these age-structure diagrams describe human populations, in which population is unemployment likely to be a societal issue in the future?
A)I
B)II
C)III
D)No differences in the magnitude of future unemployment would be expected among these populations.
E)It is not possible to infer anything about future social conditions from age-structure diagrams.
Question
Question
Question
Question
Question

Unlock Deck
Sign up to unlock the cards in this deck!
Unlock Deck
Unlock Deck
1/80
Play
Full screen (f)
Deck 53: Population Ecology
1
You are observing a population of lizards when you notice that the number of adults has increased and is higher than previously observed. One explanation for such an observation would include
A)reduction in death rate.
B)increased immigration.
C)increased emigration.
D)decreased emigration.
E)increased birth rate.
A)reduction in death rate.
B)increased immigration.
C)increased emigration.
D)decreased emigration.
E)increased birth rate.
B
2
Life tables are most useful in determining which of the following?
A)carrying capacity
B)the fate of a cohort of newborn organisms throughout their lives
C)immigration and emigration rates
D)population dispersion patterns
E)reproductive rates
A)carrying capacity
B)the fate of a cohort of newborn organisms throughout their lives
C)immigration and emigration rates
D)population dispersion patterns
E)reproductive rates
B
3
The most common kind of dispersion in nature is
A)clumped.
B)random.
C)uniform.
D)indeterminate.
E)dispersive.
A)clumped.
B)random.
C)uniform.
D)indeterminate.
E)dispersive.
A
4
Use the survivorship curves in Figure 53.1 to answer the following questions.
Figure 53.1
Which curve best describes survivorship in humans who live in developed nations?
Figure 53.1
Which curve best describes survivorship in humans who live in developed nations?
Unlock Deck
Unlock for access to all 80 flashcards in this deck.
Unlock Deck
k this deck
5
Which of the following groups would be most likely to exhibit uniform dispersion?
A)red squirrels, who actively defend territories
B)cattails, which grow primarily at edges of lakes and streams
C)dwarf mistletoes, which parasitize particular species of forest tree
D)moths in a city at night
E)lake trout, which seek out deep water
A)red squirrels, who actively defend territories
B)cattails, which grow primarily at edges of lakes and streams
C)dwarf mistletoes, which parasitize particular species of forest tree
D)moths in a city at night
E)lake trout, which seek out deep water
Unlock Deck
Unlock for access to all 80 flashcards in this deck.
Unlock Deck
k this deck
6
A population is correctly defined as having which of the following characteristics?
I) inhabiting the same general area
II) individuals belonging to the same species
III) possessing a constant and uniform density and dispersion
A)I only
B)III only
C)I and II only
D)II and III only
E)I, II, and III
I) inhabiting the same general area
II) individuals belonging to the same species
III) possessing a constant and uniform density and dispersion
A)I only
B)III only
C)I and II only
D)II and III only
E)I, II, and III
Unlock Deck
Unlock for access to all 80 flashcards in this deck.
Unlock Deck
k this deck
7
Use the survivorship curves in Figure 53.1 to answer the following questions.
Figure 53.1
Which curve best describes survivorship in marine mollusks?
Figure 53.1
Which curve best describes survivorship in marine mollusks?
Unlock Deck
Unlock for access to all 80 flashcards in this deck.
Unlock Deck
k this deck
8
A table listing such items as age, observed number of organisms alive each year, and life expectancy is known as a (an)
A)life table.
B)mortality table.
C)survivorship table.
D)rate table.
E)insurance table.
A)life table.
B)mortality table.
C)survivorship table.
D)rate table.
E)insurance table.
Unlock Deck
Unlock for access to all 80 flashcards in this deck.
Unlock Deck
k this deck
9
To measure the population density of monarch butterflies occupying a particular park, 100 butterflies are captured, marked with a small dot on a wing, and then released. The next day, another 100 butterflies are captured, including the recapture of 20 marked butterflies. One would estimate the population to be
A)200.
B)500.
C)1,000.
D)10,000.
E)900,000.
A)200.
B)500.
C)1,000.
D)10,000.
E)900,000.
Unlock Deck
Unlock for access to all 80 flashcards in this deck.
Unlock Deck
k this deck
10
Uniform spacing patterns in plants such as the creosote bush are most often associated with
A)chance.
B)patterns of high humidity.
C)the random distribution of seeds.
D)competitive interactions among individuals in the population.
E)the concentration of nutrients within the population's range.
A)chance.
B)patterns of high humidity.
C)the random distribution of seeds.
D)competitive interactions among individuals in the population.
E)the concentration of nutrients within the population's range.
Unlock Deck
Unlock for access to all 80 flashcards in this deck.
Unlock Deck
k this deck
11
Which of the following assumptions have to be made regarding the capture-recapture estimate of population size?
I) Marked and unmarked individuals have the same probability of being trapped.
II) The marked individuals have thoroughly mixed with population after being marked.
III) No individuals have entered or left the population by immigration or emigration, and no individuals have been added by birth or eliminated by death during the course of the estimate.
A)I only
B)II only
C)I and II only
D)II and III only
E)I, II, and III
Unlock Deck
Unlock for access to all 80 flashcards in this deck.
Unlock Deck
k this deck
12
Use the survivorship curves in Figure 53.1 to answer the following questions.
Figure 53.1
Which curve best describes survivorship in songbirds?
Figure 53.1
Which curve best describes survivorship in songbirds?
Unlock Deck
Unlock for access to all 80 flashcards in this deck.
Unlock Deck
k this deck
13
Which of the following examples would most accurately measure the density of the population being studied?
A)counting the number of prairie dog burrows per hectare
B)counting the number of times a 1 kilometer transect is intersected by tracks of red squirrels after a snowfall
C)counting the number of coyote droppings per hectare
D)multiplying the number of moss plants counted in 10, 1m2 quadrats by 100 to determine the density per kilometer2.
E)counting the number of zebras from airplane census observations.
Unlock Deck
Unlock for access to all 80 flashcards in this deck.
Unlock Deck
k this deck
14
To measure the population of lake trout in a 250 hectare lake, 200 individuals were netted and marked with a fin clip, and then returned to the lake. The next week, the lake is netted again, and out of the 200 lake trout that are caught, 50 have fin clips. Using the capture-recapture estimate, the lake trout population size could be closest to which of the following?
A)200
B)250
C)400
D)800
E)40,000
A)200
B)250
C)400
D)800
E)40,000
Unlock Deck
Unlock for access to all 80 flashcards in this deck.
Unlock Deck
k this deck
15
An ecologist recorded 12 white-tailed deer, Odocoileus virginianus, per square mile in one woodlot and 20 per square mile on another woodlot. What was the ecologist comparing?
A)density
B)dispersion
C)carrying capacity
D)quadrats
E)range
A)density
B)dispersion
C)carrying capacity
D)quadrats
E)range
Unlock Deck
Unlock for access to all 80 flashcards in this deck.
Unlock Deck
k this deck
16
During the spring, you are studying the mice that live in a field near your home. There are lots of mice in this field, but you realize that you rarely observe any reproductive females. This most likely indicates
A)that there is selective predation on female mice.
B)that female mice die before reproducing.
C)that this habitat is a good place for mice to reproduce.
D)that you are observing immigrant mice.
E)that the breeding season is over
A)that there is selective predation on female mice.
B)that female mice die before reproducing.
C)that this habitat is a good place for mice to reproduce.
D)that you are observing immigrant mice.
E)that the breeding season is over
Unlock Deck
Unlock for access to all 80 flashcards in this deck.
Unlock Deck
k this deck
17
In order to construct a reproductive table for a sexual species, you need to
A)assess sperm viability.
B)keep track of all of the offspring of a cohort.
C)keep track of the females in a cohort.
D)keep track of all of the offspring of the females in a cohort.
E)keep track of the ratio of deaths to births in a cohort.
A)assess sperm viability.
B)keep track of all of the offspring of a cohort.
C)keep track of the females in a cohort.
D)keep track of all of the offspring of the females in a cohort.
E)keep track of the ratio of deaths to births in a cohort.
Unlock Deck
Unlock for access to all 80 flashcards in this deck.
Unlock Deck
k this deck
18
Use the survivorship curves in Figure 53.1 to answer the following questions.
Figure 53.1
Which curve best describes survivorship in elephants?
Figure 53.1
Which curve best describes survivorship in elephants?
Unlock Deck
Unlock for access to all 80 flashcards in this deck.
Unlock Deck
k this deck
19
Use the survivorship curves in Figure 53.1 to answer the following questions.
Figure 53.1
Which curve best describes survivorship in a marine crustacean that molts?
Figure 53.1
Which curve best describes survivorship in a marine crustacean that molts?
Unlock Deck
Unlock for access to all 80 flashcards in this deck.
Unlock Deck
k this deck
20
Use the survivorship curves in Figure 53.1 to answer the following questions.
Figure 53.1
Which curve best describes survivorship that is independent of age?
Figure 53.1
Which curve best describes survivorship that is independent of age?
Unlock Deck
Unlock for access to all 80 flashcards in this deck.
Unlock Deck
k this deck
21
Imagine that you are managing a large ranch. You know from historical accounts that wild sheep used to live there, but they have been extirpated. You decide to reintroduce them. After doing some research to determine what might be an appropriately sized founding population, you do so. You then watch the population increase for several generations, and graph the number of individuals (vertical axis)against the number of generations (horizontal axis). The graph will appear as
A)a diagonal line, getting higher with each generation.
B)an "S," increasing with each generation.
C)an upside-down "U."
D)a "J," increasing with each generation.
E)an "S" that ends with a vertical line.
A)a diagonal line, getting higher with each generation.
B)an "S," increasing with each generation.
C)an upside-down "U."
D)a "J," increasing with each generation.
E)an "S" that ends with a vertical line.
Unlock Deck
Unlock for access to all 80 flashcards in this deck.
Unlock Deck
k this deck
22
As N approaches K for a certain population, which of the following is predicted by the logistic equation?
A)The growth rate will not change.
B)The growth rate will approach zero.
C)The population will show an Allee effect.
D)The population will increase exponentially.
E)The carrying capacity of the environment will increase.
A)The growth rate will not change.
B)The growth rate will approach zero.
C)The population will show an Allee effect.
D)The population will increase exponentially.
E)The carrying capacity of the environment will increase.
Unlock Deck
Unlock for access to all 80 flashcards in this deck.
Unlock Deck
k this deck
23
Please read the paragraph below and review Figure 53.2 to answer the following questions.
Researchers in the Netherlands studied the effects of parental caregiving in European kestrels over 5 years. The researchers transferred chicks among nests to produce reduced broods (three or four chicks), normal broods (five or six), and enlarged broods (seven or eight). They then measured the percentage of male and female parent birds that survived the following winter. (Both males and females provide care for chicks.)
Brood Size Manipulations in the Kestrel: Effects on Offspring and Parent Survival
Figure 53.2
Which of the following pairs of reproductive strategies is consistent with energetic trade-off and reproductive success?
A)Pioneer species of plants produce many very small, highly airborne seeds, while large elephants that are very good parents produce many offspring.
B)Female rabbits that suffer high predation rates may produce several litters per breeding season, and coconuts produce few fruits, but most survive when they encounter proper growing conditions.
C)Species that have to broadcast to distant habitats tend to produce seeds with heavy protective seed coats, and animals that are caring parents produce fewer offspring with lower infant mortality.
D)Free-living insects lay thousands of eggs and provide no parental care, while flowers take good care of their seeds until they are ready to germinate.
E)Some mammals will not reproduce when environmental resources are low so they can survive until conditions get better, and plants that produce many small seeds are likely found in stable environments.
Unlock Deck
Unlock for access to all 80 flashcards in this deck.
Unlock Deck
k this deck
24
A small population of white-footed mice has the same intrinsic rate of increase (r)as a large population. If everything else is equal,
A)the large population will add more individuals per unit time.
B)the small population will add more individuals per unit time.
C)the two populations will add equal numbers of individuals per unit time.
D)the J-shaped growth curves will look identical.
E)the growth trajectories of the two populations will proceed in opposite directions.
Unlock Deck
Unlock for access to all 80 flashcards in this deck.
Unlock Deck
k this deck
25
Natural selection involves energetic trade-offs between
A)choosing how many offspring to produce over the course of a lifetime and how long to live.
B)producing large numbers of gametes when employing internal fertilization versus fewer numbers of gametes when employing external fertilization.
C)the emigration of individuals when they are no longer reproductively capable or committing suicide.
D)increasing the number of individuals produced during each reproductive episode with a corresponding decrease in parental care.
E)high survival rates of offspring and the cost of parental care.
Unlock Deck
Unlock for access to all 80 flashcards in this deck.
Unlock Deck
k this deck
26
Demography is the study of
A)the vital statistics of populations and how they change over time.
B)death and emigration rates of a population at any moment in time.
C)the survival patterns of a population.
D)life expectancy of individuals within a population.
E)reproductive rates of a population during a given year.
A)the vital statistics of populations and how they change over time.
B)death and emigration rates of a population at any moment in time.
C)the survival patterns of a population.
D)life expectancy of individuals within a population.
E)reproductive rates of a population during a given year.
Unlock Deck
Unlock for access to all 80 flashcards in this deck.
Unlock Deck
k this deck
27
Which of the following might be expected in the logistic model of population growth?
A)As N approaches K, b increases.
B)As N approaches K, r increases.
C)As N approaches K, d increases.
D)Both A and B are True.
E)Both B and C are True.
A)As N approaches K, b increases.
B)As N approaches K, r increases.
C)As N approaches K, d increases.
D)Both A and B are True.
E)Both B and C are True.
Unlock Deck
Unlock for access to all 80 flashcards in this deck.
Unlock Deck
k this deck
28
A population of ground squirrels has an annual per capita birth rate of 0.06 and an annual per capita death rate of 0.02. Estimate the number of individuals added to (or lost from)a population of 1,000 individuals in one year.
A)120 individuals added
B)40 individuals added
C)20 individuals added
D)400 individuals added
E)20 individuals lost
A)120 individuals added
B)40 individuals added
C)20 individuals added
D)400 individuals added
E)20 individuals lost
Unlock Deck
Unlock for access to all 80 flashcards in this deck.
Unlock Deck
k this deck
29
Long-term studies of Belding's ground squirrels show that immigrants move nearly 2 km from where they are born and make up 1 to 8% of the males and 0.7 to 6% of the females in other populations. On an evolutionary scale, why is this significant?
A)These immigrants make up for the deaths of individuals keeping the other populations' size stable.
B)Young reproductive males tend to stay in their home population and are not driven out by other territorial males.
C)These immigrants provide a source of genetic diversity for the other populations.
D)Those individuals that emigrate to these new populations are looking for less crowded conditions with more resources.
E)Gradually, the populations of ground squirrels will move from a uniform to a clumped population pattern of dispersion.
Unlock Deck
Unlock for access to all 80 flashcards in this deck.
Unlock Deck
k this deck
30
Please read the paragraph below and review Figure 53.2 to answer the following questions.
Researchers in the Netherlands studied the effects of parental caregiving in European kestrels over 5 years. The researchers transferred chicks among nests to produce reduced broods (three or four chicks), normal broods (five or six), and enlarged broods (seven or eight). They then measured the percentage of male and female parent birds that survived the following winter. (Both males and females provide care for chicks.)
Brood Size Manipulations in the Kestrel: Effects on Offspring and Parent Survival
Figure 53.2
Which of the following is a conclusion that can be drawn from this graph?
A)Female survivability is more negatively affected by larger brood size than is male survivability.
B)Male survivability decreased by 50% between reduced and enlarged brood treatments.
C)Both males and females had increases in daily hunting with the enlarged brood size.
D)There appears to be a negative correlation between brood enlargements and parental survival.
E)Chicks in reduced brood treatment received more food, weight gain, and reduced mortality.
Unlock Deck
Unlock for access to all 80 flashcards in this deck.
Unlock Deck
k this deck
31
Exponential growth of a population is represented by dN/dt =
A)
B)rN
C)rN (K + N)
D)rN
E)rN
A)
B)rN
C)rN (K + N)
D)rN
E)rN
Unlock Deck
Unlock for access to all 80 flashcards in this deck.
Unlock Deck
k this deck
32
Logistic growth of a population is represented by dN/dt =
A)
B)rN
C)rN (K + N)
D)rN
E)rN
A)
B)rN
C)rN (K + N)
D)rN
E)rN
Unlock Deck
Unlock for access to all 80 flashcards in this deck.
Unlock Deck
k this deck
33
In models of sigmoidal (logistic)population growth,
A)population growth rate slows dramatically as N approaches K.
B)new individuals are added to the population most rapidly at the beginning of the population's growth.
C)only density-dependent factors affect the rate of population growth.
D)only density-independent factors affect the rate of population growth.
E)carrying capacity is never reached.
Unlock Deck
Unlock for access to all 80 flashcards in this deck.
Unlock Deck
k this deck
34
The Allee effect is used to describe a population that
A)has become so small that it will have difficulty surviving and reproducing.
B)has become so large it will have difficulty surviving and reproducing.
C)approaches carrying capacity.
D)exceeds carrying capacity.
E)is in crash decline.
A)has become so small that it will have difficulty surviving and reproducing.
B)has become so large it will have difficulty surviving and reproducing.
C)approaches carrying capacity.
D)exceeds carrying capacity.
E)is in crash decline.
Unlock Deck
Unlock for access to all 80 flashcards in this deck.
Unlock Deck
k this deck
35
The three basic variables that make up the life history of an organism are
A)life expectancy, birth rate, and death rate.
B)number of reproductive females in the population, age structure of the population, and life expectancy.
C)age when reproduction begins, how often reproduction occurs, and how many offspring are produced per reproductive episode.
D)how often reproduction occurs, life expectancy of females in the population, and number of offspring per reproductive episode.
E)the number of reproductive females in the population, how often reproduction occurs, and death rate.
Unlock Deck
Unlock for access to all 80 flashcards in this deck.
Unlock Deck
k this deck
36
In the logistic equation dN/dt = rN, , r is a measure of the population's intrinsic rate of increase. It is determined by which of the following?
A)birth rate and death rates
B)dispersion
C)density
D)carrying capacity
E)life history
A)birth rate and death rates
B)dispersion
C)density
D)carrying capacity
E)life history
Unlock Deck
Unlock for access to all 80 flashcards in this deck.
Unlock Deck
k this deck
37
Which of the following is the pattern of spacing for individuals within the boundaries of the population?
A)cohort
B)dispersion
C)Allee effect
D)iteroparous
E)semelparous
A)cohort
B)dispersion
C)Allee effect
D)iteroparous
E)semelparous
Unlock Deck
Unlock for access to all 80 flashcards in this deck.
Unlock Deck
k this deck
38
Natural selection has led to the evolution of diverse natural history strategies, which have in common
A)many offspring per reproductive episode.
B)limitation only by density-independent limiting factors.
C)adaptation to stable environments.
D)maximum lifetime reproductive success.
E)relatively large offspring.
A)many offspring per reproductive episode.
B)limitation only by density-independent limiting factors.
C)adaptation to stable environments.
D)maximum lifetime reproductive success.
E)relatively large offspring.
Unlock Deck
Unlock for access to all 80 flashcards in this deck.
Unlock Deck
k this deck
39
In 2005, the United States had a population of approximately 295,000,000 people. If the birth rate was 13 births for every 1,000 people, approximately how many births occurred in the United States in 2005?
A)3,800
B)38,000
C)380,000
D)3,800,000
E)38,000,000
A)3,800
B)38,000
C)380,000
D)3,800,000
E)38,000,000
Unlock Deck
Unlock for access to all 80 flashcards in this deck.
Unlock Deck
k this deck
40
Often the growth cycle of one population has an effect on the cycle of another. As moose populations increase, wolf populations also increase. Thus, if we are considering the logistic equation for the wolf population, dN/dt = rN ,
Which of the factors accounts for the effect on the moose population?
A)r
B)N
C)rN
D)K
E)dt
Which of the factors accounts for the effect on the moose population?
A)r
B)N
C)rN
D)K
E)dt
Unlock Deck
Unlock for access to all 80 flashcards in this deck.
Unlock Deck
k this deck
41
Which of the following is True?
A)K-selection operates in populations where populations fluctuate well below the carrying capacity.
B)r-selection occurs in populations whose densities are very near the carrying capacity.
C)Different populations of the same species will be consistently r- or K-selected.
D)r- and K-selection are two extremes of a range of life history strategies.
E)r-selection tends to maximize population size, not the rate of increase in population size.
Unlock Deck
Unlock for access to all 80 flashcards in this deck.
Unlock Deck
k this deck
42
In which of the following habitats would you expect to find the largest number of K-selected individuals?
A)a recently abandoned agricultural field in Ohio
B)the sand dune communities of south Lake Michigan
C)the flora and fauna of a coral reef in the Caribbean
D)South Florida after a hurricane
E)a newly emergent volcanic island
A)a recently abandoned agricultural field in Ohio
B)the sand dune communities of south Lake Michigan
C)the flora and fauna of a coral reef in the Caribbean
D)South Florida after a hurricane
E)a newly emergent volcanic island
Unlock Deck
Unlock for access to all 80 flashcards in this deck.
Unlock Deck
k this deck
43
Which of the following graphs illustrates the population growth curve of single bacterium growing in a flask of ideal medium at optimum temperature over a 24-hour period?
A)
B)
C)
D)
E)
A)
B)
C)
D)
E)
Unlock Deck
Unlock for access to all 80 flashcards in this deck.
Unlock Deck
k this deck
44
Which of the following graphs refer to this equation?
=0.5 N
A)
B)
C)
D)
E)
=0.5 N
A)
B)
C)
D)
E)
Unlock Deck
Unlock for access to all 80 flashcards in this deck.
Unlock Deck
k this deck
45
A population of white-footed mice becomes severely overpopulated in a habitat that has been disturbed by human activity. Sometimes intrinsic factors cause the population to increase in mortality and lower reproduction rates in reaction to the stress of overpopulation. Which of the following is an example of intrinsic population control?
A)Owl populations frequent the area more often because of increased hunting success.
B)Females undergo hormonal changes that delay sexual maturation and many individuals suffer depressed immune systems and die due to the stress of overpopulation.
C)Clumped dispersion of the population leads to increased spread of disease and parasites resulting in a population crash.
D)All of the resources (food and shelter)are used up by overpopulation and much of the population dies of exposure and/or starvation.
E)Because the individuals are vulnerable they are more likely to die off if a drought or flood were to occur.
Unlock Deck
Unlock for access to all 80 flashcards in this deck.
Unlock Deck
k this deck
46
Which of the following is a likely graphic outcome of a population of deer introduced to an island with an adequate herbivory and without natural predators, parasites, or disease?
A)
B)
C)
D)
E)
A)
B)
C)
D)
E)
Unlock Deck
Unlock for access to all 80 flashcards in this deck.
Unlock Deck
k this deck
47
Carrying capacity is
A)seldom reached by marine producers and consumers because of the vast resources of the ocean.
B)the maximum population size that a particular environment can support.
C)fixed for most species over most of their range most of the time.
D)determined by density and dispersion data.
E)the term used to describe the stress a population undergoes due to limited resources.
Unlock Deck
Unlock for access to all 80 flashcards in this deck.
Unlock Deck
k this deck
48
Which of the following describes having more than one reproductive episode during a lifetime?
A)cohort
B)dispersion
C)Allee effect
D)iteroparous
E)semelparous
A)cohort
B)dispersion
C)Allee effect
D)iteroparous
E)semelparous
Unlock Deck
Unlock for access to all 80 flashcards in this deck.
Unlock Deck
k this deck
49
Which of the following graphs illustrates the growth curve of a population of snowshoe hares over several seasons in northern Canada?
A)
B)
C)
D)
E)
A)
B)
C)
D)
E)
Unlock Deck
Unlock for access to all 80 flashcards in this deck.
Unlock Deck
k this deck
50
Your friend comes to you with a problem. It seems his shrimp boats aren't catching nearly as much shrimp as they used to. He can't understand why because originally he caught all the shrimp he could handle. Each year he added a new boat, and for a long time each boat caught tons of shrimp. As he added more boats, there came a time when each boat caught somewhat fewer shrimp, and now, each boat is catching a lot less shrimp. Which of the following topics might help your friend understand the source of his problem?
A)density-dependent population regulation and intrinsic characteristics of population growth
B)exponential growth curves and unlimited environmental resources
C)density-independent population regulation and chance occurrence
D)pollution effects of a natural environment and learned shrimp behavior
E)a K-selected population switching to an r-selected population
Unlock Deck
Unlock for access to all 80 flashcards in this deck.
Unlock Deck
k this deck
51
Which of the following can contribute to density-dependent regulation of populations?
A)the removal of toxic waste by decomposers
B)intraspecific competition for nutrients
C)earthquakes
D)floods
E)weather catastrophes
A)the removal of toxic waste by decomposers
B)intraspecific competition for nutrients
C)earthquakes
D)floods
E)weather catastrophes
Unlock Deck
Unlock for access to all 80 flashcards in this deck.
Unlock Deck
k this deck
52
Which of the following statements about the evolution of life histories is correct?
A)Stable environments with limited resources favor r-selected populations.
B)K-selected populations are most often found in environments where density-independent factors are important regulators of population size.
C)Most populations have both r- and K-selected characteristics that vary under different environmental conditions.
D)The reproductive efforts of r-selected populations are directed at producing just a few offspring with good competitive abilities.
E)K-selected populations rarely approach carrying capacity.
Unlock Deck
Unlock for access to all 80 flashcards in this deck.
Unlock Deck
k this deck
53
Which of the following is an incorrect statement about the regulation of populations?
A)The logistic equation reflects the effect of density-dependent factors, which can ultimately stabilize populations around the carrying capacity.
B)Density-independent factors have an increasingly greater effect as a population's density increases.
C)High densities in a population may cause physiological changes that inhibit reproduction.
D)Because of the overlapping nature of population-regulating factors, it is often difficult to precisely determine their cause-and-effect relationships.
E)The occurrence of population cycles in some populations may be the result of crowding or lag times in the response to density-dependent factors.
Unlock Deck
Unlock for access to all 80 flashcards in this deck.
Unlock Deck
k this deck
54
Which of the following graphs illustrates the growth curve of a small population of rodents that has grown to reach a static carrying capacity?
A)
B)
C)
D)
E)
A)
B)
C)
D)
E)
Unlock Deck
Unlock for access to all 80 flashcards in this deck.
Unlock Deck
k this deck
55
Field observation suggests that populations of a particular species of herbivorous mammal undergo cyclic fluctuations in density at three- to five-year intervals. Which of the following represent (a)plausible explanation(s)of these cycles?
A)Periodic crowding affects the endocrine system, resulting in increased aggressiveness.
B)Increases in population density lead to increased rates of predation.
C)Increases in rates of herbivory lead to changes in the nutritive value of plants used as food.
D)Increases in population density lead to more proximal infestations of parasites to host animals.
E)All of the above are plausible explanations of population cycling.
Unlock Deck
Unlock for access to all 80 flashcards in this deck.
Unlock Deck
k this deck
56
Pacific salmon or annual plants illustrate which of the following?
A)cohort
B)dispersion
C)Allee effect
D)iteroparous
E)semelparous
A)cohort
B)dispersion
C)Allee effect
D)iteroparous
E)semelparous
Unlock Deck
Unlock for access to all 80 flashcards in this deck.
Unlock Deck
k this deck
57
The life history traits favored by selection are most likely to vary with
A)fluctuations in K.
B)the shape of the J curve.
C)the maximum size of a population.
D)population density.
E)population dispersion.
A)fluctuations in K.
B)the shape of the J curve.
C)the maximum size of a population.
D)population density.
E)population dispersion.
Unlock Deck
Unlock for access to all 80 flashcards in this deck.
Unlock Deck
k this deck
58
Density-dependent factors are related to which of the following?
A)cohort
B)dispersion
C)Allee effect
D)iteroparous
E)semelparous
A)cohort
B)dispersion
C)Allee effect
D)iteroparous
E)semelparous
Unlock Deck
Unlock for access to all 80 flashcards in this deck.
Unlock Deck
k this deck
59
Which of the following characterizes relatively K-selected populations?
A)offspring with good chances of survival
B)many offspring per reproductive episode
C)small offspring
D)a high intrinsic rate of increase
E)early parental reproduction
A)offspring with good chances of survival
B)many offspring per reproductive episode
C)small offspring
D)a high intrinsic rate of increase
E)early parental reproduction
Unlock Deck
Unlock for access to all 80 flashcards in this deck.
Unlock Deck
k this deck
60
Which of the following is a density-independent factor limiting human population growth?
A)social pressure for birth control
B)earthquakes
C)plagues
D)famines
E)pollution
A)social pressure for birth control
B)earthquakes
C)plagues
D)famines
E)pollution
Unlock Deck
Unlock for access to all 80 flashcards in this deck.
Unlock Deck
k this deck
61
A population's carrying capacity
A)can be accurately calculated using the logistic growth model.
B)generally remains constant over time.
C)increases as the per capita growth rate (r)decreases.
D)may change as environmental conditions change.
E)can never be exceeded.
A)can be accurately calculated using the logistic growth model.
B)generally remains constant over time.
C)increases as the per capita growth rate (r)decreases.
D)may change as environmental conditions change.
E)can never be exceeded.
Unlock Deck
Unlock for access to all 80 flashcards in this deck.
Unlock Deck
k this deck
62
Which of the following statements about human population in industrialized countries is incorrect?
A)Average family size is relatively small.
B)The population has undergone the demographic transition.
C)Life history is r-selected.
D)The survivorship curve is Type I.
E)Age distribution is relatively uniform.
A)Average family size is relatively small.
B)The population has undergone the demographic transition.
C)Life history is r-selected.
D)The survivorship curve is Type I.
E)Age distribution is relatively uniform.
Unlock Deck
Unlock for access to all 80 flashcards in this deck.
Unlock Deck
k this deck
63
To estimate which age cohort in a population of females produces the most female offspring, you need information about the number of offspring produced per capita within that cohort and the number of individuals alive in the cohort. Make this estimate for Belding's ground squirrels by multiplying the number of females alive at the start of the year (column 2 in Table 53.1 from your textbook)by the average number of female offspring produced per female (column 5 in Table 53.2 from your textbook). Draw a bar graph with female age in years on the x-axis (0 -1, 1-2, and so on)and total number of female offspring produced for each age cohort on the y-axis. Which cohort of female Belding's ground squirrels produces the most female young?
Unlock Deck
Unlock for access to all 80 flashcards in this deck.
Unlock Deck
k this deck
64
Why is territoriality an adaptive behavior for songbirds maintaining populations at or near their carrying capacity?
A)Songbirds expend a tremendous amount of energy defending territories so that they spend less time feeding their young and fledgling mortality increases.
B)Only the fittest males defend territories and they attract the fittest females so the best genes are conveyed to the next generation.
C)Songbird males defend territories commensurate with the size from which they can derive adequate resources for themselves, their mate, and their chicks.
D)Many individuals are killed in the ritualistic conflicts that go along with territorial defense.
E)Songbirds make improvements to the territories they inhabit so that they can all enjoy larger clutches and successfully fledged chicks.
Unlock Deck
Unlock for access to all 80 flashcards in this deck.
Unlock Deck
k this deck
65
Population ecologists follow the fate of same-age cohorts to
A)determine a population's carrying capacity.
B)determine if a population is regulated by density-dependent processes.
C)determine the birth rate and death rate of each group in a population.
D)determine the factors that regulate the size of a population.
E)determine if a population's growth is cyclic.
Unlock Deck
Unlock for access to all 80 flashcards in this deck.
Unlock Deck
k this deck
66
Based on current growth rates, Earth's human population in 2010 will be closest to
A)2 million.
B)3 billion.
C)4 billion.
D)7 billion.
E)10 billion.
A)2 million.
B)3 billion.
C)4 billion.
D)7 billion.
E)10 billion.
Unlock Deck
Unlock for access to all 80 flashcards in this deck.
Unlock Deck
k this deck
67
The following questions refer to Figure 53.3, which depicts the age structure of three populations.
Figure 53.3
Assuming these age-structure diagrams describe human populations, which population is likely to experience zero population growth (ZPG)?
A)I
B)II
C)III
D)I and II
E)II and III
Figure 53.3
Assuming these age-structure diagrams describe human populations, which population is likely to experience zero population growth (ZPG)?
A)I
B)II
C)III
D)I and II
E)II and III
Unlock Deck
Unlock for access to all 80 flashcards in this deck.
Unlock Deck
k this deck
68
Which pair of terms most accurately describes life history traits for a stable population of wolves?
A)Semelparous; r-selected
B)Semelparous; K-selected
C)Iteroparous; r-selected
D)Iteroparous; K-selected
E)Iteroparous; N-selected
A)Semelparous; r-selected
B)Semelparous; K-selected
C)Iteroparous; r-selected
D)Iteroparous; K-selected
E)Iteroparous; N-selected
Unlock Deck
Unlock for access to all 80 flashcards in this deck.
Unlock Deck
k this deck
69
According to the logistic growth equation dN/dt = rmaxN(K - N)/K,
A)the number of individuals added per unit time is greatest when N is close to zero.
B)the per capita growth rate (r)increases as N approaches K.
C)population growth is zero when N equals K.
D)the population grows exponentially when K is small.
E)the birth rate (b)approaches zero as N approaches K.
A)the number of individuals added per unit time is greatest when N is close to zero.
B)the per capita growth rate (r)increases as N approaches K.
C)population growth is zero when N equals K.
D)the population grows exponentially when K is small.
E)the birth rate (b)approaches zero as N approaches K.
Unlock Deck
Unlock for access to all 80 flashcards in this deck.
Unlock Deck
k this deck
70
The following questions refer to Figure 53.3, which depicts the age structure of three populations.
Figure 53.3
Which population appears to be stable?
A)I
B)II
C)III
D)I and II
E)II and III
Figure 53.3
Which population appears to be stable?
A)I
B)II
C)III
D)I and II
E)II and III
Unlock Deck
Unlock for access to all 80 flashcards in this deck.
Unlock Deck
k this deck
71
The following questions refer to Figure 53.3, which depicts the age structure of three populations.
Figure 53.3
Which population is in the process of decreasing?
A)I
B)II
C)III
D)I and II
E)II and III
Figure 53.3
Which population is in the process of decreasing?
A)I
B)II
C)III
D)I and II
E)II and III
Unlock Deck
Unlock for access to all 80 flashcards in this deck.
Unlock Deck
k this deck
72
Infant mortality and life expectancy at birth in developed and developing countries. (Data as of 2005.) Figure 53.4What is a logical conclusion that can be drawn from the graphs above?
A)Developed countries have lower infant mortality rates and lower life expectancy than developing countries.
B)Developed countries have higher infant mortality rates and lower life expectancy than developing countries.
C)Developed countries have lower infant mortality rates and higher life expectancy than developing countries.
D)Developed countries have higher infant mortality rates and higher life expectancy than developing countries.
Unlock Deck
Unlock for access to all 80 flashcards in this deck.
Unlock Deck
k this deck
73
During exponential growth, a population always
A)grows by thousands of individuals.
B)grows at its maximum per capita rate.
C)quickly reaches its carrying capacity.
D)cycles through time.
E)loses some individuals to emigration.
A)grows by thousands of individuals.
B)grows at its maximum per capita rate.
C)quickly reaches its carrying capacity.
D)cycles through time.
E)loses some individuals to emigration.
Unlock Deck
Unlock for access to all 80 flashcards in this deck.
Unlock Deck
k this deck
74
The observation that members of a population are uniformly distributed suggests that
A)the size of the area occupied by the population is increasing.
B)resources are distributed unevenly.
C)the members of the population are competing for access to a resource.
D)the members of the population are neither attracted to nor repelled by one another.
E)the density of the population is low.
Unlock Deck
Unlock for access to all 80 flashcards in this deck.
Unlock Deck
k this deck
75
The following questions refer to Figure 53.3, which depicts the age structure of three populations.
Figure 53.3
Assuming these age-structure diagrams describe human populations, in which population is unemployment likely to be a societal issue in the future?
A)I
B)II
C)III
D)No differences in the magnitude of future unemployment would be expected among these populations.
E)It is not possible to infer anything about future social conditions from age-structure diagrams.
Unlock Deck
Unlock for access to all 80 flashcards in this deck.
Unlock Deck
k this deck
76
Scientific study of the population cycles of the snowshoe hare and its predator, the lynx, has revealed that
A)the prey population is controlled by predators alone.
B)hares and lynx are so mutually dependent that each species cannot survive without the other.
C)multiple biotic and abiotic factors contribute to the cycling of hare and lynx populations.
D)both hare and lynx populations are regulated mainly by abiotic factors.
E)the hare population is r-selected and the lynx population is K-selected.
Unlock Deck
Unlock for access to all 80 flashcards in this deck.
Unlock Deck
k this deck
77
An ecological footprint is a construct that is useful
A)for a person living in a developed nation to consider to make better choices when using global food and energy resources.
B)for a person living in a developing country to see how much of the world's resources are left for him/her.
C)in converting human foods' meat biomass to plant biomass.
D)in making predictions about the global carrying capacity of humans.
E)in determining which nations produce the least amount of carbon dioxide from the burning of fossil fuels.
Unlock Deck
Unlock for access to all 80 flashcards in this deck.
Unlock Deck
k this deck
78
A recent study of ecological footprints (described in the text)concluded that
A)Earth's carrying capacity for humans is about 10 billion.
B)Earth's carrying capacity would increase if per capita meat consumption increased.
C)current demand by industrialized countries for resources is much smaller than the ecological footprint of those countries.
D)the ecological footprint of the United States is large because per capita resource use is high.
E)it is not possible for technological improvements to increase Earth's carrying capacity for humans.
Unlock Deck
Unlock for access to all 80 flashcards in this deck.
Unlock Deck
k this deck
79
Consider several human populations of equal size and net reproductive rate, but different in age structure. The population that is likely to grow the most during the next 30 years is the one with the greatest fraction of people in which age range?
A)50 to 60 years
B)40 to 50 years
C)30 to 40 years
D)20 to 30 years
E)10 to 20 years
A)50 to 60 years
B)40 to 50 years
C)30 to 40 years
D)20 to 30 years
E)10 to 20 years
Unlock Deck
Unlock for access to all 80 flashcards in this deck.
Unlock Deck
k this deck
80
Most ecologists believe that the average global carrying capacity for the human population is between
A)5 and 6 billion.
B)6 and 8 billion.
C)10 and 15 billion.
D)15 and 20 billion.
E)20 and 25 billion.
A)5 and 6 billion.
B)6 and 8 billion.
C)10 and 15 billion.
D)15 and 20 billion.
E)20 and 25 billion.
Unlock Deck
Unlock for access to all 80 flashcards in this deck.
Unlock Deck
k this deck
Unlock Deck
Unlock for access to all 80 flashcards in this deck.


