Deck 2: Trade-Offs, comparative Advantage, and the Market System
Full screen (f)
Question
Figure 2-1
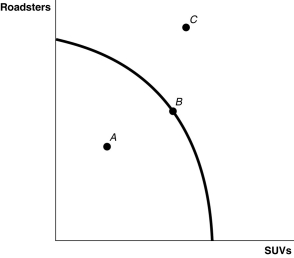
Refer to Figure 2-1.Point B is
A) technically efficient.
B) unattainable with current resources.
C) inefficient in that not all resources are being used.
D) the equilibrium output combination.
Refer to Figure 2-1.Point B is
A) technically efficient.
B) unattainable with current resources.
C) inefficient in that not all resources are being used.
D) the equilibrium output combination.
Question
Question
Question
Figure 2-2.
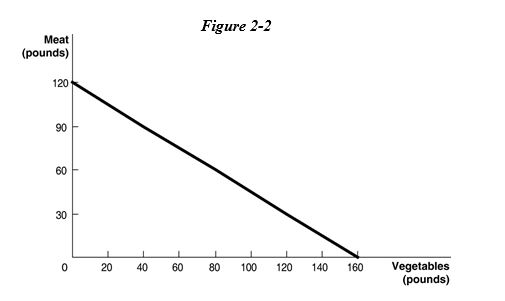
Refer to Figure 2-2.Suppose Mendonca is currently producing 60 pounds of vegetables per period.How much meat is it also producing,assuming that resources are fully utilized?
A) 45 pounds of meat
B) 75 pounds of meat
C) 80 pounds of meat
D) 100 pounds of meat
Refer to Figure 2-2.Suppose Mendonca is currently producing 60 pounds of vegetables per period.How much meat is it also producing,assuming that resources are fully utilized?
A) 45 pounds of meat
B) 75 pounds of meat
C) 80 pounds of meat
D) 100 pounds of meat
Question
Question
Figure 2-2.
Refer to Figure 2-2.The linear production possibilities frontier in the figure indicates that
A) Mendonca has a comparative advantage in the production of vegetables.
B) Mendonca has a comparative disadvantage in the production of meat.
C) the tradeoff between meat and vegetables is constant.
D) it is progressively more expensive to produce meat.
Question
Question
Question
Question
Figure 2-2.
Refer to Figure 2-2.What is the opportunity cost of one pound of vegetables?
A)
B)
C)
D)
Refer to Figure 2-2.What is the opportunity cost of one pound of vegetables?
A)
B)
C)
D)
Question
Figure 2-1
Refer to Figure 2-1.Point C is
A) technically efficient.
B) unattainable with current resources.
C) inefficient in that not all resources are being used.
D) is the equilibrium output combination.
Refer to Figure 2-1.Point C is
A) technically efficient.
B) unattainable with current resources.
C) inefficient in that not all resources are being used.
D) is the equilibrium output combination.
Question
Figure 2-1
Refer to Figure 2-1.Point A is
A) technically efficient.
B) unattainable with current resources.
C) inefficient in that not all resources are being used.
D) the equilibrium output combination.
Refer to Figure 2-1.Point A is
A) technically efficient.
B) unattainable with current resources.
C) inefficient in that not all resources are being used.
D) the equilibrium output combination.
Question
Question
Question
Question
Question
Question
Question
Question
Figure 2-2.
Refer to Figure 2-2.What is the opportunity cost of one pound of meat?
A)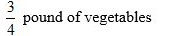
B)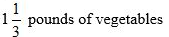
C)
D)
Refer to Figure 2-2.What is the opportunity cost of one pound of meat?
A)
B)
C)
D)
Question
Figure 2-4
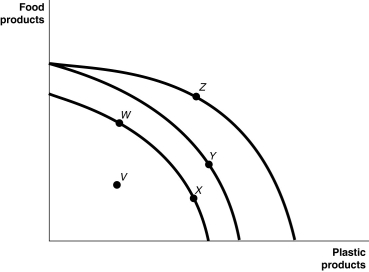
Figure 2-4 shows various points on three different production possibilities frontiers for a nation.
Refer to Figure 2-4.Consider the following events:
A.a reduction in the patent protection period to no more than 2 years
B.a war that destroys a substantial portion of a nation's capital stock
C.the lack of secure and enforceable property rights system
Which of the events listed above could cause a movement from W to V?
A) a only
B) a and b only
C) a and c only
D) b and c only
E) a, b, and c
Question
Question
Table 2-1
Production choices for Tomaso's Trattoria
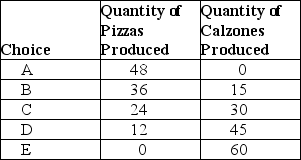
Refer to Table 2-1.Assume Tomaso's Trattoria only produces pizzas and calzones.A combination of 24 pizzas and 30 calzones would appear
A) along Tomaso's production possibilities frontier.
B) inside Tomaso's production possibilities frontier.
C) outside Tomaso's production possibilities frontier.
D) at the horizontal intercept of Tomaso's production possibilities frontier.
Production choices for Tomaso's Trattoria
Refer to Table 2-1.Assume Tomaso's Trattoria only produces pizzas and calzones.A combination of 24 pizzas and 30 calzones would appear
A) along Tomaso's production possibilities frontier.
B) inside Tomaso's production possibilities frontier.
C) outside Tomaso's production possibilities frontier.
D) at the horizontal intercept of Tomaso's production possibilities frontier.
Question
Question
Question
Question
Figure 2-4
Figure 2-4 shows various points on three different production possibilities frontiers for a nation.
Refer to Figure 2-4.Consider the following events:
A.a decrease in the unemployment rate
B.general technological advancement
C.an increase in consumer wealth
Which of the events listed above could cause a movement from V to W ?
A) a only
B) a and b only
C) b and c only
D) a, b, and c
Question
Question
Figure 2-3
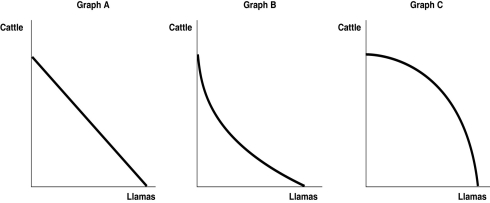
Refer to Figure 2-3.Sergio Vignetto raises cattle and llamas on his land.A portion of his land is more suitable for raising cattle,and the other portion is better suited for raising llamas.Which of the graphs in Figure 2-3 represent his production possibilities frontier?
A) Graph A
B) Graph B
C) Graph C
D) either Graph A or Graph C
E) either Graph B or Graph C
Question
Question
Table 2-1
Production choices for Tomaso's Trattoria
Refer to Table 2-1.Assume Tomaso's Trattoria only produces pizzas and calzones.Tomaso faces ________ opportunity costs in the production of pizzas and calzones.
A) increasing
B) decreasing
C) constant
D) negative
Production choices for Tomaso's Trattoria
Refer to Table 2-1.Assume Tomaso's Trattoria only produces pizzas and calzones.Tomaso faces ________ opportunity costs in the production of pizzas and calzones.
A) increasing
B) decreasing
C) constant
D) negative
Question
Figure 2-4
Figure 2-4 shows various points on three different production possibilities frontiers for a nation.
Refer to Figure 2-4.Consider the following events:
A.an increase in the unemployment rate
B.a decrease in a nation's money supply
C.a war that kills a significant portion of a nation's population
Which of the events listed above could cause a movement from Y to W ?
A) a, b and c
B) a and b only
C) a and c only
D) a only
E) c only
Question
Question
Table 2-1
Production choices for Tomaso's Trattoria
Refer to Table 2-1.Assume Tomaso's Trattoria only produces pizzas and calzones.A combination of 36 pizzas and 30 calzones would appear
A) along Tomaso's production possibilities frontier.
B) inside Tomaso's production possibilities frontier.
C) outside Tomaso's production possibilities frontier.
D) at the horizontal intercept of Tomaso's production possibilities frontier.
Question
Figure 2-4
Figure 2-4 shows various points on three different production possibilities frontiers for a nation.
Refer to Figure 2-4.Consider the following movements:
A.from point V to point W
B.from point W to point Y
C.from point Y to point Z
Which of the movements listed above represents economic growth?
A) a, b, and c
B) b and c only
C) a only
D) b only
Question
Figure 2-4
Figure 2-4 shows various points on three different production possibilities frontiers for a nation.
Refer to Figure 2-4.A movement from X to Y
A) could be due to a change in consumers' tastes and preferences.
B) could occur because of an influx of immigrant labor.
C) is the result of advancements in food production technology only, with no change in the technology for plastic production.
D) is the result of advancements in plastic production technology only, with no change in food production technology.
Question
Figure 2-3
Refer to Figure 2-3.Sergio Vignetto raises cattle and llamas on his land.His land is equally suitable for raising either animal.Which of the graphs in Figure 2-3 represent his production possibilities frontier?
A) Graph A
B) Graph B
C) Graph C
D) either Graph A or Graph C
E) either Graph B or Graph C
Question
Question
Figure 2-4
Figure 2-4 shows various points on three different production possibilities frontiers for a nation.
Refer to Figure 2-4.A movement from Y to Z
A) represents an increase in the demand for plastic products.
B) could occur because of general technological advancements.
C) is the result of advancements in food production technology.
D) is the result of advancements in plastic production technology.
Question
Table 2-1
Production choices for Tomaso's Trattoria
Refer to Table 2-1.Assume Tomaso's Trattoria only produces pizzas and calzones.A combination of 24 pizzas and 15 calzones would appear
A) along Tomaso's production possibilities frontier.
B) inside Tomaso's production possibilities frontier.
C) outside Tomaso's production possibilities frontier.
D) at the horizontal intercept of Tomaso's production possibilities frontier.
Question
Question
Question
Figure 2-6
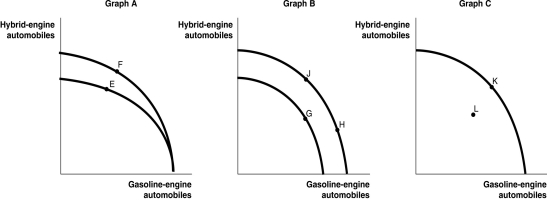
General Motors recently approved for production the Cadillac Converj, an electric car based on its Chevy Volt. The Converj will feature a "Generation 1.5 Voltec" powertrain, with a hybrid engine that runs on a combination of electricity and gasoline. Assume GM chooses to produce both hybrid-engine vehicles and gasoline-engine vehicles for its Cadillac brand. Figure 2-6 shows changes to its production possibilities frontier in response to new developments and different strategic production decisions.
Refer to Figure 2-6.In response to changing consumer demands,GM has cut back on the production of hybrids and increased its production of gasoline-powered vehicles.This strategy is best represented by the
A) movement from F to E in Graph A.
B) movement from G to J in Graph B.
C) movement from L to K in Graph C.
D) movement from J to H in Graph B.
Question
Figure 2-6
General Motors recently approved for production the Cadillac Converj, an electric car based on its Chevy Volt. The Converj will feature a "Generation 1.5 Voltec" powertrain, with a hybrid engine that runs on a combination of electricity and gasoline. Assume GM chooses to produce both hybrid-engine vehicles and gasoline-engine vehicles for its Cadillac brand. Figure 2-6 shows changes to its production possibilities frontier in response to new developments and different strategic production decisions.
Refer to Figure 2-6.Assume that in 2011,GM was able to reopen one of its factories after an extensive remodelling which now allows for the production of both types of vehicles.This is best represented by the
A) movement from E to F in Graph A.
B) movement from H to J in Graph B.
C) movement from L to K in Graph C.
D) movement from J to G in Graph B.
Question
Figure 2-5
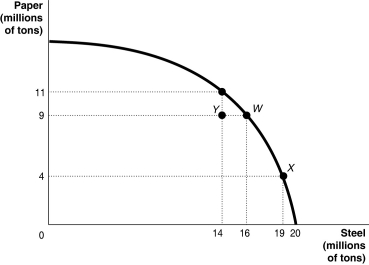
Refer to Figure 2-5.If the economy is currently producing at point Y,what is the opportunity cost of moving to point W?
A) 2 million tons of steel
B) zero
C) 9 million tons of paper
D) 16 million tons of paper
Refer to Figure 2-5.If the economy is currently producing at point Y,what is the opportunity cost of moving to point W?
A) 2 million tons of steel
B) zero
C) 9 million tons of paper
D) 16 million tons of paper
Question
Question
Question
Question
Question
Figure 2-5
Refer to Figure 2-5.If the economy is currently producing at point W,what is the opportunity cost of moving to point X?
A) 3 million tons of steel
B) 19 million tons of steel
C) 5 million tons of paper
D) 9 million tons of paper
Refer to Figure 2-5.If the economy is currently producing at point W,what is the opportunity cost of moving to point X?
A) 3 million tons of steel
B) 19 million tons of steel
C) 5 million tons of paper
D) 9 million tons of paper
Question
Figure 2-6
General Motors recently approved for production the Cadillac Converj, an electric car based on its Chevy Volt. The Converj will feature a "Generation 1.5 Voltec" powertrain, with a hybrid engine that runs on a combination of electricity and gasoline. Assume GM chooses to produce both hybrid-engine vehicles and gasoline-engine vehicles for its Cadillac brand. Figure 2-6 shows changes to its production possibilities frontier in response to new developments and different strategic production decisions.
Refer to Figure 2-6.Assume a technological advancement greatly reduces the cost to produce hybrid-engine vehicles.This is best represented by the
A) movement from E to F in Graph A.
B) movement from G to H in Graph B.
C) movement from K to L in Graph C.
D) movement from H to J in Graph B.
Question
Question
Question
Question
Question
Question
Question
Question
Question
Question
Table 2-3
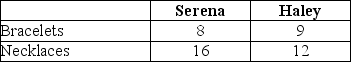
Table 2-3 shows the output per week of two jewelers, Serena and Haley. They can either devote their time to making bracelets or making necklaces.
Refer to Table 2-3.Which of the following statements is true?
A) Haley has a comparative advantage in making both products.
B) Serena has a comparative advantage in making both products.
C) Haley has a comparative advantage in making bracelets and Serena in making necklaces.
D) Haley has a comparative advantage in making necklaces and Serena in making bracelets.
Question
Table 2-2
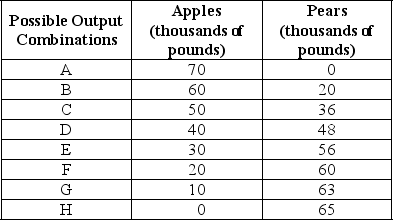
Refer to Table 2-2.The Fruit Farm produces only apples and pears.The table above shows the maximum possible output combinations of the two fruits using all resources and currently available technology.
a.Graph The Fruit Farm's production possibilities frontier.Put apples on the horizontal axis and pears on the vertical axis.Be sure to identify the output combination points on your diagram.
b.Suppose The Fruit Farm is currently producing at point D.What is the opportunity cost of producing an additional 8,000 pounds of pears?
c.Suppose The Fruit Farm is currently producing at point D.What happens to the opportunity cost of producing more and more pears? Does it increase,decrease or remain constant? Explain your answer.
d.Suppose The Fruit Farm is currently producing at point G.What happens to the opportunity cost of producing more and more apples? Does it increase,decrease or remain constant? Explain your answer.
e.Suppose The Fruit Farm is plagued by the apple maggot infestation which destroys apple trees but not pears.Show in a graph what happens to its PPF.
Question
Table 2-3
Table 2-3 shows the output per week of two jewelers, Serena and Haley. They can either devote their time to making bracelets or making necklaces.
Refer to Table 2-3.What is Serena's opportunity cost of making a necklace?
A) 2 necklaces
B) 1/2 of a bracelet
C) 1/2 of a necklace
D) 3/4 of a bracelet
Table 2-3 shows the output per week of two jewelers, Serena and Haley. They can either devote their time to making bracelets or making necklaces.
Refer to Table 2-3.What is Serena's opportunity cost of making a necklace?
A) 2 necklaces
B) 1/2 of a bracelet
C) 1/2 of a necklace
D) 3/4 of a bracelet
Question
Figure 2-7
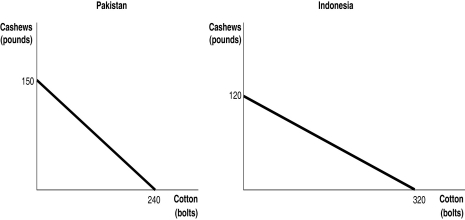
Figure 2-7 shows the production possibilities frontiers for Pakistan and Indonesia. Each country produces two goods, cotton and cashews.
Refer to Figure 2-7.What is the opportunity cost of producing 1 pound of cashews in Indonesia?
A) 3/8 of a bolt of cotton
B) 5/8 of a bolt of cotton
C) 2 2/3 bolts of cotton
D) 320 bolts of cotton
Question
Question
Figure 2-7
Figure 2-7 shows the production possibilities frontiers for Pakistan and Indonesia. Each country produces two goods, cotton and cashews.
Refer to Figure 2-7.What is the opportunity cost of producing 1 bolt of cotton in Pakistan?
A) 3/8 of a pound of cashews
B) 5/8 of a pound of cashews
C) 1 3/5 pounds of cashews
D) 150 pounds of cashews
Question
Question
Table 2-3
Table 2-3 shows the output per week of two jewelers, Serena and Haley. They can either devote their time to making bracelets or making necklaces.
Refer to Table 2-3.What is Haley's opportunity cost of making a bracelet?
A) 3/4 of a bracelet
B) 3 bracelets
C) 1 1/3 necklaces
D) 2 necklaces
Table 2-3 shows the output per week of two jewelers, Serena and Haley. They can either devote their time to making bracelets or making necklaces.
Refer to Table 2-3.What is Haley's opportunity cost of making a bracelet?
A) 3/4 of a bracelet
B) 3 bracelets
C) 1 1/3 necklaces
D) 2 necklaces
Question
Question
Question
Figure 2-7
Figure 2-7 shows the production possibilities frontiers for Pakistan and Indonesia. Each country produces two goods, cotton and cashews.
Refer to Figure 2-7.Which country has a comparative advantage in the production of cotton?
A) Indonesia
B) They have equal productive abilities.
C) Pakistan
D) neither country
Question
Question
Figure 2-7
Figure 2-7 shows the production possibilities frontiers for Pakistan and Indonesia. Each country produces two goods, cotton and cashews.
Refer to Figure 2-7.What is the opportunity cost of producing 1 pound of cashews in Pakistan?
A) 3/8 of a bolt of cotton
B) 5/8 of a bolt of cotton
C) 1 3/5 bolts of cotton
D) 240 bolts of cotton
Question
Figure 2-7
Figure 2-7 shows the production possibilities frontiers for Pakistan and Indonesia. Each country produces two goods, cotton and cashews.
Refer to Figure 2-7.What is the opportunity cost of producing 1 bolt of cotton in Indonesia?
A) 3/8 of a pound of cashews
B) 5/8 of a pound of cashews
C) 2 2/3 pounds of cashews
D) 120 pounds of cashews
Question
Question
Question
Table 2-3
Table 2-3 shows the output per week of two jewelers, Serena and Haley. They can either devote their time to making bracelets or making necklaces.
Refer to Table 2-3.What is Haley's opportunity cost of making a necklace?
A) 3/4 of a bracelet
B) 3 bracelets
C) 1 1/3 necklaces
D) 2 necklaces
Table 2-3 shows the output per week of two jewelers, Serena and Haley. They can either devote their time to making bracelets or making necklaces.
Refer to Table 2-3.What is Haley's opportunity cost of making a necklace?
A) 3/4 of a bracelet
B) 3 bracelets
C) 1 1/3 necklaces
D) 2 necklaces
Question
Question
Table 2-3
Table 2-3 shows the output per week of two jewelers, Serena and Haley. They can either devote their time to making bracelets or making necklaces.
Refer to Table 2-3.Which of the following statements is true?
A) Haley has an absolute advantage in making both products.
B) Serena has an absolute advantage in making both products.
C) Haley has an absolute advantage in making bracelets and Serena in making necklaces.
D) Haley has an absolute advantage in making necklaces and Serena in making bracelets.
Question
Table 2-3
Table 2-3 shows the output per week of two jewelers, Serena and Haley. They can either devote their time to making bracelets or making necklaces.
Refer to Table 2-3.What is Serena's opportunity cost of making a bracelet?
A) 2 necklaces
B) 1/2 of a bracelet
C) 1/2 of a necklace
D) 3/4 of a bracelet
Table 2-3 shows the output per week of two jewelers, Serena and Haley. They can either devote their time to making bracelets or making necklaces.
Refer to Table 2-3.What is Serena's opportunity cost of making a bracelet?
A) 2 necklaces
B) 1/2 of a bracelet
C) 1/2 of a necklace
D) 3/4 of a bracelet

Unlock Deck
Sign up to unlock the cards in this deck!
Unlock Deck
Unlock Deck
1/152
Play
Full screen (f)
Deck 2: Trade-Offs, comparative Advantage, and the Market System
1
Figure 2-1
Refer to Figure 2-1.Point B is
A) technically efficient.
B) unattainable with current resources.
C) inefficient in that not all resources are being used.
D) the equilibrium output combination.
Refer to Figure 2-1.Point B is
A) technically efficient.
B) unattainable with current resources.
C) inefficient in that not all resources are being used.
D) the equilibrium output combination.
technically efficient.
2
The principle of opportunity cost is that
A) in a market economy, taking advantage of profitable opportunities involves some money cost.
B) the economic cost of using a factor of production is the alternative use of that factor that is given up.
C) taking advantage of investment opportunities involves costs.
D) the cost of production varies depending on the opportunity for technological application.
the economic cost of using a factor of production is the alternative use of that factor that is given up.
3
BMW recently decided to build a manufacturing plant in Shenyang,China.At this plant,BMW is able to take advantage of paying lower wages to its Chinese workers than it pays its German workers,but it also sacrifices the high levels of technical training possessed by its German workers.In deciding to open the Shenyang plant,BMW
A) faced no trade-offs because employing lower-wage workers increased efficiency.
B) faced a trade-off between higher cost and lower precision.
C) adopted a negative technological change because it replaced high-skilled workers with low-skilled workers.
D) eroded some of its competitiveness in the luxury car market because of its decreased cost of production.
faced a trade-off between higher cost and lower precision.
4
Figure 2-2.
Refer to Figure 2-2.Suppose Mendonca is currently producing 60 pounds of vegetables per period.How much meat is it also producing,assuming that resources are fully utilized?
A) 45 pounds of meat
B) 75 pounds of meat
C) 80 pounds of meat
D) 100 pounds of meat
Refer to Figure 2-2.Suppose Mendonca is currently producing 60 pounds of vegetables per period.How much meat is it also producing,assuming that resources are fully utilized?
A) 45 pounds of meat
B) 75 pounds of meat
C) 80 pounds of meat
D) 100 pounds of meat
Unlock Deck
Unlock for access to all 152 flashcards in this deck.
Unlock Deck
k this deck
5
The production possibilities frontier shows the ________ combinations of two products that may be produced in a particular time period with available resources.
A) minimum attainable
B) maximum attainable
C) only
D) equitable
A) minimum attainable
B) maximum attainable
C) only
D) equitable
Unlock Deck
Unlock for access to all 152 flashcards in this deck.
Unlock Deck
k this deck
6
Figure 2-2.
Refer to Figure 2-2.The linear production possibilities frontier in the figure indicates that
A) Mendonca has a comparative advantage in the production of vegetables.
B) Mendonca has a comparative disadvantage in the production of meat.
C) the tradeoff between meat and vegetables is constant.
D) it is progressively more expensive to produce meat.
Unlock Deck
Unlock for access to all 152 flashcards in this deck.
Unlock Deck
k this deck
7
In a production possibilities frontier model,a point ________ the frontier is productively inefficient.
A) along
B) inside
C) outside
D) at either intercept of
A) along
B) inside
C) outside
D) at either intercept of
Unlock Deck
Unlock for access to all 152 flashcards in this deck.
Unlock Deck
k this deck
8
The production possibilities frontier model assumes which of the following?
A) Labor, capital, land and natural resources are unlimited in quantity.
B) The economy produces only two products.
C) Any level of the two products that the economy produces is currently possible.
D) The level of technology is variable.
A) Labor, capital, land and natural resources are unlimited in quantity.
B) The economy produces only two products.
C) Any level of the two products that the economy produces is currently possible.
D) The level of technology is variable.
Unlock Deck
Unlock for access to all 152 flashcards in this deck.
Unlock Deck
k this deck
9
The points outside the production possibilities frontier are
A) efficient.
B) attainable.
C) inefficient.
D) unattainable.
A) efficient.
B) attainable.
C) inefficient.
D) unattainable.
Unlock Deck
Unlock for access to all 152 flashcards in this deck.
Unlock Deck
k this deck
10
Figure 2-2.
Refer to Figure 2-2.What is the opportunity cost of one pound of vegetables?
A)
B)
C)
D)
Refer to Figure 2-2.What is the opportunity cost of one pound of vegetables?
A)
B)
C)
D)
Unlock Deck
Unlock for access to all 152 flashcards in this deck.
Unlock Deck
k this deck
11
Figure 2-1
Refer to Figure 2-1.Point C is
A) technically efficient.
B) unattainable with current resources.
C) inefficient in that not all resources are being used.
D) is the equilibrium output combination.
Refer to Figure 2-1.Point C is
A) technically efficient.
B) unattainable with current resources.
C) inefficient in that not all resources are being used.
D) is the equilibrium output combination.
Unlock Deck
Unlock for access to all 152 flashcards in this deck.
Unlock Deck
k this deck
12
Figure 2-1
Refer to Figure 2-1.Point A is
A) technically efficient.
B) unattainable with current resources.
C) inefficient in that not all resources are being used.
D) the equilibrium output combination.
Refer to Figure 2-1.Point A is
A) technically efficient.
B) unattainable with current resources.
C) inefficient in that not all resources are being used.
D) the equilibrium output combination.
Unlock Deck
Unlock for access to all 152 flashcards in this deck.
Unlock Deck
k this deck
13
If the production possibilities frontier is ________,then opportunity costs are constant as more of one good is produced.
A) bowed out
B) bowed in
C) non-linear
D) linear
A) bowed out
B) bowed in
C) non-linear
D) linear
Unlock Deck
Unlock for access to all 152 flashcards in this deck.
Unlock Deck
k this deck
14
The attainable production points on a production possibility curve are
A) the horizontal and vertical intercepts.
B) the points along the production possibilities frontier.
C) the points outside the area enclosed by the production possibilities frontier.
D) the points along and inside the production possibility frontier.
A) the horizontal and vertical intercepts.
B) the points along the production possibilities frontier.
C) the points outside the area enclosed by the production possibilities frontier.
D) the points along and inside the production possibility frontier.
Unlock Deck
Unlock for access to all 152 flashcards in this deck.
Unlock Deck
k this deck
15
Scarcity
A) stems from the incompatibility between limited resources and unlimited wants.
B) can be overcome by discovering new resources.
C) can be eliminated by rationing products.
D) is a bigger problem in market economies than in socialist economies.
A) stems from the incompatibility between limited resources and unlimited wants.
B) can be overcome by discovering new resources.
C) can be eliminated by rationing products.
D) is a bigger problem in market economies than in socialist economies.
Unlock Deck
Unlock for access to all 152 flashcards in this deck.
Unlock Deck
k this deck
16
A production possibilities frontier with a bowed outward shape indicates
A) the possibility of inefficient production.
B) constant opportunity costs as more and more of one good is produced.
C) increasing opportunity costs as more and more of one good is produced.
D) decreasing opportunity costs as more and more of one good is produced.
A) the possibility of inefficient production.
B) constant opportunity costs as more and more of one good is produced.
C) increasing opportunity costs as more and more of one good is produced.
D) decreasing opportunity costs as more and more of one good is produced.
Unlock Deck
Unlock for access to all 152 flashcards in this deck.
Unlock Deck
k this deck
17
Bella can produce either a combination of 60 silk roses and 80 silk leaves or a combination of 70 silk roses and 55 silk leaves.If she now produces 60 silk roses and 80 silk leaves,what is the opportunity cost of producing an additional 10 silk roses?
A) 2.5 silk leaves
B) 10 silk leaves
C) 25 silk leaves
D) 55 silk leaves
A) 2.5 silk leaves
B) 10 silk leaves
C) 25 silk leaves
D) 55 silk leaves
Unlock Deck
Unlock for access to all 152 flashcards in this deck.
Unlock Deck
k this deck
18
Increasing opportunity cost is represented by a ________ production possibilities frontier.
A) linear
B) bowed in
C) bowed out
D) vertical
A) linear
B) bowed in
C) bowed out
D) vertical
Unlock Deck
Unlock for access to all 152 flashcards in this deck.
Unlock Deck
k this deck
19
The production possibilities frontier model shows that
A) if consumers decide to buy more of a product its price will increase.
B) a market economy is more efficient in producing goods and services than is a centrally planned economy.
C) economic growth can only be achieved by free market economies.
D) if all resources are fully and efficiently utilized, more of one good can be produced only by producing less of another good.
Unlock Deck
Unlock for access to all 152 flashcards in this deck.
Unlock Deck
k this deck
20
Figure 2-2.
Refer to Figure 2-2.What is the opportunity cost of one pound of meat?
A)
B)
C)
D)
Refer to Figure 2-2.What is the opportunity cost of one pound of meat?
A)
B)
C)
D)
Unlock Deck
Unlock for access to all 152 flashcards in this deck.
Unlock Deck
k this deck
21
Figure 2-4
Figure 2-4 shows various points on three different production possibilities frontiers for a nation.
Refer to Figure 2-4.Consider the following events:
A.a reduction in the patent protection period to no more than 2 years
B.a war that destroys a substantial portion of a nation's capital stock
C.the lack of secure and enforceable property rights system
Which of the events listed above could cause a movement from W to V?
A) a only
B) a and b only
C) a and c only
D) b and c only
E) a, b, and c
Unlock Deck
Unlock for access to all 152 flashcards in this deck.
Unlock Deck
k this deck
22
Without an increase in the supplies of factors of production,how can a nation achieve economic growth?
A) by producing more high-value goods and less of low-value goods
B) through technological advancement which enables more output with the same quantity of resources
C) by lowering the prices of factors of production
D) by increasing the prices of factors of production
A) by producing more high-value goods and less of low-value goods
B) through technological advancement which enables more output with the same quantity of resources
C) by lowering the prices of factors of production
D) by increasing the prices of factors of production
Unlock Deck
Unlock for access to all 152 flashcards in this deck.
Unlock Deck
k this deck
23
Table 2-1
Production choices for Tomaso's Trattoria
Refer to Table 2-1.Assume Tomaso's Trattoria only produces pizzas and calzones.A combination of 24 pizzas and 30 calzones would appear
A) along Tomaso's production possibilities frontier.
B) inside Tomaso's production possibilities frontier.
C) outside Tomaso's production possibilities frontier.
D) at the horizontal intercept of Tomaso's production possibilities frontier.
Unlock Deck
Unlock for access to all 152 flashcards in this deck.
Unlock Deck
k this deck
24
Which of the following would shift a nation's production possibilities frontier outward?
A) discovering a cheap way to convert sunshine into electricity
B) an increase in demand for the nation's products
C) a decrease in the unemployment rate
D) a law requiring workers to retire at age 50
A) discovering a cheap way to convert sunshine into electricity
B) an increase in demand for the nation's products
C) a decrease in the unemployment rate
D) a law requiring workers to retire at age 50
Unlock Deck
Unlock for access to all 152 flashcards in this deck.
Unlock Deck
k this deck
25
An inward shift of a nation's production possibilities frontier can occur due to
A) a reduction in unemployment.
B) a natural disaster like a hurricane or bad earthquake.
C) a change in the amounts of one good desired.
D) an increase in the labor force.
A) a reduction in unemployment.
B) a natural disaster like a hurricane or bad earthquake.
C) a change in the amounts of one good desired.
D) an increase in the labor force.
Unlock Deck
Unlock for access to all 152 flashcards in this deck.
Unlock Deck
k this deck
26
The slope of a production possibilities frontier
A) has no economic relevance or meaning.
B) is always constant.
C) is always varying.
D) measures the opportunity cost of producing one more unit of a good.
A) has no economic relevance or meaning.
B) is always constant.
C) is always varying.
D) measures the opportunity cost of producing one more unit of a good.
Unlock Deck
Unlock for access to all 152 flashcards in this deck.
Unlock Deck
k this deck
27
Figure 2-4
Figure 2-4 shows various points on three different production possibilities frontiers for a nation.
Refer to Figure 2-4.Consider the following events:
A.a decrease in the unemployment rate
B.general technological advancement
C.an increase in consumer wealth
Which of the events listed above could cause a movement from V to W ?
A) a only
B) a and b only
C) b and c only
D) a, b, and c
Unlock Deck
Unlock for access to all 152 flashcards in this deck.
Unlock Deck
k this deck
28
________ marginal opportunity cost implies that the more resources already devoted to any activity,the payoff from allocating yet more resources to that activity increases by progressively smaller amounts.
A) Increasing
B) Decreasing
C) Constant
D) Negative
A) Increasing
B) Decreasing
C) Constant
D) Negative
Unlock Deck
Unlock for access to all 152 flashcards in this deck.
Unlock Deck
k this deck
29
Figure 2-3
Refer to Figure 2-3.Sergio Vignetto raises cattle and llamas on his land.A portion of his land is more suitable for raising cattle,and the other portion is better suited for raising llamas.Which of the graphs in Figure 2-3 represent his production possibilities frontier?
A) Graph A
B) Graph B
C) Graph C
D) either Graph A or Graph C
E) either Graph B or Graph C
Unlock Deck
Unlock for access to all 152 flashcards in this deck.
Unlock Deck
k this deck
30
Economic decline (negative growth)is represented on a production possibilities frontier model by the production possibility frontier
A) shifting outward.
B) shifting inward.
C) becoming steeper.
D) becoming flatter.
A) shifting outward.
B) shifting inward.
C) becoming steeper.
D) becoming flatter.
Unlock Deck
Unlock for access to all 152 flashcards in this deck.
Unlock Deck
k this deck
31
Table 2-1
Production choices for Tomaso's Trattoria
Refer to Table 2-1.Assume Tomaso's Trattoria only produces pizzas and calzones.Tomaso faces ________ opportunity costs in the production of pizzas and calzones.
A) increasing
B) decreasing
C) constant
D) negative
Production choices for Tomaso's Trattoria
Refer to Table 2-1.Assume Tomaso's Trattoria only produces pizzas and calzones.Tomaso faces ________ opportunity costs in the production of pizzas and calzones.
A) increasing
B) decreasing
C) constant
D) negative
Unlock Deck
Unlock for access to all 152 flashcards in this deck.
Unlock Deck
k this deck
32
Figure 2-4
Figure 2-4 shows various points on three different production possibilities frontiers for a nation.
Refer to Figure 2-4.Consider the following events:
A.an increase in the unemployment rate
B.a decrease in a nation's money supply
C.a war that kills a significant portion of a nation's population
Which of the events listed above could cause a movement from Y to W ?
A) a, b and c
B) a and b only
C) a and c only
D) a only
E) c only
Unlock Deck
Unlock for access to all 152 flashcards in this deck.
Unlock Deck
k this deck
33
An outward shift of a nation's production possibilities frontier represents
A) economic growth.
B) rising prices of the two goods on the production possibilities frontier model.
C) an impossible situation.
D) a situation in which a country produces more of one good and less of another.
A) economic growth.
B) rising prices of the two goods on the production possibilities frontier model.
C) an impossible situation.
D) a situation in which a country produces more of one good and less of another.
Unlock Deck
Unlock for access to all 152 flashcards in this deck.
Unlock Deck
k this deck
34
Table 2-1
Production choices for Tomaso's Trattoria
Refer to Table 2-1.Assume Tomaso's Trattoria only produces pizzas and calzones.A combination of 36 pizzas and 30 calzones would appear
A) along Tomaso's production possibilities frontier.
B) inside Tomaso's production possibilities frontier.
C) outside Tomaso's production possibilities frontier.
D) at the horizontal intercept of Tomaso's production possibilities frontier.
Unlock Deck
Unlock for access to all 152 flashcards in this deck.
Unlock Deck
k this deck
35
Figure 2-4
Figure 2-4 shows various points on three different production possibilities frontiers for a nation.
Refer to Figure 2-4.Consider the following movements:
A.from point V to point W
B.from point W to point Y
C.from point Y to point Z
Which of the movements listed above represents economic growth?
A) a, b, and c
B) b and c only
C) a only
D) b only
Unlock Deck
Unlock for access to all 152 flashcards in this deck.
Unlock Deck
k this deck
36
Figure 2-4
Figure 2-4 shows various points on three different production possibilities frontiers for a nation.
Refer to Figure 2-4.A movement from X to Y
A) could be due to a change in consumers' tastes and preferences.
B) could occur because of an influx of immigrant labor.
C) is the result of advancements in food production technology only, with no change in the technology for plastic production.
D) is the result of advancements in plastic production technology only, with no change in food production technology.
Unlock Deck
Unlock for access to all 152 flashcards in this deck.
Unlock Deck
k this deck
37
Figure 2-3
Refer to Figure 2-3.Sergio Vignetto raises cattle and llamas on his land.His land is equally suitable for raising either animal.Which of the graphs in Figure 2-3 represent his production possibilities frontier?
A) Graph A
B) Graph B
C) Graph C
D) either Graph A or Graph C
E) either Graph B or Graph C
Unlock Deck
Unlock for access to all 152 flashcards in this deck.
Unlock Deck
k this deck
38
If opportunity costs are constant,the production possibilities frontier would be graphed as
A) a ray from the origin.
B) a positively sloped straight line.
C) a negatively sloped curve bowed in toward the origin.
D) a negatively sloped straight line.
A) a ray from the origin.
B) a positively sloped straight line.
C) a negatively sloped curve bowed in toward the origin.
D) a negatively sloped straight line.
Unlock Deck
Unlock for access to all 152 flashcards in this deck.
Unlock Deck
k this deck
39
Figure 2-4
Figure 2-4 shows various points on three different production possibilities frontiers for a nation.
Refer to Figure 2-4.A movement from Y to Z
A) represents an increase in the demand for plastic products.
B) could occur because of general technological advancements.
C) is the result of advancements in food production technology.
D) is the result of advancements in plastic production technology.
Unlock Deck
Unlock for access to all 152 flashcards in this deck.
Unlock Deck
k this deck
40
Table 2-1
Production choices for Tomaso's Trattoria
Refer to Table 2-1.Assume Tomaso's Trattoria only produces pizzas and calzones.A combination of 24 pizzas and 15 calzones would appear
A) along Tomaso's production possibilities frontier.
B) inside Tomaso's production possibilities frontier.
C) outside Tomaso's production possibilities frontier.
D) at the horizontal intercept of Tomaso's production possibilities frontier.
Unlock Deck
Unlock for access to all 152 flashcards in this deck.
Unlock Deck
k this deck
41
On a diagram of a production possibility frontier,opportunity cost is represented by the production possibility frontier shifting outward.
Unlock Deck
Unlock for access to all 152 flashcards in this deck.
Unlock Deck
k this deck
42
According to the production possibility model,if more resources are allocated to the production of physical and human capital,then which of the following is likely to happen?
A) fewer goods will be produced for consumption today.
B) the production possibilities frontier will be shift inward in the future
C) future economic growth will decline.
D) the country's total production will fall.
A) fewer goods will be produced for consumption today.
B) the production possibilities frontier will be shift inward in the future
C) future economic growth will decline.
D) the country's total production will fall.
Unlock Deck
Unlock for access to all 152 flashcards in this deck.
Unlock Deck
k this deck
43
Figure 2-6
General Motors recently approved for production the Cadillac Converj, an electric car based on its Chevy Volt. The Converj will feature a "Generation 1.5 Voltec" powertrain, with a hybrid engine that runs on a combination of electricity and gasoline. Assume GM chooses to produce both hybrid-engine vehicles and gasoline-engine vehicles for its Cadillac brand. Figure 2-6 shows changes to its production possibilities frontier in response to new developments and different strategic production decisions.
Refer to Figure 2-6.In response to changing consumer demands,GM has cut back on the production of hybrids and increased its production of gasoline-powered vehicles.This strategy is best represented by the
A) movement from F to E in Graph A.
B) movement from G to J in Graph B.
C) movement from L to K in Graph C.
D) movement from J to H in Graph B.
Unlock Deck
Unlock for access to all 152 flashcards in this deck.
Unlock Deck
k this deck
44
Figure 2-6
General Motors recently approved for production the Cadillac Converj, an electric car based on its Chevy Volt. The Converj will feature a "Generation 1.5 Voltec" powertrain, with a hybrid engine that runs on a combination of electricity and gasoline. Assume GM chooses to produce both hybrid-engine vehicles and gasoline-engine vehicles for its Cadillac brand. Figure 2-6 shows changes to its production possibilities frontier in response to new developments and different strategic production decisions.
Refer to Figure 2-6.Assume that in 2011,GM was able to reopen one of its factories after an extensive remodelling which now allows for the production of both types of vehicles.This is best represented by the
A) movement from E to F in Graph A.
B) movement from H to J in Graph B.
C) movement from L to K in Graph C.
D) movement from J to G in Graph B.
Unlock Deck
Unlock for access to all 152 flashcards in this deck.
Unlock Deck
k this deck
45
Figure 2-5
Refer to Figure 2-5.If the economy is currently producing at point Y,what is the opportunity cost of moving to point W?
A) 2 million tons of steel
B) zero
C) 9 million tons of paper
D) 16 million tons of paper
Refer to Figure 2-5.If the economy is currently producing at point Y,what is the opportunity cost of moving to point W?
A) 2 million tons of steel
B) zero
C) 9 million tons of paper
D) 16 million tons of paper
Unlock Deck
Unlock for access to all 152 flashcards in this deck.
Unlock Deck
k this deck
46
An increase in the labor force shifts the production possibility frontier inwards over time.
Unlock Deck
Unlock for access to all 152 flashcards in this deck.
Unlock Deck
k this deck
47
The U.S.government provides health care to about 30 percent of the population through programs such as Medicare and Medicaid.The Congressional Budget Office estimates that as the U.S.population ages and medical costs continue to rise,federal government spending on Medicare will
A) cause the federal government to go bankrupt within the next 5 years.
B) leave no funds for Medicaid, which will virtually eliminate this program.
C) more than double over the next 10 years.
D) start to decrease, since Medicare will be funded by social security contributions beginning in 2012.
A) cause the federal government to go bankrupt within the next 5 years.
B) leave no funds for Medicaid, which will virtually eliminate this program.
C) more than double over the next 10 years.
D) start to decrease, since Medicare will be funded by social security contributions beginning in 2012.
Unlock Deck
Unlock for access to all 152 flashcards in this deck.
Unlock Deck
k this deck
48
If a country is producing efficiently and is on the production possibilities frontier,the only way to produce more of one good is to produce less of the other.
Unlock Deck
Unlock for access to all 152 flashcards in this deck.
Unlock Deck
k this deck
49
If society decides it wants more of one good and all resources are fully utilized,then
A) it is unable to do this unless technology advances.
B) additional resource supplies will have to be found.
C) it has to give up some of another good and incur some opportunity costs.
D) more unemployment will occur.
A) it is unable to do this unless technology advances.
B) additional resource supplies will have to be found.
C) it has to give up some of another good and incur some opportunity costs.
D) more unemployment will occur.
Unlock Deck
Unlock for access to all 152 flashcards in this deck.
Unlock Deck
k this deck
50
Figure 2-5
Refer to Figure 2-5.If the economy is currently producing at point W,what is the opportunity cost of moving to point X?
A) 3 million tons of steel
B) 19 million tons of steel
C) 5 million tons of paper
D) 9 million tons of paper
Refer to Figure 2-5.If the economy is currently producing at point W,what is the opportunity cost of moving to point X?
A) 3 million tons of steel
B) 19 million tons of steel
C) 5 million tons of paper
D) 9 million tons of paper
Unlock Deck
Unlock for access to all 152 flashcards in this deck.
Unlock Deck
k this deck
51
Figure 2-6
General Motors recently approved for production the Cadillac Converj, an electric car based on its Chevy Volt. The Converj will feature a "Generation 1.5 Voltec" powertrain, with a hybrid engine that runs on a combination of electricity and gasoline. Assume GM chooses to produce both hybrid-engine vehicles and gasoline-engine vehicles for its Cadillac brand. Figure 2-6 shows changes to its production possibilities frontier in response to new developments and different strategic production decisions.
Refer to Figure 2-6.Assume a technological advancement greatly reduces the cost to produce hybrid-engine vehicles.This is best represented by the
A) movement from E to F in Graph A.
B) movement from G to H in Graph B.
C) movement from K to L in Graph C.
D) movement from H to J in Graph B.
Unlock Deck
Unlock for access to all 152 flashcards in this deck.
Unlock Deck
k this deck
52
Suppose your expenses for this term are as follows: tuition: $12,000,room and board: $6,500,books and other educational supplies: $1,500.Further,during the term,you can only work part-time and earn $3,500 instead of your full-time salary of $14,000.What is the opportunity cost of going to college this term,assuming that your room and board expenses would be the same even if you did not go to college?
A) $13,500
B) $20,000
C) $24,000
D) $30,500
A) $13,500
B) $20,000
C) $24,000
D) $30,500
Unlock Deck
Unlock for access to all 152 flashcards in this deck.
Unlock Deck
k this deck
53
Any output combination outside a production possibility frontier is associated with unused or
underutilized resources.
underutilized resources.
Unlock Deck
Unlock for access to all 152 flashcards in this deck.
Unlock Deck
k this deck
54
The Great Depression of the 1930s with a large number of workers and factories unemployed would be represented in a production possibilities frontier graph by
A) a point inside the frontier.
B) a point outside the frontier.
C) a point on the frontier.
D) an intercept on either the vertical or the horizontal axis.
A) a point inside the frontier.
B) a point outside the frontier.
C) a point on the frontier.
D) an intercept on either the vertical or the horizontal axis.
Unlock Deck
Unlock for access to all 152 flashcards in this deck.
Unlock Deck
k this deck
55
Suppose there is no unemployment in the economy and society decides that it wants more of one good.Which of the following statements is true?
A) It can only achieve this with an advance in technology.
B) It can increase output without giving up another good.
C) It can only achieve this with an increase in resource supplies.
D) It will have to give up production and consumption of some other good.
A) It can only achieve this with an advance in technology.
B) It can increase output without giving up another good.
C) It can only achieve this with an increase in resource supplies.
D) It will have to give up production and consumption of some other good.
Unlock Deck
Unlock for access to all 152 flashcards in this deck.
Unlock Deck
k this deck
56
A decrease in the unemployment rate may be represented as a movement from a point on the production possibilities frontier to a point outside the frontier.
Unlock Deck
Unlock for access to all 152 flashcards in this deck.
Unlock Deck
k this deck
57
The opportunity cost of taking a semester-long economics class is
A) the cost of tuition and fees only.
B) the value of the time spent in the classroom.
C) zero because there is no admission charged if you are enrolled in the course.
D) equal to the highest value of an alternative use of the time and money spent on the class.
E) the knowledge and enjoyment you receive from attending the class.
Unlock Deck
Unlock for access to all 152 flashcards in this deck.
Unlock Deck
k this deck
58
Consider a country that produces only two goods: kayaks and coconuts.Suppose it is possible for this country to increase its production of kayaks without producing fewer coconuts.In this case,its current output combination is efficient.
Unlock Deck
Unlock for access to all 152 flashcards in this deck.
Unlock Deck
k this deck
59
In a report made to the U.S.Congress in 2001,the National Academy of Sciences cautioned that if fuel economy encourages the production of smaller and lighter cars,"Some additional traffic fatalities would be expected." This statement suggests that
A) U.S. auto manufacturers are more concerned about producing fuel efficient cars to compete with their Japanese and South Korean rivals than about consumer safety.
B) there is a tradeoff between safety and fuel economy.
C) society should value safety more highly than fuel economy.
D) society should value fuel economy more highly than consumer safety because of the long term environment benefits generated by less gasoline use.
Unlock Deck
Unlock for access to all 152 flashcards in this deck.
Unlock Deck
k this deck
60
If additional units of a good could be produced at a constant opportunity cost,the production
possibility frontier would be bowed outward (concave).
possibility frontier would be bowed outward (concave).
Unlock Deck
Unlock for access to all 152 flashcards in this deck.
Unlock Deck
k this deck
61
Table 2-3
Table 2-3 shows the output per week of two jewelers, Serena and Haley. They can either devote their time to making bracelets or making necklaces.
Refer to Table 2-3.Which of the following statements is true?
A) Haley has a comparative advantage in making both products.
B) Serena has a comparative advantage in making both products.
C) Haley has a comparative advantage in making bracelets and Serena in making necklaces.
D) Haley has a comparative advantage in making necklaces and Serena in making bracelets.
Unlock Deck
Unlock for access to all 152 flashcards in this deck.
Unlock Deck
k this deck
62
Table 2-2
Refer to Table 2-2.The Fruit Farm produces only apples and pears.The table above shows the maximum possible output combinations of the two fruits using all resources and currently available technology.
a.Graph The Fruit Farm's production possibilities frontier.Put apples on the horizontal axis and pears on the vertical axis.Be sure to identify the output combination points on your diagram.
b.Suppose The Fruit Farm is currently producing at point D.What is the opportunity cost of producing an additional 8,000 pounds of pears?
c.Suppose The Fruit Farm is currently producing at point D.What happens to the opportunity cost of producing more and more pears? Does it increase,decrease or remain constant? Explain your answer.
d.Suppose The Fruit Farm is currently producing at point G.What happens to the opportunity cost of producing more and more apples? Does it increase,decrease or remain constant? Explain your answer.
e.Suppose The Fruit Farm is plagued by the apple maggot infestation which destroys apple trees but not pears.Show in a graph what happens to its PPF.
Unlock Deck
Unlock for access to all 152 flashcards in this deck.
Unlock Deck
k this deck
63
Table 2-3
Table 2-3 shows the output per week of two jewelers, Serena and Haley. They can either devote their time to making bracelets or making necklaces.
Refer to Table 2-3.What is Serena's opportunity cost of making a necklace?
A) 2 necklaces
B) 1/2 of a bracelet
C) 1/2 of a necklace
D) 3/4 of a bracelet
Table 2-3 shows the output per week of two jewelers, Serena and Haley. They can either devote their time to making bracelets or making necklaces.
Refer to Table 2-3.What is Serena's opportunity cost of making a necklace?
A) 2 necklaces
B) 1/2 of a bracelet
C) 1/2 of a necklace
D) 3/4 of a bracelet
Unlock Deck
Unlock for access to all 152 flashcards in this deck.
Unlock Deck
k this deck
64
Figure 2-7
Figure 2-7 shows the production possibilities frontiers for Pakistan and Indonesia. Each country produces two goods, cotton and cashews.
Refer to Figure 2-7.What is the opportunity cost of producing 1 pound of cashews in Indonesia?
A) 3/8 of a bolt of cotton
B) 5/8 of a bolt of cotton
C) 2 2/3 bolts of cotton
D) 320 bolts of cotton
Unlock Deck
Unlock for access to all 152 flashcards in this deck.
Unlock Deck
k this deck
65
What is a production possibilities frontier? What do points along the frontier represent? What do points inside and outside the frontier represent?
Unlock Deck
Unlock for access to all 152 flashcards in this deck.
Unlock Deck
k this deck
66
Figure 2-7
Figure 2-7 shows the production possibilities frontiers for Pakistan and Indonesia. Each country produces two goods, cotton and cashews.
Refer to Figure 2-7.What is the opportunity cost of producing 1 bolt of cotton in Pakistan?
A) 3/8 of a pound of cashews
B) 5/8 of a pound of cashews
C) 1 3/5 pounds of cashews
D) 150 pounds of cashews
Unlock Deck
Unlock for access to all 152 flashcards in this deck.
Unlock Deck
k this deck
67
a.Draw a production possibilities frontier for a country that produces two goods,beer and pretzels.Assume that resources are equally suited to both tasks.
b.Define opportunity costs.
c.Use your production possibilities frontier graph to demonstrate the principle of opportunity costs.
b.Define opportunity costs.
c.Use your production possibilities frontier graph to demonstrate the principle of opportunity costs.
Unlock Deck
Unlock for access to all 152 flashcards in this deck.
Unlock Deck
k this deck
68
Table 2-3
Table 2-3 shows the output per week of two jewelers, Serena and Haley. They can either devote their time to making bracelets or making necklaces.
Refer to Table 2-3.What is Haley's opportunity cost of making a bracelet?
A) 3/4 of a bracelet
B) 3 bracelets
C) 1 1/3 necklaces
D) 2 necklaces
Table 2-3 shows the output per week of two jewelers, Serena and Haley. They can either devote their time to making bracelets or making necklaces.
Refer to Table 2-3.What is Haley's opportunity cost of making a bracelet?
A) 3/4 of a bracelet
B) 3 bracelets
C) 1 1/3 necklaces
D) 2 necklaces
Unlock Deck
Unlock for access to all 152 flashcards in this deck.
Unlock Deck
k this deck
69
For each bottle of wine that Italy produces,it gives up the opportunity to make 10 pounds of cheese.France can produce 1 bottle of wine for every 25 pounds of cheese it produces.Which of the following is true about the comparative advantage between the two countries?
A) Italy has the comparative advantage in cheese.
B) Italy has the comparative advantage in wine.
C) France has the comparative advantage in wine and cheese.
D) France has the comparative advantage in wine.
A) Italy has the comparative advantage in cheese.
B) Italy has the comparative advantage in wine.
C) France has the comparative advantage in wine and cheese.
D) France has the comparative advantage in wine.
Unlock Deck
Unlock for access to all 152 flashcards in this deck.
Unlock Deck
k this deck
70
You have an absolute advantage whenever you
A) are better educated than someone else.
B) can produce more of something than others with the same resources.
C) prefer to do one particular activity.
D) can produce something at a lower opportunity cost than others.
A) are better educated than someone else.
B) can produce more of something than others with the same resources.
C) prefer to do one particular activity.
D) can produce something at a lower opportunity cost than others.
Unlock Deck
Unlock for access to all 152 flashcards in this deck.
Unlock Deck
k this deck
71
Figure 2-7
Figure 2-7 shows the production possibilities frontiers for Pakistan and Indonesia. Each country produces two goods, cotton and cashews.
Refer to Figure 2-7.Which country has a comparative advantage in the production of cotton?
A) Indonesia
B) They have equal productive abilities.
C) Pakistan
D) neither country
Unlock Deck
Unlock for access to all 152 flashcards in this deck.
Unlock Deck
k this deck
72
To increase gas mileage,automobile manufacturers make cars small and light.Large cars absorb more of the impact of an accident than small cars but yield lower gas mileage.These facts suggest that a negative relationship exists between safety and gas mileage.
Unlock Deck
Unlock for access to all 152 flashcards in this deck.
Unlock Deck
k this deck
73
Figure 2-7
Figure 2-7 shows the production possibilities frontiers for Pakistan and Indonesia. Each country produces two goods, cotton and cashews.
Refer to Figure 2-7.What is the opportunity cost of producing 1 pound of cashews in Pakistan?
A) 3/8 of a bolt of cotton
B) 5/8 of a bolt of cotton
C) 1 3/5 bolts of cotton
D) 240 bolts of cotton
Unlock Deck
Unlock for access to all 152 flashcards in this deck.
Unlock Deck
k this deck
74
Figure 2-7
Figure 2-7 shows the production possibilities frontiers for Pakistan and Indonesia. Each country produces two goods, cotton and cashews.
Refer to Figure 2-7.What is the opportunity cost of producing 1 bolt of cotton in Indonesia?
A) 3/8 of a pound of cashews
B) 5/8 of a pound of cashews
C) 2 2/3 pounds of cashews
D) 120 pounds of cashews
Unlock Deck
Unlock for access to all 152 flashcards in this deck.
Unlock Deck
k this deck
75
What shape does a production possibilities frontier take if it displays increasing opportunity costs? What shape does a production possibilities frontier take if it displays constant opportunity costs? Which shape is most common in production situations?
Unlock Deck
Unlock for access to all 152 flashcards in this deck.
Unlock Deck
k this deck
76
Specializing in the production of a good or service in which one has a comparative advantage enables a country to do all of the following except
A) engage in mutually beneficial trade with other nations.
B) increase the variety of products that it can consume with no increase in resources.
C) consume a combination of goods that lies outside its own production possibilities frontier.
D) produce a combination of goods that lies outside its own production possibilities frontier.
Unlock Deck
Unlock for access to all 152 flashcards in this deck.
Unlock Deck
k this deck
77
Table 2-3
Table 2-3 shows the output per week of two jewelers, Serena and Haley. They can either devote their time to making bracelets or making necklaces.
Refer to Table 2-3.What is Haley's opportunity cost of making a necklace?
A) 3/4 of a bracelet
B) 3 bracelets
C) 1 1/3 necklaces
D) 2 necklaces
Table 2-3 shows the output per week of two jewelers, Serena and Haley. They can either devote their time to making bracelets or making necklaces.
Refer to Table 2-3.What is Haley's opportunity cost of making a necklace?
A) 3/4 of a bracelet
B) 3 bracelets
C) 1 1/3 necklaces
D) 2 necklaces
Unlock Deck
Unlock for access to all 152 flashcards in this deck.
Unlock Deck
k this deck
78
Comparative advantage means the ability to produce a good or service
A) at a lower selling price than any other producer.
B) at a lower opportunity cost than any other producer.
C) of a higher quality than any other producer.
D) at a higher profit level than any other producer.
A) at a lower selling price than any other producer.
B) at a lower opportunity cost than any other producer.
C) of a higher quality than any other producer.
D) at a higher profit level than any other producer.
Unlock Deck
Unlock for access to all 152 flashcards in this deck.
Unlock Deck
k this deck
79
Table 2-3
Table 2-3 shows the output per week of two jewelers, Serena and Haley. They can either devote their time to making bracelets or making necklaces.
Refer to Table 2-3.Which of the following statements is true?
A) Haley has an absolute advantage in making both products.
B) Serena has an absolute advantage in making both products.
C) Haley has an absolute advantage in making bracelets and Serena in making necklaces.
D) Haley has an absolute advantage in making necklaces and Serena in making bracelets.
Unlock Deck
Unlock for access to all 152 flashcards in this deck.
Unlock Deck
k this deck
80
Table 2-3
Table 2-3 shows the output per week of two jewelers, Serena and Haley. They can either devote their time to making bracelets or making necklaces.
Refer to Table 2-3.What is Serena's opportunity cost of making a bracelet?
A) 2 necklaces
B) 1/2 of a bracelet
C) 1/2 of a necklace
D) 3/4 of a bracelet
Table 2-3 shows the output per week of two jewelers, Serena and Haley. They can either devote their time to making bracelets or making necklaces.
Refer to Table 2-3.What is Serena's opportunity cost of making a bracelet?
A) 2 necklaces
B) 1/2 of a bracelet
C) 1/2 of a necklace
D) 3/4 of a bracelet
Unlock Deck
Unlock for access to all 152 flashcards in this deck.
Unlock Deck
k this deck
Unlock Deck
Unlock for access to all 152 flashcards in this deck.


