Deck 4: Economic Efficiency, government Price Setting, and Taxes
Full screen (f)
Question
Question
Question
Question
Question
Table 4-1
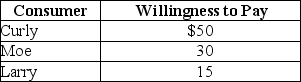
Refer to Table 4-1. The table above lists the highest prices three consumers,Curly,Moe,and Larry,are willing to pay for a bottle of champagne. If the price of one of the bottles is $24 dollars
A) Curly will buy two bottles, Moe will buy one bottle and Larry will buy no bottles.
B) Curly will receive $26 of consumer surplus from buying one bottle.
C) Curly and Moe receive a total of $80 of consumer surplus from buying one bottle each. Larry will buy no bottles.
D) Larry will receive $15 of consumer surplus since he will buy no bottles.
Question
Question
Question
Question
Table 4-2
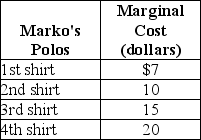
Refer to Table 4-2. The table above lists the marginal cost of polo shirts by Marko's,a firm that specializes in producing men's clothing. If the market price of Marko's polo shirts is $18
A) Marko's will produce four shirts.
B) producer surplus from the first shirt is $18.
C) producer surplus will equal $22.
D) there will be a surplus; as a result, the price will fall to $7.
Question
Question
Question
Question
Table 4-1
Refer to Table 4-1. The table above lists the highest prices three consumers,Curly,Moe,and Larry,are willing to pay for a bottle of champagne. If the price of the champagne falls from $24 to $14
A) consumer surplus increases from $32 to $53.
B) Curly will buy four bottles; Moe will buy two bottles, and Larry will buy one bottle.
C) consumer surplus will increase from $80 to $95.
D) Larry and Moe will receive more consumer surplus than Curly.
Question
Question
Question
Question
Question
Question
Table 4-2
Refer to Table 4-2.The table above lists the marginal cost of polo shirts by Marko's,a firm that specializes in producing men's clothing. If the price of polo shirts increases from $15 to $20
A) consumers will buy no polo shirts.
B) the marginal cost of producing the third polo shirt will increase to $20.
C) producer surplus will rise from $13 to $28.
D) there will be a surplus of polo shirts.
Question
Question
Figure 4-1
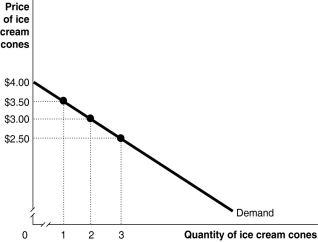
Figure 4-1 shows Kendra's demand for ice-cream cones curve.
Suppliers will be willing to supply a product in all of the following situations except
A) the price received is greater than the additional cost of producing the product.
B) the price received is at least equal to the additional cost of producing the product.
C) the price received is equal to the additional cost of producing the product.
D) the price received is less than the additional cost of producing the product.
Question
Question
Figure 4-1
Figure 4-1 shows Kendra's demand for ice-cream cones curve.
Refer to Figure 4-1. If the market price is $2.50,what is Kendra's consumer surplus?
A) $9.00
B) $7.50
C) $1.50
D) $0
Figure 4-1 shows Kendra's demand for ice-cream cones curve.
Refer to Figure 4-1. If the market price is $2.50,what is Kendra's consumer surplus?
A) $9.00
B) $7.50
C) $1.50
D) $0
Question
Figure 4-2
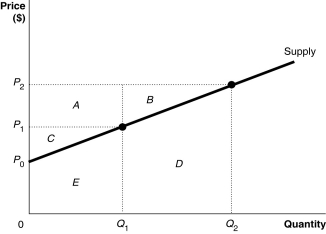
Refer to Figure 4-2.What area represents the decrease in producer surplus when the market price falls from P₂ to P₁?
A) C + E
B) A + C + E
C) A + B
D) B + D
Refer to Figure 4-2.What area represents the decrease in producer surplus when the market price falls from P₂ to P₁?
A) C + E
B) A + C + E
C) A + B
D) B + D
Question
Question
Question
Figure 4-1
Figure 4-1 shows Kendra's demand for ice-cream cones curve.
Refer to Figure 4-1.If the market price is $2.50,what is the maximum number of ice cream cones that Kendra will buy?
A) 1
B) 2
C) 3
D) 4
Figure 4-1 shows Kendra's demand for ice-cream cones curve.
Refer to Figure 4-1.If the market price is $2.50,what is the maximum number of ice cream cones that Kendra will buy?
A) 1
B) 2
C) 3
D) 4
Question
Figure 4-3
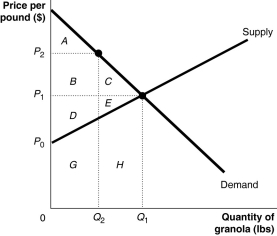
Figure 4-3 shows the market for granola. The market is initially in equilibrium at a price of P₁ and a quantity of Q₁. Now suppose producers decide to cut output to Q₂ in order to raise the price to P₂.
Refer to Figure 4-3.What area represents consumer surplus at P₂?
A) A
B) A + B
C) B + C
D) A + B + D + F
Question
Figure 4-1
Figure 4-1 shows Kendra's demand for ice-cream cones curve.
Refer to Figure 4-1. What is the total amount that Kendra is willing to pay for 3 ice cream cones?
A) $2.50
B) $7.50
C) $9.00
D) $13.50
Figure 4-1 shows Kendra's demand for ice-cream cones curve.
Refer to Figure 4-1. What is the total amount that Kendra is willing to pay for 3 ice cream cones?
A) $2.50
B) $7.50
C) $9.00
D) $13.50
Question
Question
Question
Question
Figure 4-1
Figure 4-1 shows Kendra's demand for ice-cream cones curve.
Refer to Figure 4-1. If the market price is $2.50,what is the consumer surplus on the second ice cream cone?
A) $0.50
B) $1.50
C) $3.00
D) $10.50
Figure 4-1 shows Kendra's demand for ice-cream cones curve.
Refer to Figure 4-1. If the market price is $2.50,what is the consumer surplus on the second ice cream cone?
A) $0.50
B) $1.50
C) $3.00
D) $10.50
Question
Question
Figure 4-2
Refer to Figure 4-2.What area represents producer surplus at a price of P₁?
A) C
B) A + C
C) C + E
D) A + C + E
Refer to Figure 4-2.What area represents producer surplus at a price of P₁?
A) C
B) A + C
C) C + E
D) A + C + E
Question
Question
Question
Figure 4-1
Figure 4-1 shows Kendra's demand for ice-cream cones curve.
The difference between the lowest price a firm would have been willing to accept and the price it actually receives from the sale of a product is called
A) producer surplus.
B) profit.
C) marginal revenue.
D) price differential.
Figure 4-1 shows Kendra's demand for ice-cream cones curve.
The difference between the lowest price a firm would have been willing to accept and the price it actually receives from the sale of a product is called
A) producer surplus.
B) profit.
C) marginal revenue.
D) price differential.
Question
Question
Figure 4-1
Figure 4-1 shows Kendra's demand for ice-cream cones curve.
Refer to Figure 4-1.Kendra's marginal benefit from consuming the second ice cream cone is
A) $6.50
B) $6.00
C) $3.00
D) $2.25
Figure 4-1 shows Kendra's demand for ice-cream cones curve.
Refer to Figure 4-1.Kendra's marginal benefit from consuming the second ice cream cone is
A) $6.50
B) $6.00
C) $3.00
D) $2.25
Question
Figure 4-3
Figure 4-3 shows the market for granola. The market is initially in equilibrium at a price of P₁ and a quantity of Q₁. Now suppose producers decide to cut output to Q₂ in order to raise the price to P₂.
Refer to Figure 4-3. What area represents the deadweight loss at P₂?
A) C + E + H
B) G + H
C) C + E
D) B + C
Question
Figure 4-3
Figure 4-3 shows the market for granola. The market is initially in equilibrium at a price of P₁ and a quantity of Q₁. Now suppose producers decide to cut output to Q₂ in order to raise the price to P₂.
Refer to Figure 4-3. At the price P₂ consumers are willing to buy the Q₂ pounds of granola.Is this an economically efficient quantity?
A) No, the marginal benefit of the last unit (Q₂) exceeds the marginal cost of that last unit.
B) Yes, otherwise consumers would not buy Q₂ units.
C) Yes, because the price P₂ shows what consumers are willing to pay for the product.
D) No, the marginal cost of the last unit (Q₂) exceeds the marginal benefit of the last unit.
Question
Question
Question
Question
Question
Figure 4-3
Figure 4-3 shows the market for granola. The market is initially in equilibrium at a price of P₁ and a quantity of Q₁. Now suppose producers decide to cut output to Q₂ in order to raise the price to P₂.
Refer to Figure 4-3. What area represents producer surplus at P₂?
A) A + B + D
B) B + D
C) B + D + G
D) B + C + D + E
Question
Question
Figure 4-4
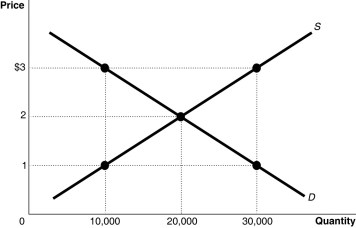
Refer to Figure 4-4. The figure above represents the market for iced tea.Assume that this is a competitive market. If the price of iced tea is $1
A) the quantity supplied is less than the economically efficient quantity.
B) the quantity supplied is economically efficient but the quantity demanded is economically inefficient.
C) economic surplus is maximized.
D) not enough consumers want to buy iced tea.
Question
Figure 4-4
Refer to Figure 4-4. The figure above represents the market for iced tea. Assume that this is a competitive market. Which of the following is true?
A) If the price of iced tea is $3 the output will be economically efficient but there will be a deadweight loss.
B) If the price of iced tea is $3 consumers will purchase more than the economically efficient output.
C) Both 10,000 and 30,000 are economically inefficient rates of output.
D) If the price of iced tea is $3 producers will sell 30,000 units of iced tea but this output will be economically inefficient.
Question
Question
Question
Question
Figure 4-4
Refer to Figure 4-4. The figure above represents the market for iced tea. Assume that this is a competitive market. If 20,000 units of iced tea are sold
A) the deadweight loss is equal to economic surplus.
B) producer surplus equals consumer surplus.
C) the marginal benefit of each of the 20,000 units of iced tea equals $3.
D) marginal benefit is equal to marginal cost.
Question
Figure 4-4
Refer to Figure 4-4. The figure above represents the market for iced tea. Assume that this is a competitive market. If the price of iced tea is $3,what changes in the market would result in an economically efficient output?
A) The price would decrease, the quantity supplied would increase, and the quantity demanded would decrease.
B) The quantity supplied would decrease, the quantity demanded would increase and the equilibrium price would decrease.
C) The price would decrease, the demand would increase and the supply would decrease.
D) The price would decrease, quantity demanded would increase and quantity supplied would decrease.
Question
Figure 4-4
Refer to Figure 4-4. The figure above represents the market for iced tea. Assume that this is a competitive market.At a price of $3
A) the marginal cost of iced tea is greater than the marginal benefit; therefore, output is inefficiently low.
B) producers should lower the price to $1 in order to sell the quantity demanded of 10,000.
C) the marginal benefit of iced tea is greater than the marginal cost; therefore, output is inefficiently low.
D) the marginal benefit of iced tea is greater than the marginal cost; therefore, output is inefficiently high.
Question
Question
Question
Question
Question
Question
Question
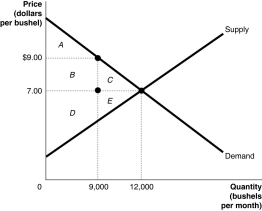
The graph below represents the market for alfalfa.The equilibrium price is $7.00 per bushel,but the market price is $9.00 per bushel. Identify the areas representing consumer surplus,producer surplus,and deadweight loss at the equilibrium price of $7.00 and at the market price of $9.00.
Question
Question
Question
Table 4-3
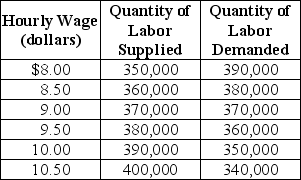
Table 4-3 shows the demand and supply schedules for the low-skilled labor market in the city of Westover.
Refer to Table 4-3.If a minimum wage of $9.50 an hour is mandated,what is the quantity of labor demanded?
A) 380,000
B) 370,000
C) 360,000
D) 10,000
Table 4-3 shows the demand and supply schedules for the low-skilled labor market in the city of Westover.
Refer to Table 4-3.If a minimum wage of $9.50 an hour is mandated,what is the quantity of labor demanded?
A) 380,000
B) 370,000
C) 360,000
D) 10,000
Question
Table 4-3
Table 4-3 shows the demand and supply schedules for the low-skilled labor market in the city of Westover.
Refer to Table 4-3.What is the equilibrium hourly wage (W*)and the equilibrium quantity of labor (Q*)?
A) W* = $9.00; Q* = 370,000
B) W* = $8.50; Q* = 380,000
C) W* = $8.50; Q* = 360,000
D) W* = $9.00; Q* = 740,000
Question
Table 4-3
Table 4-3 shows the demand and supply schedules for the low-skilled labor market in the city of Westover.
Refer to Table 4-3.If a minimum wage of $9.50 an hour is mandated,what is the quantity of labor supplied?
A) 390,000
B) 380,000
C) 370,000
D) 340,000
Table 4-3 shows the demand and supply schedules for the low-skilled labor market in the city of Westover.
Refer to Table 4-3.If a minimum wage of $9.50 an hour is mandated,what is the quantity of labor supplied?
A) 390,000
B) 380,000
C) 370,000
D) 340,000
Question
Figure 4-5
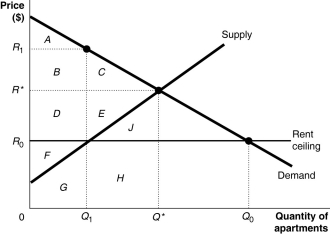
Figure 4-5 shows the market for apartments in Bay City. Recently, the government imposed a rent ceiling at R₀.
Refer to Figure 4-5. What is the area that represents consumer surplus after the imposition of the ceiling?
A) A + B+ D
B) A + B + C
C) A + B + D + F
D) A + B + D + F + G
Figure 4-5 shows the market for apartments in Bay City. Recently, the government imposed a rent ceiling at R₀.
Refer to Figure 4-5. What is the area that represents consumer surplus after the imposition of the ceiling?
A) A + B+ D
B) A + B + C
C) A + B + D + F
D) A + B + D + F + G
Question
Figure 4-5
Figure 4-5 shows the market for apartments in Bay City. Recently, the government imposed a rent ceiling at R₀.
Refer to Figure 4-5. What is the area that represents the producer surplus after the imposition of the ceiling?
A) F + G
B) F
C) D + F + G
D) A + B + D + F + G
Figure 4-5 shows the market for apartments in Bay City. Recently, the government imposed a rent ceiling at R₀.
Refer to Figure 4-5. What is the area that represents the producer surplus after the imposition of the ceiling?
A) F + G
B) F
C) D + F + G
D) A + B + D + F + G
Question
Question
Figure 4-5
Figure 4-5 shows the market for apartments in Bay City. Recently, the government imposed a rent ceiling at R₀.
Refer to Figure 4-5. With rent control,the quantity supplied is Q₁. Suppose apartment owners ignore the law and rent this quantity for the highest rent they can get. What is the highest rent they can get?
A) R*
B) R₁
C) R₀
D) more than R₁
Question
Table 4-3
Table 4-3 shows the demand and supply schedules for the low-skilled labor market in the city of Westover.
Refer to Table 4-3.Suppose that the quantity of labor demanded increases by 40,000 at each wage level.What are the new free market equilibrium hourly wage and the new equilibrium quantity of labor?
A) W = $10.00; Q = 390,000
B) W = $9.50; Q = 380,000
C) W = $8.50; Q = 380,000
D) W = $8.00; Q = 390,000
Question
Figure 4-5
Figure 4-5 shows the market for apartments in Bay City. Recently, the government imposed a rent ceiling at R₀.
Refer to Figure 4-5. What is the area that represents the portion of producer surplus transferred to consumers as a result of the rent ceiling?
A) D + E
B) D + F
C) D
D) F
Figure 4-5 shows the market for apartments in Bay City. Recently, the government imposed a rent ceiling at R₀.
Refer to Figure 4-5. What is the area that represents the portion of producer surplus transferred to consumers as a result of the rent ceiling?
A) D + E
B) D + F
C) D
D) F
Question
Question
Question
Table 4-3
Table 4-3 shows the demand and supply schedules for the low-skilled labor market in the city of Westover.
Refer to Table 4-3. If a minimum wage of $9.50 is mandated there will be a
A) shortage of 10,000 units of labor.
B) surplus of 10,000 units of labor.
C) shortage of 20,000 units of labor.
D) surplus of 20,000 units of labor.
Question
Figure 4-5
Figure 4-5 shows the market for apartments in Bay City. Recently, the government imposed a rent ceiling at R₀.
Refer to Figure 4-5. What area represents the deadweight loss after the imposition of the ceiling?
A) G + H
B) J + H
C) C + E + J + H
D) C + E
Figure 4-5 shows the market for apartments in Bay City. Recently, the government imposed a rent ceiling at R₀.
Refer to Figure 4-5. What area represents the deadweight loss after the imposition of the ceiling?
A) G + H
B) J + H
C) C + E + J + H
D) C + E
Question
The graph below represents the market for alfalfa.The market price is $7.00 per bushel.Identify the areas representing consumer surplus,producer surplus,and economic surplus.
Question

Unlock Deck
Sign up to unlock the cards in this deck!
Unlock Deck
Unlock Deck
1/138
Play
Full screen (f)
Deck 4: Economic Efficiency, government Price Setting, and Taxes
1
The difference between the ________ for a good and the ________ is called consumer surplus.
A) highest price a consumer is willing to pay; lowest price a consumer is willing to pay
B) lowest price a consumer is willing to pay; price the consumer actually pays
C) highest price a consumer is willing to pay; price the consumer actually pays
D) price the consumer actually pays; actual cost to the producer
highest price a consumer is willing to pay; price the consumer actually pays
2
Juanita goes to the Hardware Emporium to buy a new circular saw. She is willing to pay $120 for a new saw,but buys one on sale for $85. Juanita's consumer surplus from the purchase is
A) $35.
B) $85.
C) $120.
D) $205.
A) $35.
B) $85.
C) $120.
D) $205.
$35.
3
The additional cost to a firm of producing one more unit of a good or service is the
A) minimum cost.
B) total cost.
C) opportunity cost.
D) marginal cost.
A) minimum cost.
B) total cost.
C) opportunity cost.
D) marginal cost.
marginal cost.
4
New York City has about two million apartments.Of this number
A) all are subject to rent control.
B) about one-half are subject to rent control.
C) all are subject to price floors.
D) about 10 percent are subject to rent control.
A) all are subject to rent control.
B) about one-half are subject to rent control.
C) all are subject to price floors.
D) about 10 percent are subject to rent control.
Unlock Deck
Unlock for access to all 138 flashcards in this deck.
Unlock Deck
k this deck
5
Table 4-1
Refer to Table 4-1. The table above lists the highest prices three consumers,Curly,Moe,and Larry,are willing to pay for a bottle of champagne. If the price of one of the bottles is $24 dollars
A) Curly will buy two bottles, Moe will buy one bottle and Larry will buy no bottles.
B) Curly will receive $26 of consumer surplus from buying one bottle.
C) Curly and Moe receive a total of $80 of consumer surplus from buying one bottle each. Larry will buy no bottles.
D) Larry will receive $15 of consumer surplus since he will buy no bottles.
Unlock Deck
Unlock for access to all 138 flashcards in this deck.
Unlock Deck
k this deck
6
Which of the following statements best describes the concept of consumer surplus?
A) "I paid $89 for a microwave oven last week. This week the same store is selling the same microwave oven for $69."
B) "I sold my hard copy of Harry Potter and the Half-Blood Prince to a used book store for $10 even though I was willing to sell it for $5."
C) "Target was having a sale on tube socks so I bought 5 pairs."
D) "I was going to pay $200 for new sunglasses that I had seen at the Oakley store but I ended up paying only $140 for the same sunglasses."
Unlock Deck
Unlock for access to all 138 flashcards in this deck.
Unlock Deck
k this deck
7
Which of the following statements is not true?
A) Consumer surplus measures the difference between the highest price a consumer is willing to pay for a product and the price she actually pays.
B) Marginal benefit is the additional benefit to a consumer from consuming one more unit of a product.
C) Consumer surplus measures the net benefit from participating in a market.
D) Producer surplus measures the total benefit received by producers from participating in a market.
Unlock Deck
Unlock for access to all 138 flashcards in this deck.
Unlock Deck
k this deck
8
Suppose there are two cities that have rent controlled apartments. In one city (Albany)all apartments are subject to rent control; in the other city (Halftrack)one-half of the apartments are rent controlled. Which of the following is most likely to be true?
A) It will be difficult to find a rent-controlled apartment in Albany or Halftrack; rents for the Halftrack apartments not subject to controls will be higher than they would be without rent control.
B) It will be easier to find an affordable apartment in Albany since rents will be low across the board.
C) It will be easier to find an affordable apartment in Halftrack, either a rent-controlled apartment or another apartment, at a reasonable price.
D) It will be impossible to rent an apartment in either city at any price.
Unlock Deck
Unlock for access to all 138 flashcards in this deck.
Unlock Deck
k this deck
9
Table 4-2
Refer to Table 4-2. The table above lists the marginal cost of polo shirts by Marko's,a firm that specializes in producing men's clothing. If the market price of Marko's polo shirts is $18
A) Marko's will produce four shirts.
B) producer surplus from the first shirt is $18.
C) producer surplus will equal $22.
D) there will be a surplus; as a result, the price will fall to $7.
Unlock Deck
Unlock for access to all 138 flashcards in this deck.
Unlock Deck
k this deck
10
A consumer is willing to purchase a product up to the point where
A) he spends all of his income.
B) the marginal benefit is equal to the price of the product.
C) the quantity demanded is equal to the quantity supplied.
D) he is indifferent between consuming and saving.
A) he spends all of his income.
B) the marginal benefit is equal to the price of the product.
C) the quantity demanded is equal to the quantity supplied.
D) he is indifferent between consuming and saving.
Unlock Deck
Unlock for access to all 138 flashcards in this deck.
Unlock Deck
k this deck
11
A supply curve shows
A) the quantities sold at different prices.
B) the marginal cost of producing one more unit of a good or service.
C) the marginal benefit from buying one more unit of a good or service.
D) the total cost of producing different quantities of a good or service.
A) the quantities sold at different prices.
B) the marginal cost of producing one more unit of a good or service.
C) the marginal benefit from buying one more unit of a good or service.
D) the total cost of producing different quantities of a good or service.
Unlock Deck
Unlock for access to all 138 flashcards in this deck.
Unlock Deck
k this deck
12
The additional benefit to a consumer from consuming one more unit of a good or service
A) is equal to consumer surplus.
B) is equal to the opportunity cost of consuming the good or service.
C) is equal to marginal benefit.
D) is equal to economic surplus.
A) is equal to consumer surplus.
B) is equal to the opportunity cost of consuming the good or service.
C) is equal to marginal benefit.
D) is equal to economic surplus.
Unlock Deck
Unlock for access to all 138 flashcards in this deck.
Unlock Deck
k this deck
13
Table 4-1
Refer to Table 4-1. The table above lists the highest prices three consumers,Curly,Moe,and Larry,are willing to pay for a bottle of champagne. If the price of the champagne falls from $24 to $14
A) consumer surplus increases from $32 to $53.
B) Curly will buy four bottles; Moe will buy two bottles, and Larry will buy one bottle.
C) consumer surplus will increase from $80 to $95.
D) Larry and Moe will receive more consumer surplus than Curly.
Unlock Deck
Unlock for access to all 138 flashcards in this deck.
Unlock Deck
k this deck
14
Each point on a demand curve shows
A) the willingness of consumers to purchase a product at different prices.
B) the consumer surplus received from purchasing a given quantity of a product.
C) the economic surplus received from purchasing a given quantity of a product.
D) the legally determined maximum price that sellers may charge for a given quantity of a product.
Unlock Deck
Unlock for access to all 138 flashcards in this deck.
Unlock Deck
k this deck
15
The maximum price that a buyer is willing to pay for a good measures his
A) consumer surplus.
B) marginal benefit.
C) willingness to pay.
D) producer surplus.
A) consumer surplus.
B) marginal benefit.
C) willingness to pay.
D) producer surplus.
Unlock Deck
Unlock for access to all 138 flashcards in this deck.
Unlock Deck
k this deck
16
The area above the market supply curve and below the market price
A) is equal to the total amount of producer surplus in a market.
B) is equal to the marginal cost of the last unit produced.
C) is equal to the total amount of economic surplus in a market.
D) is equal to the total cost of production.
A) is equal to the total amount of producer surplus in a market.
B) is equal to the marginal cost of the last unit produced.
C) is equal to the total amount of economic surplus in a market.
D) is equal to the total cost of production.
Unlock Deck
Unlock for access to all 138 flashcards in this deck.
Unlock Deck
k this deck
17
Brett buys a new cell phone for $100. He receives consumer surplus of $80 from the purchase. How much does Brett value his cell phone?
A) $180
B) $100
C) $80
D) $20
A) $180
B) $100
C) $80
D) $20
Unlock Deck
Unlock for access to all 138 flashcards in this deck.
Unlock Deck
k this deck
18
Consumer surplus in a market for a product would be equal to the area under the demand curve if
A) producer surplus was equal to zero.
B) marginal cost was equal to the market price.
C) the product was produced in a perfectly competitive market.
D) the market price was zero.
A) producer surplus was equal to zero.
B) marginal cost was equal to the market price.
C) the product was produced in a perfectly competitive market.
D) the market price was zero.
Unlock Deck
Unlock for access to all 138 flashcards in this deck.
Unlock Deck
k this deck
19
Table 4-2
Refer to Table 4-2.The table above lists the marginal cost of polo shirts by Marko's,a firm that specializes in producing men's clothing. If the price of polo shirts increases from $15 to $20
A) consumers will buy no polo shirts.
B) the marginal cost of producing the third polo shirt will increase to $20.
C) producer surplus will rise from $13 to $28.
D) there will be a surplus of polo shirts.
Unlock Deck
Unlock for access to all 138 flashcards in this deck.
Unlock Deck
k this deck
20
The area above the market supply curve and below the market price is equal to the
A) consumer surplus.
B) producer surplus.
C) marginal benefit.
D) marginal cost.
A) consumer surplus.
B) producer surplus.
C) marginal benefit.
D) marginal cost.
Unlock Deck
Unlock for access to all 138 flashcards in this deck.
Unlock Deck
k this deck
21
Figure 4-1
Figure 4-1 shows Kendra's demand for ice-cream cones curve.
Suppliers will be willing to supply a product in all of the following situations except
A) the price received is greater than the additional cost of producing the product.
B) the price received is at least equal to the additional cost of producing the product.
C) the price received is equal to the additional cost of producing the product.
D) the price received is less than the additional cost of producing the product.
Unlock Deck
Unlock for access to all 138 flashcards in this deck.
Unlock Deck
k this deck
22
The additional cost to a firm of producing one more unit of a good or service is equal to producer surplus.
Unlock Deck
Unlock for access to all 138 flashcards in this deck.
Unlock Deck
k this deck
23
Figure 4-1
Figure 4-1 shows Kendra's demand for ice-cream cones curve.
Refer to Figure 4-1. If the market price is $2.50,what is Kendra's consumer surplus?
A) $9.00
B) $7.50
C) $1.50
D) $0
Figure 4-1 shows Kendra's demand for ice-cream cones curve.
Refer to Figure 4-1. If the market price is $2.50,what is Kendra's consumer surplus?
A) $9.00
B) $7.50
C) $1.50
D) $0
Unlock Deck
Unlock for access to all 138 flashcards in this deck.
Unlock Deck
k this deck
24
Figure 4-2
Refer to Figure 4-2.What area represents the decrease in producer surplus when the market price falls from P₂ to P₁?
A) C + E
B) A + C + E
C) A + B
D) B + D
Refer to Figure 4-2.What area represents the decrease in producer surplus when the market price falls from P₂ to P₁?
A) C + E
B) A + C + E
C) A + B
D) B + D
Unlock Deck
Unlock for access to all 138 flashcards in this deck.
Unlock Deck
k this deck
25
What is consumer surplus? Why would policy makers be interested in consumer surplus?
Unlock Deck
Unlock for access to all 138 flashcards in this deck.
Unlock Deck
k this deck
26
When the marginal benefit equals the marginal cost of the last unit sold in a competitive market
A) the net benefit of consumers is equal to the net benefit of producers.
B) an economically efficient level of output is produced.
C) producer surplus is equal to consumer surplus.
D) total benefit is equal to total cost.
A) the net benefit of consumers is equal to the net benefit of producers.
B) an economically efficient level of output is produced.
C) producer surplus is equal to consumer surplus.
D) total benefit is equal to total cost.
Unlock Deck
Unlock for access to all 138 flashcards in this deck.
Unlock Deck
k this deck
27
Figure 4-1
Figure 4-1 shows Kendra's demand for ice-cream cones curve.
Refer to Figure 4-1.If the market price is $2.50,what is the maximum number of ice cream cones that Kendra will buy?
A) 1
B) 2
C) 3
D) 4
Figure 4-1 shows Kendra's demand for ice-cream cones curve.
Refer to Figure 4-1.If the market price is $2.50,what is the maximum number of ice cream cones that Kendra will buy?
A) 1
B) 2
C) 3
D) 4
Unlock Deck
Unlock for access to all 138 flashcards in this deck.
Unlock Deck
k this deck
28
Figure 4-3
Figure 4-3 shows the market for granola. The market is initially in equilibrium at a price of P₁ and a quantity of Q₁. Now suppose producers decide to cut output to Q₂ in order to raise the price to P₂.
Refer to Figure 4-3.What area represents consumer surplus at P₂?
A) A
B) A + B
C) B + C
D) A + B + D + F
Unlock Deck
Unlock for access to all 138 flashcards in this deck.
Unlock Deck
k this deck
29
Figure 4-1
Figure 4-1 shows Kendra's demand for ice-cream cones curve.
Refer to Figure 4-1. What is the total amount that Kendra is willing to pay for 3 ice cream cones?
A) $2.50
B) $7.50
C) $9.00
D) $13.50
Figure 4-1 shows Kendra's demand for ice-cream cones curve.
Refer to Figure 4-1. What is the total amount that Kendra is willing to pay for 3 ice cream cones?
A) $2.50
B) $7.50
C) $9.00
D) $13.50
Unlock Deck
Unlock for access to all 138 flashcards in this deck.
Unlock Deck
k this deck
30
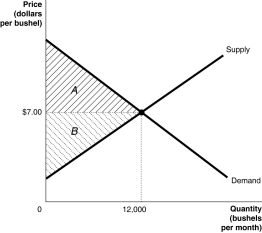
Assume the market price for tangerines is $18.00 per bushel.At the market price,tangerine growers are willing to supply a quantity of 12,000 bushels per week.The quantity supplied drops to zero when the price falls to $5.00 per bushel.Construct a graph showing this data,calculate the total producer surplus in the market for tangerines,and show the total producer surplus on the graph.
Unlock Deck
Unlock for access to all 138 flashcards in this deck.
Unlock Deck
k this deck
31
The total amount of producer surplus in a market is equal to the area above the market supply curve and below the market price.
Unlock Deck
Unlock for access to all 138 flashcards in this deck.
Unlock Deck
k this deck
32
The market price for coffee is $2.25 per cup.Austin is willing to pay $5.00 per cup,Colin is willing to pay $4.00 per cup,Lucy is willing to pay $3.00 per cup,and Ike is willing to pay $2.00 per cup.Construct a graph showing the consumer surplus for each cup of coffee purchased.How many cups of coffee will be purchased? What is the value of the consumer surplus each of the four consumers receives from their coffee purchases?
Unlock Deck
Unlock for access to all 138 flashcards in this deck.
Unlock Deck
k this deck
33
Figure 4-1
Figure 4-1 shows Kendra's demand for ice-cream cones curve.
Refer to Figure 4-1. If the market price is $2.50,what is the consumer surplus on the second ice cream cone?
A) $0.50
B) $1.50
C) $3.00
D) $10.50
Figure 4-1 shows Kendra's demand for ice-cream cones curve.
Refer to Figure 4-1. If the market price is $2.50,what is the consumer surplus on the second ice cream cone?
A) $0.50
B) $1.50
C) $3.00
D) $10.50
Unlock Deck
Unlock for access to all 138 flashcards in this deck.
Unlock Deck
k this deck
34
Two economists from Northwestern University estimated the benefit households received from subscribing to broadband Internet service. They found that in 2006,47 million consumers paid an average of $36 per month to subscribe to a broadband Internet service,and estimated the value of total consumer surplus for these subscribers was equal to $890.5 million.Based on these numbers,what was the average monthly consumer surplus per subscriber for broadband Internet service?
A) $0.05
B) $0.77
C) $13.06
D) $18.95
A) $0.05
B) $0.77
C) $13.06
D) $18.95
Unlock Deck
Unlock for access to all 138 flashcards in this deck.
Unlock Deck
k this deck
35
Figure 4-2
Refer to Figure 4-2.What area represents producer surplus at a price of P₁?
A) C
B) A + C
C) C + E
D) A + C + E
Refer to Figure 4-2.What area represents producer surplus at a price of P₁?
A) C
B) A + C
C) C + E
D) A + C + E
Unlock Deck
Unlock for access to all 138 flashcards in this deck.
Unlock Deck
k this deck
36
Producer surplus is the difference between the highest price someone is willing to pay and the price he actually pays.
Unlock Deck
Unlock for access to all 138 flashcards in this deck.
Unlock Deck
k this deck
37
The willingness of consumers to buy a product at different prices is shown on a
A) demand curve.
B) supply curve.
C) production possibilities frontier.
D) marginal cost curve.
A) demand curve.
B) supply curve.
C) production possibilities frontier.
D) marginal cost curve.
Unlock Deck
Unlock for access to all 138 flashcards in this deck.
Unlock Deck
k this deck
38
Figure 4-1
Figure 4-1 shows Kendra's demand for ice-cream cones curve.
The difference between the lowest price a firm would have been willing to accept and the price it actually receives from the sale of a product is called
A) producer surplus.
B) profit.
C) marginal revenue.
D) price differential.
Figure 4-1 shows Kendra's demand for ice-cream cones curve.
The difference between the lowest price a firm would have been willing to accept and the price it actually receives from the sale of a product is called
A) producer surplus.
B) profit.
C) marginal revenue.
D) price differential.
Unlock Deck
Unlock for access to all 138 flashcards in this deck.
Unlock Deck
k this deck
39
In a competitive market equilibrium the ________ equals the ________ of the last unit sold.
A) total profit; marginal benefit
B) total cost; marginal cost
C) profit; selling price
D) marginal benefit; marginal cost
A) total profit; marginal benefit
B) total cost; marginal cost
C) profit; selling price
D) marginal benefit; marginal cost
Unlock Deck
Unlock for access to all 138 flashcards in this deck.
Unlock Deck
k this deck
40
Figure 4-1
Figure 4-1 shows Kendra's demand for ice-cream cones curve.
Refer to Figure 4-1.Kendra's marginal benefit from consuming the second ice cream cone is
A) $6.50
B) $6.00
C) $3.00
D) $2.25
Figure 4-1 shows Kendra's demand for ice-cream cones curve.
Refer to Figure 4-1.Kendra's marginal benefit from consuming the second ice cream cone is
A) $6.50
B) $6.00
C) $3.00
D) $2.25
Unlock Deck
Unlock for access to all 138 flashcards in this deck.
Unlock Deck
k this deck
41
Figure 4-3
Figure 4-3 shows the market for granola. The market is initially in equilibrium at a price of P₁ and a quantity of Q₁. Now suppose producers decide to cut output to Q₂ in order to raise the price to P₂.
Refer to Figure 4-3. What area represents the deadweight loss at P₂?
A) C + E + H
B) G + H
C) C + E
D) B + C
Unlock Deck
Unlock for access to all 138 flashcards in this deck.
Unlock Deck
k this deck
42
Figure 4-3
Figure 4-3 shows the market for granola. The market is initially in equilibrium at a price of P₁ and a quantity of Q₁. Now suppose producers decide to cut output to Q₂ in order to raise the price to P₂.
Refer to Figure 4-3. At the price P₂ consumers are willing to buy the Q₂ pounds of granola.Is this an economically efficient quantity?
A) No, the marginal benefit of the last unit (Q₂) exceeds the marginal cost of that last unit.
B) Yes, otherwise consumers would not buy Q₂ units.
C) Yes, because the price P₂ shows what consumers are willing to pay for the product.
D) No, the marginal cost of the last unit (Q₂) exceeds the marginal benefit of the last unit.
Unlock Deck
Unlock for access to all 138 flashcards in this deck.
Unlock Deck
k this deck
43
If,in a competitive market,marginal benefit is greater than marginal cost
A) the net benefit to consumers from participating in the market is greater than the net benefit to producers.
B) the government must force producers to lower price in order to achieve economic efficiency.
C) the quantity sold is greater than the equilibrium quantity.
D) the quantity sold is less than the equilibrium quantity.
Unlock Deck
Unlock for access to all 138 flashcards in this deck.
Unlock Deck
k this deck
44
Economic efficiency is achieved when there is a market outcome in which the marginal benefit to consumers of the last unit produced is equal to its marginal cost of production and
A) economic surplus plus consumer surplus equals producer surplus.
B) consumer surplus plus producer surplus is maximized.
C) economic surplus is minimized.
D) the difference between consumer surplus and producer surplus is maximized.
A) economic surplus plus consumer surplus equals producer surplus.
B) consumer surplus plus producer surplus is maximized.
C) economic surplus is minimized.
D) the difference between consumer surplus and producer surplus is maximized.
Unlock Deck
Unlock for access to all 138 flashcards in this deck.
Unlock Deck
k this deck
45
Economic surplus is maximized in a competitive market when
A) demand is equal to supply.
B) the deadweight loss equals the sum of consumer surplus and producer surplus.
C) marginal benefit equals marginal cost.
D) producers sell the quantity that consumers are willing to buy.
A) demand is equal to supply.
B) the deadweight loss equals the sum of consumer surplus and producer surplus.
C) marginal benefit equals marginal cost.
D) producers sell the quantity that consumers are willing to buy.
Unlock Deck
Unlock for access to all 138 flashcards in this deck.
Unlock Deck
k this deck
46
Deadweight loss refers to
A) the opportunity cost to firms from producing the equilibrium quantity in a competitive market.
B) the sum of consumer and producer surplus.
C) the loss of economic surplus when the marginal benefit equals the marginal cost of the last unit produced.
D) the reduction in economic surplus resulting from not being in competitive equilibrium.
Unlock Deck
Unlock for access to all 138 flashcards in this deck.
Unlock Deck
k this deck
47
Figure 4-3
Figure 4-3 shows the market for granola. The market is initially in equilibrium at a price of P₁ and a quantity of Q₁. Now suppose producers decide to cut output to Q₂ in order to raise the price to P₂.
Refer to Figure 4-3. What area represents producer surplus at P₂?
A) A + B + D
B) B + D
C) B + D + G
D) B + C + D + E
Unlock Deck
Unlock for access to all 138 flashcards in this deck.
Unlock Deck
k this deck
48
Equilibrium in a competitive market results in the greatest amount of economic surplus from the production of a good or service.
Unlock Deck
Unlock for access to all 138 flashcards in this deck.
Unlock Deck
k this deck
49
Figure 4-4
Refer to Figure 4-4. The figure above represents the market for iced tea.Assume that this is a competitive market. If the price of iced tea is $1
A) the quantity supplied is less than the economically efficient quantity.
B) the quantity supplied is economically efficient but the quantity demanded is economically inefficient.
C) economic surplus is maximized.
D) not enough consumers want to buy iced tea.
Unlock Deck
Unlock for access to all 138 flashcards in this deck.
Unlock Deck
k this deck
50
Figure 4-4
Refer to Figure 4-4. The figure above represents the market for iced tea. Assume that this is a competitive market. Which of the following is true?
A) If the price of iced tea is $3 the output will be economically efficient but there will be a deadweight loss.
B) If the price of iced tea is $3 consumers will purchase more than the economically efficient output.
C) Both 10,000 and 30,000 are economically inefficient rates of output.
D) If the price of iced tea is $3 producers will sell 30,000 units of iced tea but this output will be economically inefficient.
Unlock Deck
Unlock for access to all 138 flashcards in this deck.
Unlock Deck
k this deck
51
In a competitive market when there is no deadweight loss,
A) consumer surplus is minimized.
B) producer surplus is minimized.
C) consumer surplus plus producer surplus is minimized.
D) consumer surplus plus producer surplus is maximized.
A) consumer surplus is minimized.
B) producer surplus is minimized.
C) consumer surplus plus producer surplus is minimized.
D) consumer surplus plus producer surplus is maximized.
Unlock Deck
Unlock for access to all 138 flashcards in this deck.
Unlock Deck
k this deck
52
The sum of consumer surplus and producer surplus is equal to
A) the deadweight loss.
B) the economic surplus.
C) zero.
D) total profit.
A) the deadweight loss.
B) the economic surplus.
C) zero.
D) total profit.
Unlock Deck
Unlock for access to all 138 flashcards in this deck.
Unlock Deck
k this deck
53
There will be no deadweight loss if the marginal benefit to consumers is equal to the marginal cost of production and the sum of consumer surplus and producer surplus is maximized.
Unlock Deck
Unlock for access to all 138 flashcards in this deck.
Unlock Deck
k this deck
54
Figure 4-4
Refer to Figure 4-4. The figure above represents the market for iced tea. Assume that this is a competitive market. If 20,000 units of iced tea are sold
A) the deadweight loss is equal to economic surplus.
B) producer surplus equals consumer surplus.
C) the marginal benefit of each of the 20,000 units of iced tea equals $3.
D) marginal benefit is equal to marginal cost.
Unlock Deck
Unlock for access to all 138 flashcards in this deck.
Unlock Deck
k this deck
55
Figure 4-4
Refer to Figure 4-4. The figure above represents the market for iced tea. Assume that this is a competitive market. If the price of iced tea is $3,what changes in the market would result in an economically efficient output?
A) The price would decrease, the quantity supplied would increase, and the quantity demanded would decrease.
B) The quantity supplied would decrease, the quantity demanded would increase and the equilibrium price would decrease.
C) The price would decrease, the demand would increase and the supply would decrease.
D) The price would decrease, quantity demanded would increase and quantity supplied would decrease.
Unlock Deck
Unlock for access to all 138 flashcards in this deck.
Unlock Deck
k this deck
56
Figure 4-4
Refer to Figure 4-4. The figure above represents the market for iced tea. Assume that this is a competitive market.At a price of $3
A) the marginal cost of iced tea is greater than the marginal benefit; therefore, output is inefficiently low.
B) producers should lower the price to $1 in order to sell the quantity demanded of 10,000.
C) the marginal benefit of iced tea is greater than the marginal cost; therefore, output is inefficiently low.
D) the marginal benefit of iced tea is greater than the marginal cost; therefore, output is inefficiently high.
Unlock Deck
Unlock for access to all 138 flashcards in this deck.
Unlock Deck
k this deck
57
In a competitive market the ________ curve shows the marginal benefit received by consumers and the ________ curve shows the marginal cost to producers.
A) demand; supply
B) supply; demand
C) demand; market demand
D) supply; market supply
A) demand; supply
B) supply; demand
C) demand; market demand
D) supply; market supply
Unlock Deck
Unlock for access to all 138 flashcards in this deck.
Unlock Deck
k this deck
58
________ is defined as a market outcome in which the marginal benefit to consumers of the last unit produced is equal to the marginal cost of production,and in which the sum of consumer surplus and producer surplus is at a maximum.
A) Economic efficiency
B) Consumer efficiency
C) Producer efficiency
D) Deadweight efficiency
A) Economic efficiency
B) Consumer efficiency
C) Producer efficiency
D) Deadweight efficiency
Unlock Deck
Unlock for access to all 138 flashcards in this deck.
Unlock Deck
k this deck
59
What is deadweight loss? When is deadweight loss equal to zero?
Unlock Deck
Unlock for access to all 138 flashcards in this deck.
Unlock Deck
k this deck
60
The difference between consumer surplus and producer surplus in a market is equal to the deadweight loss.
Unlock Deck
Unlock for access to all 138 flashcards in this deck.
Unlock Deck
k this deck
61
The minimum wage is an example of
A) a subsidy for low-skilled workers.
B) a price floor.
C) a price ceiling.
D) a black market.
A) a subsidy for low-skilled workers.
B) a price floor.
C) a price ceiling.
D) a black market.
Unlock Deck
Unlock for access to all 138 flashcards in this deck.
Unlock Deck
k this deck
62
When ________ in a market,the total net benefit to society is maximized.
A) deadweight loss is maximized
B) a competitive equilibrium is achieved
C) consumer surplus is minimized
D) producer surplus is minimized
A) deadweight loss is maximized
B) a competitive equilibrium is achieved
C) consumer surplus is minimized
D) producer surplus is minimized
Unlock Deck
Unlock for access to all 138 flashcards in this deck.
Unlock Deck
k this deck
63
The graph below represents the market for alfalfa.The equilibrium price is $7.00 per bushel,but the market price is $9.00 per bushel. Identify the areas representing consumer surplus,producer surplus,and deadweight loss at the equilibrium price of $7.00 and at the market price of $9.00.
Unlock Deck
Unlock for access to all 138 flashcards in this deck.
Unlock Deck
k this deck
64
Which term refers to a legally established maximum price that firms may charge?
A) a price ceiling
B) a subsidy
C) a price floor
D) a tariff
A) a price ceiling
B) a subsidy
C) a price floor
D) a tariff
Unlock Deck
Unlock for access to all 138 flashcards in this deck.
Unlock Deck
k this deck
65
A black market is a market where buying and selling take place
A) at prices that violate government price regulations.
B) in non-licensed shops and warehouses.
C) after regular office hours.
D) on foreign soil.
A) at prices that violate government price regulations.
B) in non-licensed shops and warehouses.
C) after regular office hours.
D) on foreign soil.
Unlock Deck
Unlock for access to all 138 flashcards in this deck.
Unlock Deck
k this deck
66
Table 4-3
Table 4-3 shows the demand and supply schedules for the low-skilled labor market in the city of Westover.
Refer to Table 4-3.If a minimum wage of $9.50 an hour is mandated,what is the quantity of labor demanded?
A) 380,000
B) 370,000
C) 360,000
D) 10,000
Table 4-3 shows the demand and supply schedules for the low-skilled labor market in the city of Westover.
Refer to Table 4-3.If a minimum wage of $9.50 an hour is mandated,what is the quantity of labor demanded?
A) 380,000
B) 370,000
C) 360,000
D) 10,000
Unlock Deck
Unlock for access to all 138 flashcards in this deck.
Unlock Deck
k this deck
67
Table 4-3
Table 4-3 shows the demand and supply schedules for the low-skilled labor market in the city of Westover.
Refer to Table 4-3.What is the equilibrium hourly wage (W*)and the equilibrium quantity of labor (Q*)?
A) W* = $9.00; Q* = 370,000
B) W* = $8.50; Q* = 380,000
C) W* = $8.50; Q* = 360,000
D) W* = $9.00; Q* = 740,000
Unlock Deck
Unlock for access to all 138 flashcards in this deck.
Unlock Deck
k this deck
68
Table 4-3
Table 4-3 shows the demand and supply schedules for the low-skilled labor market in the city of Westover.
Refer to Table 4-3.If a minimum wage of $9.50 an hour is mandated,what is the quantity of labor supplied?
A) 390,000
B) 380,000
C) 370,000
D) 340,000
Table 4-3 shows the demand and supply schedules for the low-skilled labor market in the city of Westover.
Refer to Table 4-3.If a minimum wage of $9.50 an hour is mandated,what is the quantity of labor supplied?
A) 390,000
B) 380,000
C) 370,000
D) 340,000
Unlock Deck
Unlock for access to all 138 flashcards in this deck.
Unlock Deck
k this deck
69
Figure 4-5
Figure 4-5 shows the market for apartments in Bay City. Recently, the government imposed a rent ceiling at R₀.
Refer to Figure 4-5. What is the area that represents consumer surplus after the imposition of the ceiling?
A) A + B+ D
B) A + B + C
C) A + B + D + F
D) A + B + D + F + G
Figure 4-5 shows the market for apartments in Bay City. Recently, the government imposed a rent ceiling at R₀.
Refer to Figure 4-5. What is the area that represents consumer surplus after the imposition of the ceiling?
A) A + B+ D
B) A + B + C
C) A + B + D + F
D) A + B + D + F + G
Unlock Deck
Unlock for access to all 138 flashcards in this deck.
Unlock Deck
k this deck
70
Figure 4-5
Figure 4-5 shows the market for apartments in Bay City. Recently, the government imposed a rent ceiling at R₀.
Refer to Figure 4-5. What is the area that represents the producer surplus after the imposition of the ceiling?
A) F + G
B) F
C) D + F + G
D) A + B + D + F + G
Figure 4-5 shows the market for apartments in Bay City. Recently, the government imposed a rent ceiling at R₀.
Refer to Figure 4-5. What is the area that represents the producer surplus after the imposition of the ceiling?
A) F + G
B) F
C) D + F + G
D) A + B + D + F + G
Unlock Deck
Unlock for access to all 138 flashcards in this deck.
Unlock Deck
k this deck
71
To affect the market outcome,a price floor
A) must be set above the black market price.
B) must be set above the legal price.
C) must be set above the price ceiling.
D) must be set above the equilibrium price.
A) must be set above the black market price.
B) must be set above the legal price.
C) must be set above the price ceiling.
D) must be set above the equilibrium price.
Unlock Deck
Unlock for access to all 138 flashcards in this deck.
Unlock Deck
k this deck
72
Figure 4-5
Figure 4-5 shows the market for apartments in Bay City. Recently, the government imposed a rent ceiling at R₀.
Refer to Figure 4-5. With rent control,the quantity supplied is Q₁. Suppose apartment owners ignore the law and rent this quantity for the highest rent they can get. What is the highest rent they can get?
A) R*
B) R₁
C) R₀
D) more than R₁
Unlock Deck
Unlock for access to all 138 flashcards in this deck.
Unlock Deck
k this deck
73
Table 4-3
Table 4-3 shows the demand and supply schedules for the low-skilled labor market in the city of Westover.
Refer to Table 4-3.Suppose that the quantity of labor demanded increases by 40,000 at each wage level.What are the new free market equilibrium hourly wage and the new equilibrium quantity of labor?
A) W = $10.00; Q = 390,000
B) W = $9.50; Q = 380,000
C) W = $8.50; Q = 380,000
D) W = $8.00; Q = 390,000
Unlock Deck
Unlock for access to all 138 flashcards in this deck.
Unlock Deck
k this deck
74
Figure 4-5
Figure 4-5 shows the market for apartments in Bay City. Recently, the government imposed a rent ceiling at R₀.
Refer to Figure 4-5. What is the area that represents the portion of producer surplus transferred to consumers as a result of the rent ceiling?
A) D + E
B) D + F
C) D
D) F
Figure 4-5 shows the market for apartments in Bay City. Recently, the government imposed a rent ceiling at R₀.
Refer to Figure 4-5. What is the area that represents the portion of producer surplus transferred to consumers as a result of the rent ceiling?
A) D + E
B) D + F
C) D
D) F
Unlock Deck
Unlock for access to all 138 flashcards in this deck.
Unlock Deck
k this deck
75
In order to be binding a price floor
A) must lie above the free market equilibrium price.
B) must lie below the free market equilibrium price.
C) must coincide with the free market equilibrium price.
D) must be high enough for firms to earn a profit.
A) must lie above the free market equilibrium price.
B) must lie below the free market equilibrium price.
C) must coincide with the free market equilibrium price.
D) must be high enough for firms to earn a profit.
Unlock Deck
Unlock for access to all 138 flashcards in this deck.
Unlock Deck
k this deck
76
Government intervention in agricultural markets in the U.S.began
A) during World War II to ensure that enough food was available for domestic consumption.
B) after World War I in order to assist farmers to adjust from a war-time economy to a peace-time economy.
C) during the Great Depression.
D) during the Korean War.
A) during World War II to ensure that enough food was available for domestic consumption.
B) after World War I in order to assist farmers to adjust from a war-time economy to a peace-time economy.
C) during the Great Depression.
D) during the Korean War.
Unlock Deck
Unlock for access to all 138 flashcards in this deck.
Unlock Deck
k this deck
77
Table 4-3
Table 4-3 shows the demand and supply schedules for the low-skilled labor market in the city of Westover.
Refer to Table 4-3. If a minimum wage of $9.50 is mandated there will be a
A) shortage of 10,000 units of labor.
B) surplus of 10,000 units of labor.
C) shortage of 20,000 units of labor.
D) surplus of 20,000 units of labor.
Unlock Deck
Unlock for access to all 138 flashcards in this deck.
Unlock Deck
k this deck
78
Figure 4-5
Figure 4-5 shows the market for apartments in Bay City. Recently, the government imposed a rent ceiling at R₀.
Refer to Figure 4-5. What area represents the deadweight loss after the imposition of the ceiling?
A) G + H
B) J + H
C) C + E + J + H
D) C + E
Figure 4-5 shows the market for apartments in Bay City. Recently, the government imposed a rent ceiling at R₀.
Refer to Figure 4-5. What area represents the deadweight loss after the imposition of the ceiling?
A) G + H
B) J + H
C) C + E + J + H
D) C + E
Unlock Deck
Unlock for access to all 138 flashcards in this deck.
Unlock Deck
k this deck
79
The graph below represents the market for alfalfa.The market price is $7.00 per bushel.Identify the areas representing consumer surplus,producer surplus,and economic surplus.
Unlock Deck
Unlock for access to all 138 flashcards in this deck.
Unlock Deck
k this deck
80
Which of the following is a consequence of minimum wage laws?
A) Low skilled workers benefit because minimum wage increases the number of jobs providing low skilled workers with training.
B) Employers will be reluctant to offer low-skill workers jobs with training.
C) Producers have an incentive to offer workers non-wage benefits such as health care benefits and convenient working hours rather than a higher wage.
D) All workers benefit when the minimum wage is increased.
Unlock Deck
Unlock for access to all 138 flashcards in this deck.
Unlock Deck
k this deck
Unlock Deck
Unlock for access to all 138 flashcards in this deck.


