Deck 9: Aggregate Expenditure and Aggregate Demand
Full screen (f)
Question
Question
Question
Question
Question
Question
Question
Question
Question
Question
Question
Question
Question
Question
Question
Question
Question
Question
Question
Question
Question
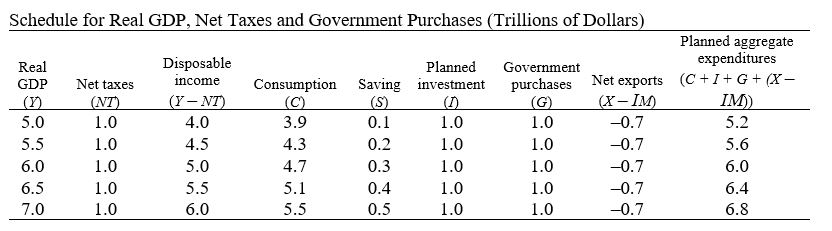
Refer to the table in the exhibit.Which of the following groups is considered autonomous with respect to income?
A) S, I, G, (X - IM)
B) NT, C, G, (X - IM)
C) NT, S, I, (X - IM)
D) I, G, X
Question
Refer to the table in the exhibit.What is the state of the government's budget?
A) The government's budget has a deficit of $2 trillion.
B) The government's budget has a deficit of $1 trillion.
C) The government's budget is balanced.
D) The government's budget has a surplus of $1 trillion.
Question
Question
Refer to the table in the exhibit, where S + NT = I + G + (X - IM).What does this equal?
A) $1.1 trillion
B) $1.2 trillion
C) $1.3 trillion
D) $1.4 trillion
Question
Question
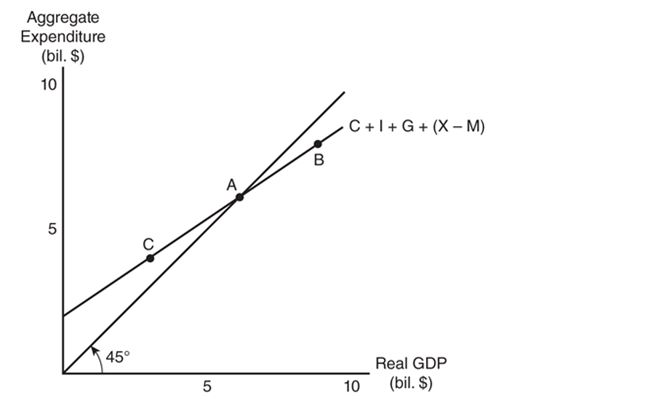
Refer to the graph in the exhibit.Which of the following best describes the situation at point C?
A) Consumption expenditures exceed disposable income.
B) Real GDP exceeds aggregate expenditure.
C) Aggregate expenditure is exactly equal to real GDP.
D) Aggregate expenditure exceeds real GDP.
Question
Question
Refer to the table in the exhibit.At the equilibrium level of GDP, what do injections equal?
A) $1.0 trillion
B) $1.3 trillion
C) $1.4 trillion
D) $1.5 trillion
Question
Refer to the table in the exhibit.What is the equilibrium level of GDP?
A) $5.0 trillion
B) $5.5 trillion
C) $6.0 trillion
D) $6.5 trillion
Question
Question
Refer to the table in the exhibit.What does the marginal propensity to consume (MPC) equal?
A) 0.20, or 1/5
B) 0.40, or 2/5
C) 0.80, or 4/5
D) 0.90, or 9/10
Question
Question
Refer to the table in the exhibit.At the equilibrium level of GDP, what does saving equal?
A) $0.3 trillion
B) $0.4 trillion
C) $0.5 trillion
D) $0.6 trillion
Question
Question
Question
Question
Refer to the table in the exhibit.What does the marginal propensity to save (MPS) equal?
A) 0.80, or 4/5
B) 0.60, or 3/5
C) 0.40, or 2/5
D) 0.20, or 1/5
Question
Refer to the table in the exhibit.At the equilibrium level of GDP, what do leakages equal?
A) $1.4 trillion
B) $1.3 trillion
C) $1.1 trillion
D) $1.0 trillion
Question
Question
Question
Question
Question
Question
Question
Refer to the graph in the exhibit.Which of the following best describes the situation at point C?
A) Consumption expenditures exceed disposable income.
B) Producers are experiencing an unexpected loss in inventory.
C) Aggregate expenditure is exactly equal to real GDP.
D) Real GDP exceeds aggregate expenditure.
Question
Question
Question
Question
Question
Question
Question
Question
Question
Question
Question
Question
Question
Question
Question
Question
Question
Question
Question
Question
Question
Question
Question
Question
Question
Refer to the graph in the exhibit.Assume the economy is in equilibrium with real GDP of $5 trillion.Suppose aggregate expenditure increases by $1 trillion.How would the economy's equilibrium real GDP most likely be affected?
A) It would increase by more than $1 trillion.
B) It would increase by $1 trillion.
C) It would increase by less than $1 trillion.
D) It would decrease by $1 trillion.
Question
Question
Question
Question
Question
Question
Question
Question
Question
Question

Unlock Deck
Sign up to unlock the cards in this deck!
Unlock Deck
Unlock Deck
1/147
Play
Full screen (f)
Deck 9: Aggregate Expenditure and Aggregate Demand
1
Suppose business managers become more pessimistic about future sales and profits.How will this affect the autonomous investment function?
A) It will create a rightward movement along the autonomous investment function.
B) It will create a leftward movement along the autonomous investment function.
C) It will create an upward shift of the autonomous investment function.
D) It will create a downward shift of the autonomous investment function.
It will create a downward shift of the autonomous investment function.
2
How do households use disposable income?
A) to consume and save
B) to consume and invest
C) to save and invest
D) to consume, save, and pay taxes
A) to consume and save
B) to consume and invest
C) to save and invest
D) to consume, save, and pay taxes
to consume and save
3
Historically, what has happened to consumption spending in Canada as a percentage of income?
A) Consumption spending in Canada as a percentage of income has increased.
B) Consumption spending in Canada as a percentage of income has remained approximately the same.
C) Consumption spending in Canada as a percentage of income has decreased.
D) Consumption spending in Canada as a percentage of income has increased more than income.
Consumption spending in Canada as a percentage of income has remained approximately the same.
4
To simplify the aggregate expenditure model, what must be assumed?
A) that there is no consumption
B) that there are no government purchases
C) that there is no net private investment
D) that there is no capital depreciation and no business saving
A) that there is no consumption
B) that there are no government purchases
C) that there is no net private investment
D) that there is no capital depreciation and no business saving
Unlock Deck
Unlock for access to all 147 flashcards in this deck.
Unlock Deck
k this deck
5
What is the marginal propensity to consume?
A) It is the decrease in disposable income that occurs as a result of an increase in consumption.
B) It is the increase in disposable income that occurs as a result of an increase in consumption.
C) It is the decrease in consumption that occurs as a result of an increase in disposable income.
D) It is the increase in consumption that occurs as a result of an increase in disposable income.
Unlock Deck
Unlock for access to all 147 flashcards in this deck.
Unlock Deck
k this deck
6
Suppose autonomous investment is measured on the vertical axis and disposable income is measured on the horizontal axis.What does the graph look like?
A) a horizontal line
B) a vertical line
C) an upward-sloping line
D) a downward-sloping line
A) a horizontal line
B) a vertical line
C) an upward-sloping line
D) a downward-sloping line
Unlock Deck
Unlock for access to all 147 flashcards in this deck.
Unlock Deck
k this deck
7
How is a household's net wealth calculated?
A) as the household's current income minus the value of its liabilities
B) as the household's assets minus its tax liabilities
C) as the household's assets minus its liabilities
D) as the household's assets minus its income
A) as the household's current income minus the value of its liabilities
B) as the household's assets minus its tax liabilities
C) as the household's assets minus its liabilities
D) as the household's assets minus its income
Unlock Deck
Unlock for access to all 147 flashcards in this deck.
Unlock Deck
k this deck
8
Which of the following is NOT a characteristic of the government purchase function?
A) Government purchases are autonomous with respect to current income.
B) Government purchases exclude transfer payments.
C) Government purchases are directly related to government income.
D) Government purchases have increased over the last 40 years.
A) Government purchases are autonomous with respect to current income.
B) Government purchases exclude transfer payments.
C) Government purchases are directly related to government income.
D) Government purchases have increased over the last 40 years.
Unlock Deck
Unlock for access to all 147 flashcards in this deck.
Unlock Deck
k this deck
9
As disposable income increases, how is consumption spending affected?
A) Consumption spending increases by the same amount as disposable income increases.
B) Consumption spending decreases by the same amount as disposable income increases.
C) Consumption spending increases by less than the increase in disposable income.
D) Consumption spending decreases by less than the increase in disposable income.
Unlock Deck
Unlock for access to all 147 flashcards in this deck.
Unlock Deck
k this deck
10
A grocery store manager must decide whether to buy four carpet-cleaning machines so that the store can rent them to customers.The manager estimates that the first machine would yield an income of $200 per year, the second $150, the third $75, and the fourth $20.Suppose the interest rate is 12 percent and each machine costs $500.How many carpet-cleaning machines should the manager buy?
A) none
B) one
C) two
D) three
A) none
B) one
C) two
D) three
Unlock Deck
Unlock for access to all 147 flashcards in this deck.
Unlock Deck
k this deck
11
What do economists assume is the fundamental motive of investors?
A) to maximize profit
B) to maximize income
C) to maximize the firm's growth
D) to maximize savings
A) to maximize profit
B) to maximize income
C) to maximize the firm's growth
D) to maximize savings
Unlock Deck
Unlock for access to all 147 flashcards in this deck.
Unlock Deck
k this deck
12
What is the most important determinant of a household's consumption spending?
A) its disposable income
B) its total wealth
C) the number of persons in the household
D) its net wealth
A) its disposable income
B) its total wealth
C) the number of persons in the household
D) its net wealth
Unlock Deck
Unlock for access to all 147 flashcards in this deck.
Unlock Deck
k this deck
13
A grocery store manager must decide whether to buy a carpet-cleaning machine so that the store can rent it to customers.The machine costs $800.It is expected to yield $200 in income per year.What is the expected annual return from the carpet-cleaning machine?
A) 25 percent
B) 50 percent
C) 75 percent
D) 400 percent
A) 25 percent
B) 50 percent
C) 75 percent
D) 400 percent
Unlock Deck
Unlock for access to all 147 flashcards in this deck.
Unlock Deck
k this deck
14
-Refer to the table in the exhibit.What is the relationship between exports and imports?
A) Imports exceed exports by $200 billion.
B) Exports exceed imports by $200 billion.
C) Imports are equal to exports.
D) Exports plus imports equals $200 billion.
Unlock Deck
Unlock for access to all 147 flashcards in this deck.
Unlock Deck
k this deck
15
Suppose business managers become more optimistic about future sales and profits.How will this affect the autonomous investment function?
A) It will create a rightward movement along the autonomous investment function.
B) It will create a leftward movement along the autonomous investment function.
C) It will create an upward shift of the autonomous investment function.
D) It will create a downward shift of the autonomous investment function.
Unlock Deck
Unlock for access to all 147 flashcards in this deck.
Unlock Deck
k this deck
16
Suppose an economy has no government and no international transactions.What is aggregate expenditure at each level of income equal to?
A) consumption plus saving
B) planned investment plus saving
C) planned investment minus savings
D) consumption plus planned investment
A) consumption plus saving
B) planned investment plus saving
C) planned investment minus savings
D) consumption plus planned investment
Unlock Deck
Unlock for access to all 147 flashcards in this deck.
Unlock Deck
k this deck
17
-Refer to the table in the exhibit.What is the marginal propensity to consume?
A) 5/6
B) 4/5
C) 3/4
D) 2/3
Unlock Deck
Unlock for access to all 147 flashcards in this deck.
Unlock Deck
k this deck
18
-Refer to the table in the exhibit.What is the state of the government's budget?
A) The government's budget is in surplus.
B) The government's budget is in deficit.
C) The government's budget is in balance.
D) The data are insufficient for determining the state of the government's budget.
Unlock Deck
Unlock for access to all 147 flashcards in this deck.
Unlock Deck
k this deck
19
What does the aggregate expenditure line represent?
A) total planned spending at each income level
B) total planned spending at each price level
C) total planned spending at each income level, holding the price level constant
D) total planned spending at each price level, holding the level of income constant
A) total planned spending at each income level
B) total planned spending at each price level
C) total planned spending at each income level, holding the price level constant
D) total planned spending at each price level, holding the level of income constant
Unlock Deck
Unlock for access to all 147 flashcards in this deck.
Unlock Deck
k this deck
20
-Refer to the table in the exhibit.Which variables are autonomous?
A) Only saving and consumption are autonomous.
B) Only net taxes and government purchases are autonomous.
C) Only net exports and government purchases are autonomous.
D) Investment, net exports, net taxes, and government purchases are autonomous.
Unlock Deck
Unlock for access to all 147 flashcards in this deck.
Unlock Deck
k this deck
21
Refer to the table in the exhibit.Which of the following groups is considered autonomous with respect to income?
A) S, I, G, (X - IM)
B) NT, C, G, (X - IM)
C) NT, S, I, (X - IM)
D) I, G, X
Unlock Deck
Unlock for access to all 147 flashcards in this deck.
Unlock Deck
k this deck
22
Refer to the table in the exhibit.What is the state of the government's budget?
A) The government's budget has a deficit of $2 trillion.
B) The government's budget has a deficit of $1 trillion.
C) The government's budget is balanced.
D) The government's budget has a surplus of $1 trillion.
Unlock Deck
Unlock for access to all 147 flashcards in this deck.
Unlock Deck
k this deck
23
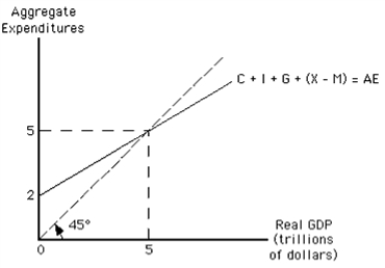
The aggregate expenditure line, along with the 45-degree line, determines equilibrium.What assumption is this model based on?
A) that production is constant
B) that production is constant and at the full employment level of GDP
C) that producers are ready to supply whatever amount of output is demanded at the existing price level
D) that producers will supply more at higher prices than they will at lower prices
A) that production is constant
B) that production is constant and at the full employment level of GDP
C) that producers are ready to supply whatever amount of output is demanded at the existing price level
D) that producers will supply more at higher prices than they will at lower prices
Unlock Deck
Unlock for access to all 147 flashcards in this deck.
Unlock Deck
k this deck
24
Refer to the table in the exhibit, where S + NT = I + G + (X - IM).What does this equal?
A) $1.1 trillion
B) $1.2 trillion
C) $1.3 trillion
D) $1.4 trillion
Unlock Deck
Unlock for access to all 147 flashcards in this deck.
Unlock Deck
k this deck
25
-Refer to the table in the exhibit.Given that leakages must equal injections in equilibrium, which of the following characterizes this relationship?
A) S + NT + NX = G + I
B) S = I
C) C + S = G + I
D) S + NT = NX + G + I
Unlock Deck
Unlock for access to all 147 flashcards in this deck.
Unlock Deck
k this deck
26
Refer to the graph in the exhibit.Which of the following best describes the situation at point C?
A) Consumption expenditures exceed disposable income.
B) Real GDP exceeds aggregate expenditure.
C) Aggregate expenditure is exactly equal to real GDP.
D) Aggregate expenditure exceeds real GDP.
Unlock Deck
Unlock for access to all 147 flashcards in this deck.
Unlock Deck
k this deck
27
-Refer to the table in the exhibit.What is the equilibrium level of income?
A) where real GDP = nominal GDP
B) where real GDP = total planned expenditures
C) where disposable income = total planned expenditures
D) where government spending equals taxation
Unlock Deck
Unlock for access to all 147 flashcards in this deck.
Unlock Deck
k this deck
28
Refer to the table in the exhibit.At the equilibrium level of GDP, what do injections equal?
A) $1.0 trillion
B) $1.3 trillion
C) $1.4 trillion
D) $1.5 trillion
Unlock Deck
Unlock for access to all 147 flashcards in this deck.
Unlock Deck
k this deck
29
Refer to the table in the exhibit.What is the equilibrium level of GDP?
A) $5.0 trillion
B) $5.5 trillion
C) $6.0 trillion
D) $6.5 trillion
Unlock Deck
Unlock for access to all 147 flashcards in this deck.
Unlock Deck
k this deck
30
Suppose an economy is in equilibrium when net taxes = $50 trillion, saving = $40 trillion, government purchases = $50 trillion, exports = $30 trillion, and imports = $10 trillion.What must planned investment spending be equal to?
A) $0
B) $10
C) $20
D) $50
A) $0
B) $10
C) $20
D) $50
Unlock Deck
Unlock for access to all 147 flashcards in this deck.
Unlock Deck
k this deck
31
Refer to the table in the exhibit.What does the marginal propensity to consume (MPC) equal?
A) 0.20, or 1/5
B) 0.40, or 2/5
C) 0.80, or 4/5
D) 0.90, or 9/10
Unlock Deck
Unlock for access to all 147 flashcards in this deck.
Unlock Deck
k this deck
32
-Refer to the table in the exhibit.What is the marginal propensity to save?
A) 5/6
B) 4/5
C) 3/4
D) 1/3
Unlock Deck
Unlock for access to all 147 flashcards in this deck.
Unlock Deck
k this deck
33
Refer to the table in the exhibit.At the equilibrium level of GDP, what does saving equal?
A) $0.3 trillion
B) $0.4 trillion
C) $0.5 trillion
D) $0.6 trillion
Unlock Deck
Unlock for access to all 147 flashcards in this deck.
Unlock Deck
k this deck
34
Which of the following is NOT included in the aggregate expenditure line?
A) consumption
B) price
C) investment
D) government spending
A) consumption
B) price
C) investment
D) government spending
Unlock Deck
Unlock for access to all 147 flashcards in this deck.
Unlock Deck
k this deck
35
Consider the aggregate expenditure line.What do the graph's horizontal axis and the vertical axis represent?
A) real GDP on the horizontal axis, and aggregate expenditure on the vertical axis
B) aggregate expenditure on the horizontal axis, and real GDP on the vertical axis
C) consumption on the horizontal axis, and aggregate expenditure on the vertical axis
D) aggregate expenditure on the horizontal axis, and consumption on the vertical axis
Unlock Deck
Unlock for access to all 147 flashcards in this deck.
Unlock Deck
k this deck
36
Which of the following best describes aggregate expenditure?
A) C + I + G + (X - IM)
B) C + S + G + (X - IM)
C) C + I + G + (X + IM)
D) C + I + T + (X - IM)
A) C + I + G + (X - IM)
B) C + S + G + (X - IM)
C) C + I + G + (X + IM)
D) C + I + T + (X - IM)
Unlock Deck
Unlock for access to all 147 flashcards in this deck.
Unlock Deck
k this deck
37
Refer to the table in the exhibit.What does the marginal propensity to save (MPS) equal?
A) 0.80, or 4/5
B) 0.60, or 3/5
C) 0.40, or 2/5
D) 0.20, or 1/5
Unlock Deck
Unlock for access to all 147 flashcards in this deck.
Unlock Deck
k this deck
38
Refer to the table in the exhibit.At the equilibrium level of GDP, what do leakages equal?
A) $1.4 trillion
B) $1.3 trillion
C) $1.1 trillion
D) $1.0 trillion
Unlock Deck
Unlock for access to all 147 flashcards in this deck.
Unlock Deck
k this deck
39
When does the equilibrium quantity of aggregate output occur?
A) when the economy reaches the full employment of labour
B) when planned aggregate expenditure equals income generated from production
C) when actual aggregate expenditures equal real GDP
D) when inventories of goods and services are increasing
A) when the economy reaches the full employment of labour
B) when planned aggregate expenditure equals income generated from production
C) when actual aggregate expenditures equal real GDP
D) when inventories of goods and services are increasing
Unlock Deck
Unlock for access to all 147 flashcards in this deck.
Unlock Deck
k this deck
40
Which of the following is NOT a part of planned aggregate spending?
A) consumption
B) investment
C) government expenditures
D) saving
A) consumption
B) investment
C) government expenditures
D) saving
Unlock Deck
Unlock for access to all 147 flashcards in this deck.
Unlock Deck
k this deck
41
-Refer to the table in the exhibit.What is the MPS in the economy represented?
A) 0
B) 0.1
C) 0.2
D) 0.8
Unlock Deck
Unlock for access to all 147 flashcards in this deck.
Unlock Deck
k this deck
42
On the aggregate expenditure graph, suppose autonomous saving increases by $15 billion.What will be the effect on the aggregate expenditure line?
A) The aggregate expenditure line will shift upward by $15 billion.
B) The aggregate expenditure line will stay in the same position.
C) The aggregate expenditure line will shift downward by $15 billion.
D) The aggregate expenditure line will first shift downward, and then it will shift upward by $15 billion.
Unlock Deck
Unlock for access to all 147 flashcards in this deck.
Unlock Deck
k this deck
43
At the equilibrium level of real GDP, what does unplanned inventory adjustment equal?
A) a negative number
B) a positive number
C) 0
D) 1
A) a negative number
B) a positive number
C) 0
D) 1
Unlock Deck
Unlock for access to all 147 flashcards in this deck.
Unlock Deck
k this deck
44
On the aggregate expenditure graph, suppose autonomous investment decreases by $10 billion.What will be the effect on the aggregate expenditure line?
A) The aggregate expenditure line will shift upward by $10 billion.
B) The aggregate expenditure line will shift by some multiple.
C) The aggregate expenditure line will shift downward by $10 billion.
D) The equilibrium level of real GDP demanded will decrease by $10 billion.
A) The aggregate expenditure line will shift upward by $10 billion.
B) The aggregate expenditure line will shift by some multiple.
C) The aggregate expenditure line will shift downward by $10 billion.
D) The equilibrium level of real GDP demanded will decrease by $10 billion.
Unlock Deck
Unlock for access to all 147 flashcards in this deck.
Unlock Deck
k this deck
45
Refer to the graph in the exhibit.Which of the following best describes the situation at point C?
A) Consumption expenditures exceed disposable income.
B) Producers are experiencing an unexpected loss in inventory.
C) Aggregate expenditure is exactly equal to real GDP.
D) Real GDP exceeds aggregate expenditure.
Unlock Deck
Unlock for access to all 147 flashcards in this deck.
Unlock Deck
k this deck
46
Suppose that at a particular level of real GDP, the unintended change in inventories is zero.How will this affect the level of real GDP?
A) The level of real GDP will be less than the equilibrium level of real GDP demanded.
B) The level of real GDP will be greater than the equilibrium level of real GDP demanded.
C) The level of real GDP will be the equilibrium level of real GDP demanded.
D) The level of real GDP will first be greater, and then less, than the equilibrium level of real GDP.
Unlock Deck
Unlock for access to all 147 flashcards in this deck.
Unlock Deck
k this deck
47
How will a decrease in autonomous investment affect the aggregate expenditure line?
A) It will shift the aggregate expenditure line upward.
B) It will shift the aggregate expenditure line downward.
C) It will result in an upward movement along the aggregate expenditure line.
D) It will result in a downward movement along the aggregate expenditure line.
A) It will shift the aggregate expenditure line upward.
B) It will shift the aggregate expenditure line downward.
C) It will result in an upward movement along the aggregate expenditure line.
D) It will result in a downward movement along the aggregate expenditure line.
Unlock Deck
Unlock for access to all 147 flashcards in this deck.
Unlock Deck
k this deck
48
On the aggregate expenditure graph, suppose autonomous investment increases by $20 billion.What will be the effect on the aggregate expenditure line?
A) The aggregate expenditure line will shift upward by $20 billion.
B) The aggregate expenditure line will stay the same.
C) The aggregate expenditure line will shift downward by $20 billion.
D) The aggregate expenditure line will first shift upward, and then it will shift downward by $20 billion.
A) The aggregate expenditure line will shift upward by $20 billion.
B) The aggregate expenditure line will stay the same.
C) The aggregate expenditure line will shift downward by $20 billion.
D) The aggregate expenditure line will first shift upward, and then it will shift downward by $20 billion.
Unlock Deck
Unlock for access to all 147 flashcards in this deck.
Unlock Deck
k this deck
49
In the income-expenditure framework, if planned aggregate expenditures are less than real GDP.How will inventories be affected?
A) Inventories will stay constant.
B) Inventories will match aggregate expenditures.
C) Inventories will increase.
D) Inventories will decrease.
A) Inventories will stay constant.
B) Inventories will match aggregate expenditures.
C) Inventories will increase.
D) Inventories will decrease.
Unlock Deck
Unlock for access to all 147 flashcards in this deck.
Unlock Deck
k this deck
50
Which of the following is assumed constant along the aggregate expenditure line?
A) the price level
B) consumption
C) unintended inventory adjustment
D) actual investment
A) the price level
B) consumption
C) unintended inventory adjustment
D) actual investment
Unlock Deck
Unlock for access to all 147 flashcards in this deck.
Unlock Deck
k this deck
51
Which of the following does NOT happen when planned aggregate expenditure is greater than output?
A) Real GDP demanded rises.
B) Real GDP demanded falls.
C) Real GDP demanded stays the same.
D) Real GDP demanded first rises, and then falls.
A) Real GDP demanded rises.
B) Real GDP demanded falls.
C) Real GDP demanded stays the same.
D) Real GDP demanded first rises, and then falls.
Unlock Deck
Unlock for access to all 147 flashcards in this deck.
Unlock Deck
k this deck
52
Which of the following does NOT characterize what happens at the equilibrium quantity of GDP demanded?
A) Planned investment equals actual investment.
B) Planned investment equals saving.
C) Planned investment is greater than unintended inventory adjustment.
D) Planned injections into the circular flow are less than planned leakages out of the flow.
A) Planned investment equals actual investment.
B) Planned investment equals saving.
C) Planned investment is greater than unintended inventory adjustment.
D) Planned injections into the circular flow are less than planned leakages out of the flow.
Unlock Deck
Unlock for access to all 147 flashcards in this deck.
Unlock Deck
k this deck
53
Which of the following will cause the economy to contract?
A) if leakages exceed injections
B) if injections exceed leakages
C) if expenditures exceed output
D) if investment exceeds saving
A) if leakages exceed injections
B) if injections exceed leakages
C) if expenditures exceed output
D) if investment exceeds saving
Unlock Deck
Unlock for access to all 147 flashcards in this deck.
Unlock Deck
k this deck
54
Which of the following will cause the economy to expand?
A) if leakages exceed injections
B) if injections exceed leakages
C) if leakages equal injections
D) if saving exceeds investment
A) if leakages exceed injections
B) if injections exceed leakages
C) if leakages equal injections
D) if saving exceeds investment
Unlock Deck
Unlock for access to all 147 flashcards in this deck.
Unlock Deck
k this deck
55
In the income-expenditure framework, suppose planned aggregate expenditures are greater than real GDP.How will inventories be affected?
A) Inventories will stay the same.
B) Inventories will first increase, and then decrease.
C) Inventories will increase.
D) Inventories will decrease.
A) Inventories will stay the same.
B) Inventories will first increase, and then decrease.
C) Inventories will increase.
D) Inventories will decrease.
Unlock Deck
Unlock for access to all 147 flashcards in this deck.
Unlock Deck
k this deck
56
What is the result if planned spending exceeds planned output?
A) unintended inventory increases
B) a reduction in GDP
C) a decrease in imports
D) unintended inventory reductions
A) unintended inventory increases
B) a reduction in GDP
C) a decrease in imports
D) unintended inventory reductions
Unlock Deck
Unlock for access to all 147 flashcards in this deck.
Unlock Deck
k this deck
57
What is illustrated by the distance between the aggregate expenditure line and the 45-degree line at each level of real GDP?
A) saving
B) unplanned inventory change
C) planned investment
D) marginal propensity to consume
A) saving
B) unplanned inventory change
C) planned investment
D) marginal propensity to consume
Unlock Deck
Unlock for access to all 147 flashcards in this deck.
Unlock Deck
k this deck
58
-Refer to the table in the exhibit.What is the MPC in the economy represented?
A) 0
B) 0.2
C) 0.8
D) 0.9
Unlock Deck
Unlock for access to all 147 flashcards in this deck.
Unlock Deck
k this deck
59
How will an increase in autonomous investment affect the aggregate expenditure line?
A) It will shift the aggregate expenditure line upward.
B) It will shift the aggregate expenditure line downward.
C) It will result in an upward movement along the aggregate expenditure line.
D) It will result in a downward movement along the aggregate expenditure line.
A) It will shift the aggregate expenditure line upward.
B) It will shift the aggregate expenditure line downward.
C) It will result in an upward movement along the aggregate expenditure line.
D) It will result in a downward movement along the aggregate expenditure line.
Unlock Deck
Unlock for access to all 147 flashcards in this deck.
Unlock Deck
k this deck
60
Suppose current real GDP is greater than planned aggregate expenditure.Which of the following best describes how inventories of goods and services are affected?
A) Inventories of goods and services will rise.
B) Inventories of goods and services will decline.
C) Firms will increase production to replenish depleted inventories.
D) Inventories will stay the same.
A) Inventories of goods and services will rise.
B) Inventories of goods and services will decline.
C) Firms will increase production to replenish depleted inventories.
D) Inventories will stay the same.
Unlock Deck
Unlock for access to all 147 flashcards in this deck.
Unlock Deck
k this deck
61
Suppose the full employment level of income is $1,200 billion, and the present level of income is $1,000 billion.Which of the following describes autonomous expenditure under these circumstances?
A) Autonomous expenditure is at full employment equilibrium.
B) Autonomous expenditure is too low for a full employment equilibrium.
C) Autonomous expenditure is too high for a full employment equilibrium.
D) Autonomous expenditure is the difference between the present level of income and the full employment level of income.
Unlock Deck
Unlock for access to all 147 flashcards in this deck.
Unlock Deck
k this deck
62
Other things constant, how would a smaller marginal propensity to save affect the marginal propensity to consume?
A) The marginal propensity to consume would become smaller.
B) The marginal propensity to consume would become larger.
C) The marginal propensity to consume would remain the same.
D) The marginal propensity to consume would be negative.
A) The marginal propensity to consume would become smaller.
B) The marginal propensity to consume would become larger.
C) The marginal propensity to consume would remain the same.
D) The marginal propensity to consume would be negative.
Unlock Deck
Unlock for access to all 147 flashcards in this deck.
Unlock Deck
k this deck
63
What is the term for that fraction of a change in disposable income that is consumed?
A) the marginal propensity to save
B) induced consumption
C) the multiplier
D) the marginal propensity to consume
A) the marginal propensity to save
B) induced consumption
C) the multiplier
D) the marginal propensity to consume
Unlock Deck
Unlock for access to all 147 flashcards in this deck.
Unlock Deck
k this deck
64
The many job losses that occurred soon after the September 11, 2001 attacks in the United States could be viewed as just part of the first round of reduced aggregate expenditure.When did the second round occur?
A) when government starting spending more on national security
B) when people who lost jobs, or who feared they would lose their jobs, started spending less
C) when businesses invested in backup data centres in case their main computers were attacked
D) when consumers went back to shopping at the urging of government officials
Unlock Deck
Unlock for access to all 147 flashcards in this deck.
Unlock Deck
k this deck
65
Suppose households save $30 billion more at each level of income, and the MPC = 0.9.How will the aggregate expenditure line be affected?
A) It will shift upward by $30 billion.
B) It will shift downward by $30 billion.
C) It will shift upward by $300 billion because of the multiplier.
D) It will shift downward by $300 billion because of the multiplier.
A) It will shift upward by $30 billion.
B) It will shift downward by $30 billion.
C) It will shift upward by $300 billion because of the multiplier.
D) It will shift downward by $300 billion because of the multiplier.
Unlock Deck
Unlock for access to all 147 flashcards in this deck.
Unlock Deck
k this deck
66
Which of the following best describes the simple spending multiplier?
A) having a bird in the hand rather than two in the bush
B) two wrongs making a right
C) the spreading of ripples from a stone thrown in a pond
D) getting too much of a good thing
A) having a bird in the hand rather than two in the bush
B) two wrongs making a right
C) the spreading of ripples from a stone thrown in a pond
D) getting too much of a good thing
Unlock Deck
Unlock for access to all 147 flashcards in this deck.
Unlock Deck
k this deck
67
Other things constant, how would a smaller marginal propensity to save affect the multiplier?
A) The multiplier would increase.
B) The multiplier would remain the same.
C) The multiplier would become smaller.
D) The multiplier would be negative.
A) The multiplier would increase.
B) The multiplier would remain the same.
C) The multiplier would become smaller.
D) The multiplier would be negative.
Unlock Deck
Unlock for access to all 147 flashcards in this deck.
Unlock Deck
k this deck
68
What is the definition of the simple multiplier?
A) 1.0 divided by the marginal propensity to save
B) 1.0 divided by the marginal propensity to consume
C) the MPS plus the MPC
D) the MPS minus the MPC
A) 1.0 divided by the marginal propensity to save
B) 1.0 divided by the marginal propensity to consume
C) the MPS plus the MPC
D) the MPS minus the MPC
Unlock Deck
Unlock for access to all 147 flashcards in this deck.
Unlock Deck
k this deck
69
If the MPS is 0.25, what is the simple multiplier?
A) 4
B) 5
C) 25
D) 75
A) 4
B) 5
C) 25
D) 75
Unlock Deck
Unlock for access to all 147 flashcards in this deck.
Unlock Deck
k this deck
70
Refer to the graph in the exhibit.Assume the economy is in equilibrium with real GDP of $5 trillion.Suppose aggregate expenditure increases by $1 trillion.How would the economy's equilibrium real GDP most likely be affected?
A) It would increase by more than $1 trillion.
B) It would increase by $1 trillion.
C) It would increase by less than $1 trillion.
D) It would decrease by $1 trillion.
Unlock Deck
Unlock for access to all 147 flashcards in this deck.
Unlock Deck
k this deck
71
Suppose the economy is currently at equilibrium at $1 trillion, and the MPC is 0.6.And suppose there is a $100 billion decrease in government purchases of goods and services.Which of the following is the new equilibrium?
A) $400 billion
B) $600 billion
C) $750 billion
D) $1.4 trillion
A) $400 billion
B) $600 billion
C) $750 billion
D) $1.4 trillion
Unlock Deck
Unlock for access to all 147 flashcards in this deck.
Unlock Deck
k this deck
72
Other things constant, how would a smaller marginal propensity to save affect the consumption function?
A) The smaller the marginal propensity to save, the longer the consumption function.
B) The smaller the marginal propensity to save, the shorter the consumption function.
C) The smaller the marginal propensity to save, the flatter the consumption function.
D) The smaller the marginal propensity to save, the steeper the consumption function.
Unlock Deck
Unlock for access to all 147 flashcards in this deck.
Unlock Deck
k this deck
73
Suppose the marginal propensity to consume equals 0.9.What is the multiplier?
A) 1
B) 2
C) 5
D) 10
A) 1
B) 2
C) 5
D) 10
Unlock Deck
Unlock for access to all 147 flashcards in this deck.
Unlock Deck
k this deck
74
Suppose autonomous investment expenditures decline because of higher interest rates.How will this affect aggregate demand?
A) Aggregate demand will increase.
B) Aggregate demand will decrease.
C) Aggregate demand will remain the same.
D) Aggregate demand will become negative.
A) Aggregate demand will increase.
B) Aggregate demand will decrease.
C) Aggregate demand will remain the same.
D) Aggregate demand will become negative.
Unlock Deck
Unlock for access to all 147 flashcards in this deck.
Unlock Deck
k this deck
75
Suppose the spending multiplier is greater than 1.0.Which of the following will be the result of a $200 billion increase in autonomous investment?
A) Equilibrium investment will increase by less than $200 billion.
B) Equilibrium investment will decrease by more than $200 billion.
C) Equilibrium real GDP demanded will increase by more than $200 billion.
D) Equilibrium real GDP demanded will decrease by less than $200 billion.
A) Equilibrium investment will increase by less than $200 billion.
B) Equilibrium investment will decrease by more than $200 billion.
C) Equilibrium real GDP demanded will increase by more than $200 billion.
D) Equilibrium real GDP demanded will decrease by less than $200 billion.
Unlock Deck
Unlock for access to all 147 flashcards in this deck.
Unlock Deck
k this deck
76
Suppose Herbert spends two-thirds of any extra income he receives.And suppose that Herbert engages in new autonomous spending of $10, which causes equilibrium to increase.What is the amount of the equilibrium increase?
A) $6.67
B) $15.00
C) $16.67
D) $30.00
A) $6.67
B) $15.00
C) $16.67
D) $30.00
Unlock Deck
Unlock for access to all 147 flashcards in this deck.
Unlock Deck
k this deck
77
On the aggregate expenditure graph, if autonomous saving decreases by $15 billion.What will be the effect on the aggregate expenditure line?
A) The aggregate expenditure line will shift upward by $15 billion
B) The aggregate expenditure line will stay in the same position.
C) The aggregate expenditure line will shift downward by $15 billion.
D) The aggregate expenditure line will first shift downward, and then it will shift upward by $15 billion.
Unlock Deck
Unlock for access to all 147 flashcards in this deck.
Unlock Deck
k this deck
78
Suppose households save $40 billion less at each level of income, and the MPC = 0.8.How will the aggregate expenditure line will be affected?
A) It will shift upward by $40 billion.
B) It will shift downward by $40 billion.
C) It will shift upward by $200 billion because of the multiplier.
D) It will shift downward by $200 billion because of the multiplier.
A) It will shift upward by $40 billion.
B) It will shift downward by $40 billion.
C) It will shift upward by $200 billion because of the multiplier.
D) It will shift downward by $200 billion because of the multiplier.
Unlock Deck
Unlock for access to all 147 flashcards in this deck.
Unlock Deck
k this deck
79
Suppose investment increases by $100 and, as a result, GDP ultimately increases by $200.What does the multiplier equal?
A) 1
B) 2
C) 3
D) 4
A) 1
B) 2
C) 3
D) 4
Unlock Deck
Unlock for access to all 147 flashcards in this deck.
Unlock Deck
k this deck
80
Which of the following best describes the multiplier?
A) It shows the magnified change in planned aggregate spending that arises from a change in output.
B) It shows the magnified change in planned aggregate spending that arises from a change in equilibrium output.
C) It shows the magnified change in equilibrium output demanded that arises from a change in income.
D) It shows the magnified change in equilibrium output demanded that arises from a change in planned aggregate spending.
Unlock Deck
Unlock for access to all 147 flashcards in this deck.
Unlock Deck
k this deck
Unlock Deck
Unlock for access to all 147 flashcards in this deck.


