Deck 2: Scarcity, trade-Offs, and Production Possibilities
Full screen (f)
Question
Question
Question
Question
Question
Question
Question
Question
Question
Question
Question
Question
Question
Question
Question
Question
Question
Question
Question
Question
Question
FIGURE 2-2

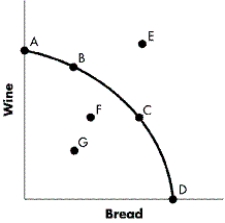
Refer to Figure 2-2.Which of the following statements about a movement from Point C to Point B is the most accurate?
A)It involves sacrificing bread in order to produce a greater quantity of wine.
B)It involves sacrificing wine in order to produce a greater quantity of bread.
C)It involves no sacrifice of output, as the opportunity cost of production is zero everywhere along the production possibilities curve.
D)It will increase the level of unemployment in the economy.
Question
Question
FIGURE 2-1
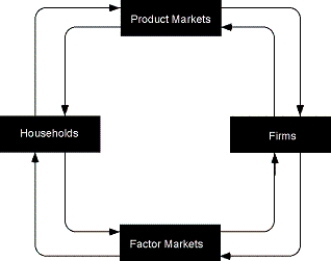
Refer to Figure 2-1.What does the arrow from the product markets to the firms represent?
A)revenue
B)goods and services sold
C)money income
D)wages, rent interest, and profits
Refer to Figure 2-1.What does the arrow from the product markets to the firms represent?
A)revenue
B)goods and services sold
C)money income
D)wages, rent interest, and profits
Question
Question
FIGURE 2-2
Refer to Figure 2-2.Which of the following statements best describes the opportunity cost of producing an additional cake?
A)It increases as the economy moves in a southeast direction along the production possibilities curve.
B)It decreases as the economy moves in a southeast direction along the production possibilities curve.
C)It remains constant as the economy moves in a southeast direction along the production possibilities curve.
D)It equals zero.
Question
Question
FIGURE 2-1
Refer to Figure 2-1.Which of the followings statements about payments for goods and services is the most accurate?
A)They are received by households in the factor market.
B)They are received by firms in the factor market.
C)They flow in a clockwise direction.
D)They flow in a counter-clockwise direction.
Question
FIGURE 2-2
Refer to Figure 2-2.Which of the following statements about a movement from Point D to Point C is the most accurate?
A)It requires the sacrifice of four cupcakes in order to obtain one cake.
B)It requires the sacrifice of one cake in order to obtain four cupcakes.
C)It reallocates inputs without affecting overall levels of production.
D)It increases unemployment.
Question
Question
FIGURE 2-1
Refer to Figure 2-1.What does the arrow from the factor markets to the households represent?
A)wages, rent interest, and profits
B)revenue
C)money income
D)goods and services sold
Refer to Figure 2-1.What does the arrow from the factor markets to the households represent?
A)wages, rent interest, and profits
B)revenue
C)money income
D)goods and services sold
Question
Question
Question
FIGURE 2-1
Refer to Figure 2-1.What does the arrow from the firms to the factor markets represent?
A)wages, rent interest, and profits
B)goods and services sold
C)money income
D)revenue
Refer to Figure 2-1.What does the arrow from the firms to the factor markets represent?
A)wages, rent interest, and profits
B)goods and services sold
C)money income
D)revenue
Question
FIGURE 2-2
Refer to Figure 2-2.Which of the following statements about a movement from Point G to Point F is the most accurate?
A)It involves sacrificing wine in order to produce a greater quantity of bread.
B)It will increase the level of unemployment in the economy.
C)It involves no sacrifice of output, as both more wine and bread can be produced if available resources are used more efficiently.
D)It involves sacrificing bread in order to produce a greater quantity of wine.
Question
FIGURE 2-1
Refer to Figure 2-1.Which of the following statements about goods and services is the most accurate?
A)They are purchased by households in the factor market.
B)They flow in a clockwise direction.
C)They are sold by businesses in the factor market.
D)They flow in a counter clockwise direction.
Refer to Figure 2-1.Which of the following statements about goods and services is the most accurate?
A)They are purchased by households in the factor market.
B)They flow in a clockwise direction.
C)They are sold by businesses in the factor market.
D)They flow in a counter clockwise direction.
Question
FIGURE 2-1
Refer to Figure 2-1.What does the arrow from the firms to the product markets represent?
A)money income
B)goods and services sold
C)revenue
D)wages, rent interest, and profits
Refer to Figure 2-1.What does the arrow from the firms to the product markets represent?
A)money income
B)goods and services sold
C)revenue
D)wages, rent interest, and profits
Question
FIGURE 2-2
Refer to Figure 2-2.Which of the following statements about a movement from Point B to Point C is the most accurate?
A)It involves sacrificing bread in order to produce a greater quantity of wine.
B)It involves no sacrifice, as the opportunity cost of production is zero everywhere along the production possibilities curve.
C)It involves sacrificing wine in order to produce a greater quantity of bread.
D)It will increase the level of unemployment in the economy.
Question
Question
Question
FIGURE 2-2
Refer to Figure 2-2.What is the opportunity cost of producing an additional cake equal to?
A)1/4 of a cupcake
B)4 cupcakes
C)10 cupcakes
D)40 cupcakes
Refer to Figure 2-2.What is the opportunity cost of producing an additional cake equal to?
A)1/4 of a cupcake
B)4 cupcakes
C)10 cupcakes
D)40 cupcakes
Question
FIGURE 2-3
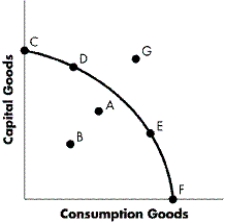
Refer to Figure 2-3.What is the most inefficient point depicted?
A)Point A
B)Point C
C)Point D
D)Point G
Refer to Figure 2-3.What is the most inefficient point depicted?
A)Point A
B)Point C
C)Point D
D)Point G
Question
FIGURE 2-3
Refer to Figure 2-3.Which of the following movements will result in an increase in the quantity of both capital and consumption goods produced this period?
A)a movement from Point D to Point F
B)a movement from Point F to Point D
C)a movement from Point B to Point A
D)a movement from Point F to Point A
Question
FIGURE 2-3
Refer to Figure 2-3.Considering only points on the frontier,at what point will the economy experience the least amount of economic growth over time (ceteris paribus)?
A)Point A
B)Point C
C)Point E
D)Point F
Refer to Figure 2-3.Considering only points on the frontier,at what point will the economy experience the least amount of economic growth over time (ceteris paribus)?
A)Point A
B)Point C
C)Point E
D)Point F
Question
FIGURE 2-3
Refer to Figure 2-3.At which point is it currently not possible to produce?
A)Point A
B)Point B
C)Point E
D)Point G
Refer to Figure 2-3.At which point is it currently not possible to produce?
A)Point A
B)Point B
C)Point E
D)Point G
Question
Question
FIGURE 2-3
Refer to Figure 2-3.Which of the following movements will result in a decrease in the production of capital goods but an increase in the production of consumption goods this period?
A)a movement from Point A to Point B
B)a movement from Point C to Point E
C)a movement from Point D to Point G
D)a movement from Point B to Point A
Question
FIGURE 2-3
Refer to Figure 2-3.An economy is operating at full employment,and then workers in the bread industry are laid off.How is this change portrayed on the production possibilities curve?
A)as a movement from A to B
B)as a movement from B to E
C)as a movement from C to F
D)as a movement from G to F
Refer to Figure 2-3.An economy is operating at full employment,and then workers in the bread industry are laid off.How is this change portrayed on the production possibilities curve?
A)as a movement from A to B
B)as a movement from B to E
C)as a movement from C to F
D)as a movement from G to F
Question
FIGURE 2-3
Refer to Figure 2-3.What is the most efficient point of production depicted?
A)Point D
B)Point E
C)Point F
D)Point G
Refer to Figure 2-3.What is the most efficient point of production depicted?
A)Point D
B)Point E
C)Point F
D)Point G
Question
Question
FIGURE 2-4
Refer to Figure 2-4.Currently,which point is impossible to achieve?
A)Point A
B)Point C
C)Point E
D)Point G
Refer to Figure 2-4.Currently,which point is impossible to achieve?
A)Point A
B)Point C
C)Point E
D)Point G
Question
Question
FIGURE 2-3
Refer to Figure 2-3.Which of the following statements about Point A is most accurate?
A)The economy is operating inefficiently at Point A.
B)Both wine and bread are produced at Point A.
C)Only wine is produced at Point A.
D)Only bread is produced at Point A.
Refer to Figure 2-3.Which of the following statements about Point A is most accurate?
A)The economy is operating inefficiently at Point A.
B)Both wine and bread are produced at Point A.
C)Only wine is produced at Point A.
D)Only bread is produced at Point A.
Question
Question
FIGURE 2-3
Refer to Figure 2-3.Comparatively,at which point is the opportunity cost of one more unit of a consumption good greater?
A)It is greater at Point C than at Point D.
B)It is greater at Point D than at Point E.
C)It is greater at Point E than at Point D.
D)It is greater at Point B than at Point A.
Refer to Figure 2-3.Comparatively,at which point is the opportunity cost of one more unit of a consumption good greater?
A)It is greater at Point C than at Point D.
B)It is greater at Point D than at Point E.
C)It is greater at Point E than at Point D.
D)It is greater at Point B than at Point A.
Question
Question
FIGURE 2-3
Refer to Figure 2-3.At which point is the opportunity cost of one more unit of a capital good greater?
A)It is greater at Point F than at Point E.
B)It is greater at Point D than at Point E.
C)It is greater at Point E than at Point D.
D)It is greater at Point B than at Point A.
Refer to Figure 2-3.At which point is the opportunity cost of one more unit of a capital good greater?
A)It is greater at Point F than at Point E.
B)It is greater at Point D than at Point E.
C)It is greater at Point E than at Point D.
D)It is greater at Point B than at Point A.
Question
Question
FIGURE 2-3
Refer to Figure 2-3.Which of the following movements will result in an increase in the production of capital goods but a decrease in the production of consumption goods this period?
A)a movement from Point E to Point D
B)a movement from Point B to Point A
C)a movement from Point D to Point G
D)a movement from Point A to Point B
Question
FIGURE 2-3
Refer to Figure 2-3.Other things being equal,where would the economy operate in order to achieve the greatest economic growth over time?
A)Point A
B)Point B
C)Point C
D)Point E
Refer to Figure 2-3.Other things being equal,where would the economy operate in order to achieve the greatest economic growth over time?
A)Point A
B)Point B
C)Point C
D)Point E
Question
Question
FIGURE 2-4
Refer to Figure 2-4.If the economy chooses to shift more of its resources into clothing,what will it have to give up?
A)smaller and smaller amounts of food per unit of added clothing as the quantity of clothing produced increases
B)nothing, since food and clothing are not substitutes
C)larger and larger amounts of food per unit of added clothing as the quantity of clothing produced increases
D)relatively equal amounts of food per unit of added clothing as the quantity of clothing produced increases
Question
FIGURE 2-6
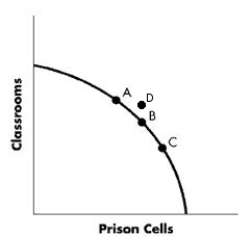
Refer to Figure 2-6.The diagram represents a trade-off in an economy between prison cells and classrooms.Which position represents the choice to allocate the greatest amount of resources to producing classrooms?
A)Point A
B)Point B
C)Point C
D)Point D
Refer to Figure 2-6.The diagram represents a trade-off in an economy between prison cells and classrooms.Which position represents the choice to allocate the greatest amount of resources to producing classrooms?
A)Point A
B)Point B
C)Point C
D)Point D
Question
FIGURE 2-8
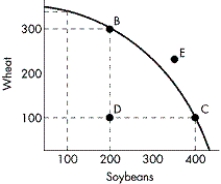
Refer to Figure 2-8.Assume the economy is operating at Point D.What is the opportunity cost of moving to Point B?
A)about 200 bushels of wheat
B)about 200 bushels of soybeans
C)zero
D)infinite, as Point B cannot be produced at any cost
Refer to Figure 2-8.Assume the economy is operating at Point D.What is the opportunity cost of moving to Point B?
A)about 200 bushels of wheat
B)about 200 bushels of soybeans
C)zero
D)infinite, as Point B cannot be produced at any cost
Question
Question
FIGURE 2-6
Refer to Figure 2-6.If the economy moves from Point C to Point A,what is the result?
A)There is no net change in the number of prison cells and classrooms, as all points on the frontier are equally efficient.
B)More prison cells are created.
C)It sacrifices an increasing quantity of classrooms per prison cell produced the further the movement toward Point A.
D)More classrooms are created.
Question
FIGURE 2-4
Refer to Figure 2-4.Which of the following points corresponds to an economy experiencing significant unemployment and/or producing inefficiently?
A)Point A
B)Point C
C)Point E
D)Point F
Refer to Figure 2-4.Which of the following points corresponds to an economy experiencing significant unemployment and/or producing inefficiently?
A)Point A
B)Point C
C)Point E
D)Point F
Question
Question
FIGURE 2-7
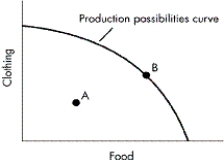
Refer to Figure 2-7.What does Point A indicate about the economy?
A)It is not using its resources efficiently.
B)It is using its resources efficiently to produce both food and clothing.
C)It is using its resources efficiently while producing food but no clothing.
D)It is using its resources efficiently while producing clothing but no food.
Question
FIGURE 2-4
Refer to Figure 2-4.For this economy,what is the most preferred point to produce at?
A)Point A
B)Point B
C)Point D
D)Point G
Refer to Figure 2-4.For this economy,what is the most preferred point to produce at?
A)Point A
B)Point B
C)Point D
D)Point G
Question
FIGURE 2-7
Refer to Figure 2-7.What does Point B indicate about the economy?
A)It is using its resources efficiently while producing food but no clothing.
B)It is using its resources efficiently to produce both food and clothing.
C)It is not using its resources efficiently.
D)It is using its resources efficiently while producing clothing but no food.
Question
FIGURE 2-8
Refer to Figure 2-8.In order to move from Point B to Point C,what will the economy have to give up?
A)300 bushels of wheat
B)200 bushels of soybeans
C)200 bushels of wheat
D)100 bushels of soybeans
Refer to Figure 2-8.In order to move from Point B to Point C,what will the economy have to give up?
A)300 bushels of wheat
B)200 bushels of soybeans
C)200 bushels of wheat
D)100 bushels of soybeans
Question
FIGURE 2-8
Refer to Figure 2-8.In order for the economy to move from Point B to Point E at a given point in time,what would it have to do?
A)Sacrifice wheat in favour of more soybeans.
B)Sacrifice soybeans in favour of more wheat.
C)Stop wasting resources.
D)Increase the productive capabilities of the economy.
Question
Question
FIGURE 2-5
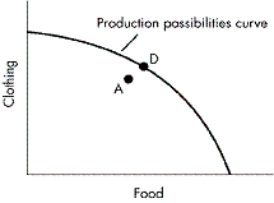
Refer to Figure 2.5.How could Point D be described?
A)It is inefficient.
B)It is beyond the society's productive capability.
C)It is unattainable.
D)It is preferable to Point A.
Refer to Figure 2.5.How could Point D be described?
A)It is inefficient.
B)It is beyond the society's productive capability.
C)It is unattainable.
D)It is preferable to Point A.
Question
FIGURE 2-6
Refer to Figure 2-6.The diagram represents a trade-off in an economy between prison cells and classrooms.Which position represents the choice to allocate the greatest amount of resources to producing prison cells?
A)Point A
B)Point B
C)Point C
D)Point D
Refer to Figure 2-6.The diagram represents a trade-off in an economy between prison cells and classrooms.Which position represents the choice to allocate the greatest amount of resources to producing prison cells?
A)Point A
B)Point B
C)Point C
D)Point D
Question
FIGURE 2-8
Refer to Figure 2-8.In order to move from Point D to Point C,what will the economy have to give up?
A)200 bushels of soybeans
B)200 bushels of wheat
C)100 bushels of wheat
D)nothing
Refer to Figure 2-8.In order to move from Point D to Point C,what will the economy have to give up?
A)200 bushels of soybeans
B)200 bushels of wheat
C)100 bushels of wheat
D)nothing
Question
FIGURE 2-5
Refer to Figure 2.5.How would Point A be described?
A)It is efficient.
B)It is preferable to Point D.
C)It is inefficient.
D)It is unattainable.
Refer to Figure 2.5.How would Point A be described?
A)It is efficient.
B)It is preferable to Point D.
C)It is inefficient.
D)It is unattainable.
Question
FIGURE 2-4
Refer to Figure 2-4.Which of the following statements about the movement from Point D to Point E is the most accurate?
A)It results in an increase in the production of both capital and consumption goods this period.
B)It results in an increase in the production of capital goods but a decrease in the production of consumption goods this period.
C)It does not change the level of output produced since both points are on the production possibilities curve.
D)It results in an increase in the production of consumption goods but a decrease in the production of capital goods this period.
Question
Question
FIGURE 2-7
Refer to Figure 2-7.What happens in the economy when production moves from Point A to Point B?
A)The economy increases production of clothing, but not food.
B)The economy operates at its productive capacity once it reaches Point B.
C)The economy increases production of food, but not clothing.
D)The economy is using its resources inefficiently to produce both food and clothing.

Unlock Deck
Sign up to unlock the cards in this deck!
Unlock Deck
Unlock Deck
1/166
Play
Full screen (f)
Deck 2: Scarcity, trade-Offs, and Production Possibilities
1
How does a "command economy" compare to a "market economy"?
A)Production and distribution decisions are made by central planners in a command economy, but not in a market economy.
B)There is scarcity in command economies, but not in market economies.
C)Command economies are less prone to inflation than are market economies.
D)A command economy is more efficient than a market economy because decision making is centralized.
Production and distribution decisions are made by central planners in a command economy, but not in a market economy.
2
What tends to occur in countries with high labour costs?
A)They use more labour rather than capital in the production process.
B)They use more capital rather than labour in the production process.
C)They rely on only one method for the production of goods.
D)They become relatively poor countries.
A)They use more labour rather than capital in the production process.
B)They use more capital rather than labour in the production process.
C)They rely on only one method for the production of goods.
D)They become relatively poor countries.
They use more capital rather than labour in the production process.
3
Which of the following best characterizes the circular flow model?
A)Businesses receive revenue from households in exchange for providing inputs and use that revenue to buy goods and services from households.
B)Households receive income from governments in exchange for providing inputs and use that income to buy goods and services from businesses.
C)Households receive revenue for selling goods and services to businesses and use that revenue to buy inputs from businesses.
D)Businesses receive income from households in exchange for providing goods and services and use that income to buy inputs from households.
Businesses receive revenue from households in exchange for providing inputs and use that revenue to buy goods and services from households.
4
Three economic questions must be determined in all societies.What are they?
A)What goods will be produced? How will goods be produced? For whom will goods be produced?
B)What is the opportunity cost of production? Does the society have a comparative advantage in production? Will consumers desire the goods being produced?
C)What will the price of each good be? Who will produce each good? Who will consume each good?
D)How much will be produced? When will it be produced? How much will it cost?
Unlock Deck
Unlock for access to all 166 flashcards in this deck.
Unlock Deck
k this deck
5
Which of the following is NOT a payment made to households in exchange for the use of factors of production?
A)taxes
B)wages
C)rent
D)interest
A)taxes
B)wages
C)rent
D)interest
Unlock Deck
Unlock for access to all 166 flashcards in this deck.
Unlock Deck
k this deck
6
What does the use of large amounts of labour relative to capital in an economy indicate?
A)that labour wage rates will be relatively high
B)that production is capital intensive
C)that production is labour intensive
D)that hand-made goods are of better quality than machine-made goods
A)that labour wage rates will be relatively high
B)that production is capital intensive
C)that production is labour intensive
D)that hand-made goods are of better quality than machine-made goods
Unlock Deck
Unlock for access to all 166 flashcards in this deck.
Unlock Deck
k this deck
7
In the circular flow model,in what forms do households receive income?
A)wages, rent, interest, and profits
B)wages and rent while firms receive interest and profits
C)wages, rent, and interest while firms receive profits
D)wages while firms receive rent, interest, and profits
A)wages, rent, interest, and profits
B)wages and rent while firms receive interest and profits
C)wages, rent, and interest while firms receive profits
D)wages while firms receive rent, interest, and profits
Unlock Deck
Unlock for access to all 166 flashcards in this deck.
Unlock Deck
k this deck
8
In a market economy,who will get the goods that are produced?
A)those that business firms choose to favour
B)those that have sufficient income and are willing to pay the asking price
C)those that desire the goods the least
D)those that the government views as best suited for consumption
A)those that business firms choose to favour
B)those that have sufficient income and are willing to pay the asking price
C)those that desire the goods the least
D)those that the government views as best suited for consumption
Unlock Deck
Unlock for access to all 166 flashcards in this deck.
Unlock Deck
k this deck
9
Lumber prices fall in Calgary,Alberta,because new forests are opened for harvesting in nearby British Columbia.As a result,what might you expect to find in the Calgary housing industry?
A)Less labour will be used to construct homes as wages fall relative to the price of lumber.
B)Less wood will be used in the construction of new homes because the price is now cheaper.
C)Steel frames for houses are replacing wood frames because wood is considered a cheap substitute.
D)More wood is being used in the construction of new homes.
Unlock Deck
Unlock for access to all 166 flashcards in this deck.
Unlock Deck
k this deck
10
In a market economy,how are resources allocated?
A)by central planners using a price system
B)by decentralized planners at the local level
C)by government bureaucracies because of the absence of a price system
D)by individual decision makers responding to market prices
A)by central planners using a price system
B)by decentralized planners at the local level
C)by government bureaucracies because of the absence of a price system
D)by individual decision makers responding to market prices
Unlock Deck
Unlock for access to all 166 flashcards in this deck.
Unlock Deck
k this deck
11
Which of the following is NOT a question that scarcity forces all societies to answer?
A)How are goods and services to be produced?
B)Who will get the goods and services produced?
C)How can scarcity be eliminated?
D)Which goods and services are to be produced?
A)How are goods and services to be produced?
B)Who will get the goods and services produced?
C)How can scarcity be eliminated?
D)Which goods and services are to be produced?
Unlock Deck
Unlock for access to all 166 flashcards in this deck.
Unlock Deck
k this deck
12
Which of the following best characterizes the circular flow of income?
A)Businesses buy resources from the government, and households buy goods and services from businesses.
B)Businesses buy resources from households, and households use the money from the sale of resources to buy goods and services from businesses.
C)Households buy factors of production from businesses, and businesses buy goods and services from households.
D)The government purchases resources from businesses and households and then sells goods and services to businesses and households.
Unlock Deck
Unlock for access to all 166 flashcards in this deck.
Unlock Deck
k this deck
13
What will occur when a command economy is utilized to resolve economic questions regarding the allocation of resources?
A)Everyone will receive an equal share of the output produced.
B)The role of markets will be replaced by political decision making.
C)The preferences of individuals will become of no importance.
D)Economic efficiency will be assured.
A)Everyone will receive an equal share of the output produced.
B)The role of markets will be replaced by political decision making.
C)The preferences of individuals will become of no importance.
D)Economic efficiency will be assured.
Unlock Deck
Unlock for access to all 166 flashcards in this deck.
Unlock Deck
k this deck
14
In a command economy,how are decisions about how to allocate resources made?
A)by a lottery system
B)by individuals and firms interacting in markets coordinated by a price system
C)by the firms that have the most power in the market
D)by a central planning board
A)by a lottery system
B)by individuals and firms interacting in markets coordinated by a price system
C)by the firms that have the most power in the market
D)by a central planning board
Unlock Deck
Unlock for access to all 166 flashcards in this deck.
Unlock Deck
k this deck
15
What is the term for a system of economic organization in which the ownership and control of productive capital assets rests with the state,and resources are allocated through central planning and political decision making?
A)a command economy
B)a market economy
C)a corporate economy
D)a capitalist economy
A)a command economy
B)a market economy
C)a corporate economy
D)a capitalist economy
Unlock Deck
Unlock for access to all 166 flashcards in this deck.
Unlock Deck
k this deck
16
Which of society's questions does a market system answer?
A)"how" and "for whom" questions, but not the "what" question
B)"what," "how," and "for whom" questions
C)"what" and "who" questions, but not the "for whom" question
D)"what" and "for whom" questions, but not the "how" question
A)"how" and "for whom" questions, but not the "what" question
B)"what," "how," and "for whom" questions
C)"what" and "who" questions, but not the "for whom" question
D)"what" and "for whom" questions, but not the "how" question
Unlock Deck
Unlock for access to all 166 flashcards in this deck.
Unlock Deck
k this deck
17
Natural gas prices in Halifax,Nova Scotia,decrease because new wells are brought into production.At the same time,local oil prices rise because of increased shipping costs.As a result,what might you expect to find in the Halifax industrial sector?
A)Less natural gas will likely be used.
B)Oil consumption will likely be reduced.
C)Oil will be used to heat more homes.
D)Natural gas will be used to heat fewer homes.
A)Less natural gas will likely be used.
B)Oil consumption will likely be reduced.
C)Oil will be used to heat more homes.
D)Natural gas will be used to heat fewer homes.
Unlock Deck
Unlock for access to all 166 flashcards in this deck.
Unlock Deck
k this deck
18
What does a market economy depend on market mechanisms to do?
A)provide everyone with a minimum level of income
B)decide how much government regulation there should be
C)determine how large the government's budget deficit should be
D)determine the most efficient way of using resources
A)provide everyone with a minimum level of income
B)decide how much government regulation there should be
C)determine how large the government's budget deficit should be
D)determine the most efficient way of using resources
Unlock Deck
Unlock for access to all 166 flashcards in this deck.
Unlock Deck
k this deck
19
What is the circular flow of economic activity a model of?
A)the interaction among taxes, prices, and profits
B)the influence of government on business behaviour
C)the role of unions and government in the economy
D)the movement of goods, services, and payments between households and firms
A)the interaction among taxes, prices, and profits
B)the influence of government on business behaviour
C)the role of unions and government in the economy
D)the movement of goods, services, and payments between households and firms
Unlock Deck
Unlock for access to all 166 flashcards in this deck.
Unlock Deck
k this deck
20
Which of the following is NOT a resource exchanged in the factor markets?
A)land
B)wages
C)entrepreneurship
D)capital
A)land
B)wages
C)entrepreneurship
D)capital
Unlock Deck
Unlock for access to all 166 flashcards in this deck.
Unlock Deck
k this deck
21
FIGURE 2-2
Refer to Figure 2-2.Which of the following statements about a movement from Point C to Point B is the most accurate?
A)It involves sacrificing bread in order to produce a greater quantity of wine.
B)It involves sacrificing wine in order to produce a greater quantity of bread.
C)It involves no sacrifice of output, as the opportunity cost of production is zero everywhere along the production possibilities curve.
D)It will increase the level of unemployment in the economy.
Unlock Deck
Unlock for access to all 166 flashcards in this deck.
Unlock Deck
k this deck
22
If the production possibilities curve is a straight line,what does this illustrate?
A)Resources are not equally substitutable between productions of the goods because there is an increase in opportunity cost.
B)As an increasing quantity of resources is shifted from one manufacturing process to another, there is no increase in opportunity cost.
C)Opportunity costs are negative.
D)Opportunity costs increase as output of either commodity is expanded.
Unlock Deck
Unlock for access to all 166 flashcards in this deck.
Unlock Deck
k this deck
23
FIGURE 2-1
Refer to Figure 2-1.What does the arrow from the product markets to the firms represent?
A)revenue
B)goods and services sold
C)money income
D)wages, rent interest, and profits
Refer to Figure 2-1.What does the arrow from the product markets to the firms represent?
A)revenue
B)goods and services sold
C)money income
D)wages, rent interest, and profits
Unlock Deck
Unlock for access to all 166 flashcards in this deck.
Unlock Deck
k this deck
24
Along a straight-line production possibilities curve,which of the following best describes the opportunity costs of producing the good on the X-axis?
A)They are decreasing.
B)They are constant.
C)They are increasing.
D)They are varied.
A)They are decreasing.
B)They are constant.
C)They are increasing.
D)They are varied.
Unlock Deck
Unlock for access to all 166 flashcards in this deck.
Unlock Deck
k this deck
25
FIGURE 2-2
Refer to Figure 2-2.Which of the following statements best describes the opportunity cost of producing an additional cake?
A)It increases as the economy moves in a southeast direction along the production possibilities curve.
B)It decreases as the economy moves in a southeast direction along the production possibilities curve.
C)It remains constant as the economy moves in a southeast direction along the production possibilities curve.
D)It equals zero.
Unlock Deck
Unlock for access to all 166 flashcards in this deck.
Unlock Deck
k this deck
26
What market is land bought and sold in?
A)the services market
B)the goods market
C)the stock market
D)the factor market
A)the services market
B)the goods market
C)the stock market
D)the factor market
Unlock Deck
Unlock for access to all 166 flashcards in this deck.
Unlock Deck
k this deck
27
FIGURE 2-1
Refer to Figure 2-1.Which of the followings statements about payments for goods and services is the most accurate?
A)They are received by households in the factor market.
B)They are received by firms in the factor market.
C)They flow in a clockwise direction.
D)They flow in a counter-clockwise direction.
Unlock Deck
Unlock for access to all 166 flashcards in this deck.
Unlock Deck
k this deck
28
FIGURE 2-2
Refer to Figure 2-2.Which of the following statements about a movement from Point D to Point C is the most accurate?
A)It requires the sacrifice of four cupcakes in order to obtain one cake.
B)It requires the sacrifice of one cake in order to obtain four cupcakes.
C)It reallocates inputs without affecting overall levels of production.
D)It increases unemployment.
Unlock Deck
Unlock for access to all 166 flashcards in this deck.
Unlock Deck
k this deck
29
What does a straight-line production possibilities curve illustrate?
A)The opportunity cost of production does not vary along the curve.
B)The output combinations along the curve provide equal levels of satisfaction to consumers.
C)The opportunity cost of production of the good on the Y-axis increases as you move down along the curve.
D)The market price of the two goods is the same everywhere along the curve.
Unlock Deck
Unlock for access to all 166 flashcards in this deck.
Unlock Deck
k this deck
30
FIGURE 2-1
Refer to Figure 2-1.What does the arrow from the factor markets to the households represent?
A)wages, rent interest, and profits
B)revenue
C)money income
D)goods and services sold
Refer to Figure 2-1.What does the arrow from the factor markets to the households represent?
A)wages, rent interest, and profits
B)revenue
C)money income
D)goods and services sold
Unlock Deck
Unlock for access to all 166 flashcards in this deck.
Unlock Deck
k this deck
31
Ming-Na must write a political science term paper and prepare for an economics exam.The production possibilities curve between political science and economics preparation is a straight line.As time spent studying economics increases,what is the effect on the opportunity cost of studying for economics?
A)It increases.
B)It remains the same.
C)It first increases, then decreases.
D)It decreases.
A)It increases.
B)It remains the same.
C)It first increases, then decreases.
D)It decreases.
Unlock Deck
Unlock for access to all 166 flashcards in this deck.
Unlock Deck
k this deck
32
Capital,entrepreneurship,land,and labour are needed to produce goods and services.What are the respective payments for each of these factors of production?
A)profits, interest, rent, and wages and salaries
B)interest, profits, rent, and wages and salaries
C)interest, profits, wages and salaries, and rent
D)profits, rent, wages and salaries, and interest
A)profits, interest, rent, and wages and salaries
B)interest, profits, rent, and wages and salaries
C)interest, profits, wages and salaries, and rent
D)profits, rent, wages and salaries, and interest
Unlock Deck
Unlock for access to all 166 flashcards in this deck.
Unlock Deck
k this deck
33
FIGURE 2-1
Refer to Figure 2-1.What does the arrow from the firms to the factor markets represent?
A)wages, rent interest, and profits
B)goods and services sold
C)money income
D)revenue
Refer to Figure 2-1.What does the arrow from the firms to the factor markets represent?
A)wages, rent interest, and profits
B)goods and services sold
C)money income
D)revenue
Unlock Deck
Unlock for access to all 166 flashcards in this deck.
Unlock Deck
k this deck
34
FIGURE 2-2
Refer to Figure 2-2.Which of the following statements about a movement from Point G to Point F is the most accurate?
A)It involves sacrificing wine in order to produce a greater quantity of bread.
B)It will increase the level of unemployment in the economy.
C)It involves no sacrifice of output, as both more wine and bread can be produced if available resources are used more efficiently.
D)It involves sacrificing bread in order to produce a greater quantity of wine.
Unlock Deck
Unlock for access to all 166 flashcards in this deck.
Unlock Deck
k this deck
35
FIGURE 2-1
Refer to Figure 2-1.Which of the following statements about goods and services is the most accurate?
A)They are purchased by households in the factor market.
B)They flow in a clockwise direction.
C)They are sold by businesses in the factor market.
D)They flow in a counter clockwise direction.
Refer to Figure 2-1.Which of the following statements about goods and services is the most accurate?
A)They are purchased by households in the factor market.
B)They flow in a clockwise direction.
C)They are sold by businesses in the factor market.
D)They flow in a counter clockwise direction.
Unlock Deck
Unlock for access to all 166 flashcards in this deck.
Unlock Deck
k this deck
36
FIGURE 2-1
Refer to Figure 2-1.What does the arrow from the firms to the product markets represent?
A)money income
B)goods and services sold
C)revenue
D)wages, rent interest, and profits
Refer to Figure 2-1.What does the arrow from the firms to the product markets represent?
A)money income
B)goods and services sold
C)revenue
D)wages, rent interest, and profits
Unlock Deck
Unlock for access to all 166 flashcards in this deck.
Unlock Deck
k this deck
37
FIGURE 2-2
Refer to Figure 2-2.Which of the following statements about a movement from Point B to Point C is the most accurate?
A)It involves sacrificing bread in order to produce a greater quantity of wine.
B)It involves no sacrifice, as the opportunity cost of production is zero everywhere along the production possibilities curve.
C)It involves sacrificing wine in order to produce a greater quantity of bread.
D)It will increase the level of unemployment in the economy.
Unlock Deck
Unlock for access to all 166 flashcards in this deck.
Unlock Deck
k this deck
38
Which of the following statements about the production possibilities curve is the most accurate?
A)It is a curve that shows the quantity of output that will be offered for sale at various prices.
B)It is a graph that shows the various combinations of output it is possible for an economy to produce given its available resources and technology.
C)It is a graph that shows the combinations of output that are most profitable to produce.
D)It is a graph that shows the various combinations of resources that can be used to produce a given level of output.
Unlock Deck
Unlock for access to all 166 flashcards in this deck.
Unlock Deck
k this deck
39
What does a linear (straight line)production possibilities curve illustrate?
A)a trade-off in which the opportunity cost of a good increases with the level of its production
B)a trade-off in which the opportunity cost of a good is constant at all levels of production
C)a trade-off in which the opportunity cost is zero with all levels of production
D)a trade-off in which the opportunity cost of a good decreases with the level of its production
Unlock Deck
Unlock for access to all 166 flashcards in this deck.
Unlock Deck
k this deck
40
FIGURE 2-2
Refer to Figure 2-2.What is the opportunity cost of producing an additional cake equal to?
A)1/4 of a cupcake
B)4 cupcakes
C)10 cupcakes
D)40 cupcakes
Refer to Figure 2-2.What is the opportunity cost of producing an additional cake equal to?
A)1/4 of a cupcake
B)4 cupcakes
C)10 cupcakes
D)40 cupcakes
Unlock Deck
Unlock for access to all 166 flashcards in this deck.
Unlock Deck
k this deck
41
FIGURE 2-3
Refer to Figure 2-3.What is the most inefficient point depicted?
A)Point A
B)Point C
C)Point D
D)Point G
Refer to Figure 2-3.What is the most inefficient point depicted?
A)Point A
B)Point C
C)Point D
D)Point G
Unlock Deck
Unlock for access to all 166 flashcards in this deck.
Unlock Deck
k this deck
42
FIGURE 2-3
Refer to Figure 2-3.Which of the following movements will result in an increase in the quantity of both capital and consumption goods produced this period?
A)a movement from Point D to Point F
B)a movement from Point F to Point D
C)a movement from Point B to Point A
D)a movement from Point F to Point A
Unlock Deck
Unlock for access to all 166 flashcards in this deck.
Unlock Deck
k this deck
43
FIGURE 2-3
Refer to Figure 2-3.Considering only points on the frontier,at what point will the economy experience the least amount of economic growth over time (ceteris paribus)?
A)Point A
B)Point C
C)Point E
D)Point F
Refer to Figure 2-3.Considering only points on the frontier,at what point will the economy experience the least amount of economic growth over time (ceteris paribus)?
A)Point A
B)Point C
C)Point E
D)Point F
Unlock Deck
Unlock for access to all 166 flashcards in this deck.
Unlock Deck
k this deck
44
FIGURE 2-3
Refer to Figure 2-3.At which point is it currently not possible to produce?
A)Point A
B)Point B
C)Point E
D)Point G
Refer to Figure 2-3.At which point is it currently not possible to produce?
A)Point A
B)Point B
C)Point E
D)Point G
Unlock Deck
Unlock for access to all 166 flashcards in this deck.
Unlock Deck
k this deck
45
Why is a production possibilities curve negatively sloped?
A)Along the curve, production of one good must be sacrificed in order to increase production of another.
B)Unemployment increases as an economy moves down along the curve.
C)As the price falls, more goods are purchased.
D)Unemployment decreases as an economy moves down along the curve.
A)Along the curve, production of one good must be sacrificed in order to increase production of another.
B)Unemployment increases as an economy moves down along the curve.
C)As the price falls, more goods are purchased.
D)Unemployment decreases as an economy moves down along the curve.
Unlock Deck
Unlock for access to all 166 flashcards in this deck.
Unlock Deck
k this deck
46
FIGURE 2-3
Refer to Figure 2-3.Which of the following movements will result in a decrease in the production of capital goods but an increase in the production of consumption goods this period?
A)a movement from Point A to Point B
B)a movement from Point C to Point E
C)a movement from Point D to Point G
D)a movement from Point B to Point A
Unlock Deck
Unlock for access to all 166 flashcards in this deck.
Unlock Deck
k this deck
47
FIGURE 2-3
Refer to Figure 2-3.An economy is operating at full employment,and then workers in the bread industry are laid off.How is this change portrayed on the production possibilities curve?
A)as a movement from A to B
B)as a movement from B to E
C)as a movement from C to F
D)as a movement from G to F
Refer to Figure 2-3.An economy is operating at full employment,and then workers in the bread industry are laid off.How is this change portrayed on the production possibilities curve?
A)as a movement from A to B
B)as a movement from B to E
C)as a movement from C to F
D)as a movement from G to F
Unlock Deck
Unlock for access to all 166 flashcards in this deck.
Unlock Deck
k this deck
48
FIGURE 2-3
Refer to Figure 2-3.What is the most efficient point of production depicted?
A)Point D
B)Point E
C)Point F
D)Point G
Refer to Figure 2-3.What is the most efficient point of production depicted?
A)Point D
B)Point E
C)Point F
D)Point G
Unlock Deck
Unlock for access to all 166 flashcards in this deck.
Unlock Deck
k this deck
49
Which of the following illustrates excessive unemployment of resources on a production possibilities curve?
A)an inward shift of the curve
B)a point inside the curve
C)a movement along the curve in a northwest direction
D)an outward shift of the curve
A)an inward shift of the curve
B)a point inside the curve
C)a movement along the curve in a northwest direction
D)an outward shift of the curve
Unlock Deck
Unlock for access to all 166 flashcards in this deck.
Unlock Deck
k this deck
50
FIGURE 2-4
Refer to Figure 2-4.Currently,which point is impossible to achieve?
A)Point A
B)Point C
C)Point E
D)Point G
Refer to Figure 2-4.Currently,which point is impossible to achieve?
A)Point A
B)Point C
C)Point E
D)Point G
Unlock Deck
Unlock for access to all 166 flashcards in this deck.
Unlock Deck
k this deck
51
Under what circumstances will an economy's production possibility curve be a straight line?
A)if the opportunity cost of production of a good is constant as more of it is produced
B)if the opportunity cost of production of a good decreases as more of it is produced
C)if resources are not equally substitutable among productive tasks
D)if the economy experiences significant unemployment
A)if the opportunity cost of production of a good is constant as more of it is produced
B)if the opportunity cost of production of a good decreases as more of it is produced
C)if resources are not equally substitutable among productive tasks
D)if the economy experiences significant unemployment
Unlock Deck
Unlock for access to all 166 flashcards in this deck.
Unlock Deck
k this deck
52
FIGURE 2-3
Refer to Figure 2-3.Which of the following statements about Point A is most accurate?
A)The economy is operating inefficiently at Point A.
B)Both wine and bread are produced at Point A.
C)Only wine is produced at Point A.
D)Only bread is produced at Point A.
Refer to Figure 2-3.Which of the following statements about Point A is most accurate?
A)The economy is operating inefficiently at Point A.
B)Both wine and bread are produced at Point A.
C)Only wine is produced at Point A.
D)Only bread is produced at Point A.
Unlock Deck
Unlock for access to all 166 flashcards in this deck.
Unlock Deck
k this deck
53
Using the production possibilities curve,which of the following illustrates an inefficient use of resources?
A)a movement off the curve in a southwest direction
B)a movement to the southeast along the curve
C)a movement to the northeast along the curve
D)a movement off the curve in a northeast direction
A)a movement off the curve in a southwest direction
B)a movement to the southeast along the curve
C)a movement to the northeast along the curve
D)a movement off the curve in a northeast direction
Unlock Deck
Unlock for access to all 166 flashcards in this deck.
Unlock Deck
k this deck
54
FIGURE 2-3
Refer to Figure 2-3.Comparatively,at which point is the opportunity cost of one more unit of a consumption good greater?
A)It is greater at Point C than at Point D.
B)It is greater at Point D than at Point E.
C)It is greater at Point E than at Point D.
D)It is greater at Point B than at Point A.
Refer to Figure 2-3.Comparatively,at which point is the opportunity cost of one more unit of a consumption good greater?
A)It is greater at Point C than at Point D.
B)It is greater at Point D than at Point E.
C)It is greater at Point E than at Point D.
D)It is greater at Point B than at Point A.
Unlock Deck
Unlock for access to all 166 flashcards in this deck.
Unlock Deck
k this deck
55
If additional units of output could be produced at constant opportunity cost,what would the shape of the production possibilities curve be?
A)positively sloped
B)a straight line with a negative slope
C)bowed inward toward the origin
D)bowed outward away from the origin
A)positively sloped
B)a straight line with a negative slope
C)bowed inward toward the origin
D)bowed outward away from the origin
Unlock Deck
Unlock for access to all 166 flashcards in this deck.
Unlock Deck
k this deck
56
FIGURE 2-3
Refer to Figure 2-3.At which point is the opportunity cost of one more unit of a capital good greater?
A)It is greater at Point F than at Point E.
B)It is greater at Point D than at Point E.
C)It is greater at Point E than at Point D.
D)It is greater at Point B than at Point A.
Refer to Figure 2-3.At which point is the opportunity cost of one more unit of a capital good greater?
A)It is greater at Point F than at Point E.
B)It is greater at Point D than at Point E.
C)It is greater at Point E than at Point D.
D)It is greater at Point B than at Point A.
Unlock Deck
Unlock for access to all 166 flashcards in this deck.
Unlock Deck
k this deck
57
What is assumed when an economy's production possibilities curve for a year is drawn?
A)There is a fixed quantity of resources and technology that is changing along the curve.
B)There is a fixed quantity of available resources and an unchanging level of technology.
C)The productivity of resources increases continually.
D)There is an unchanging level of technology and a changing quantity of resources.
Unlock Deck
Unlock for access to all 166 flashcards in this deck.
Unlock Deck
k this deck
58
FIGURE 2-3
Refer to Figure 2-3.Which of the following movements will result in an increase in the production of capital goods but a decrease in the production of consumption goods this period?
A)a movement from Point E to Point D
B)a movement from Point B to Point A
C)a movement from Point D to Point G
D)a movement from Point A to Point B
Unlock Deck
Unlock for access to all 166 flashcards in this deck.
Unlock Deck
k this deck
59
FIGURE 2-3
Refer to Figure 2-3.Other things being equal,where would the economy operate in order to achieve the greatest economic growth over time?
A)Point A
B)Point B
C)Point C
D)Point E
Refer to Figure 2-3.Other things being equal,where would the economy operate in order to achieve the greatest economic growth over time?
A)Point A
B)Point B
C)Point C
D)Point E
Unlock Deck
Unlock for access to all 166 flashcards in this deck.
Unlock Deck
k this deck
60
Which of the following is the most accurate statement about a production possibilities curve?
A)An economy can produce only on its production possibilities curve.
B)An economy can produce at any point inside its production possibilities curve, but not on or outside the curve.
C)An economy can produce at any point inside or outside its production possibilities curve.
D)An economy can produce at any point on or inside its production possibilities curve, but not outside the curve.
Unlock Deck
Unlock for access to all 166 flashcards in this deck.
Unlock Deck
k this deck
61
FIGURE 2-4
Refer to Figure 2-4.If the economy chooses to shift more of its resources into clothing,what will it have to give up?
A)smaller and smaller amounts of food per unit of added clothing as the quantity of clothing produced increases
B)nothing, since food and clothing are not substitutes
C)larger and larger amounts of food per unit of added clothing as the quantity of clothing produced increases
D)relatively equal amounts of food per unit of added clothing as the quantity of clothing produced increases
Unlock Deck
Unlock for access to all 166 flashcards in this deck.
Unlock Deck
k this deck
62
FIGURE 2-6
Refer to Figure 2-6.The diagram represents a trade-off in an economy between prison cells and classrooms.Which position represents the choice to allocate the greatest amount of resources to producing classrooms?
A)Point A
B)Point B
C)Point C
D)Point D
Refer to Figure 2-6.The diagram represents a trade-off in an economy between prison cells and classrooms.Which position represents the choice to allocate the greatest amount of resources to producing classrooms?
A)Point A
B)Point B
C)Point C
D)Point D
Unlock Deck
Unlock for access to all 166 flashcards in this deck.
Unlock Deck
k this deck
63
FIGURE 2-8
Refer to Figure 2-8.Assume the economy is operating at Point D.What is the opportunity cost of moving to Point B?
A)about 200 bushels of wheat
B)about 200 bushels of soybeans
C)zero
D)infinite, as Point B cannot be produced at any cost
Refer to Figure 2-8.Assume the economy is operating at Point D.What is the opportunity cost of moving to Point B?
A)about 200 bushels of wheat
B)about 200 bushels of soybeans
C)zero
D)infinite, as Point B cannot be produced at any cost
Unlock Deck
Unlock for access to all 166 flashcards in this deck.
Unlock Deck
k this deck
64
When resources are used efficiently,what is the only way you can produce more of one good,ceteris paribus?
A)by charging a lower price for the good
B)by producing less of another good
C)by charging a higher price for the good
D)by printing more money so you can buy more goods
A)by charging a lower price for the good
B)by producing less of another good
C)by charging a higher price for the good
D)by printing more money so you can buy more goods
Unlock Deck
Unlock for access to all 166 flashcards in this deck.
Unlock Deck
k this deck
65
FIGURE 2-6
Refer to Figure 2-6.If the economy moves from Point C to Point A,what is the result?
A)There is no net change in the number of prison cells and classrooms, as all points on the frontier are equally efficient.
B)More prison cells are created.
C)It sacrifices an increasing quantity of classrooms per prison cell produced the further the movement toward Point A.
D)More classrooms are created.
Unlock Deck
Unlock for access to all 166 flashcards in this deck.
Unlock Deck
k this deck
66
FIGURE 2-4
Refer to Figure 2-4.Which of the following points corresponds to an economy experiencing significant unemployment and/or producing inefficiently?
A)Point A
B)Point C
C)Point E
D)Point F
Refer to Figure 2-4.Which of the following points corresponds to an economy experiencing significant unemployment and/or producing inefficiently?
A)Point A
B)Point C
C)Point E
D)Point F
Unlock Deck
Unlock for access to all 166 flashcards in this deck.
Unlock Deck
k this deck
67
What does the production possibilities curve illustrate?
A)the minimum quantities of output that can be produced using available resources
B)the minimum quantity of two resources necessary to produce a given level of output
C)that when resources are currently being used efficiently, it is possible to increase production of one good only by sacrificing some of another good
D)that when resources are currently being used inefficiently, it is possible to increase production of one good only by sacrificing some of another good
Unlock Deck
Unlock for access to all 166 flashcards in this deck.
Unlock Deck
k this deck
68
FIGURE 2-7
Refer to Figure 2-7.What does Point A indicate about the economy?
A)It is not using its resources efficiently.
B)It is using its resources efficiently to produce both food and clothing.
C)It is using its resources efficiently while producing food but no clothing.
D)It is using its resources efficiently while producing clothing but no food.
Unlock Deck
Unlock for access to all 166 flashcards in this deck.
Unlock Deck
k this deck
69
FIGURE 2-4
Refer to Figure 2-4.For this economy,what is the most preferred point to produce at?
A)Point A
B)Point B
C)Point D
D)Point G
Refer to Figure 2-4.For this economy,what is the most preferred point to produce at?
A)Point A
B)Point B
C)Point D
D)Point G
Unlock Deck
Unlock for access to all 166 flashcards in this deck.
Unlock Deck
k this deck
70
FIGURE 2-7
Refer to Figure 2-7.What does Point B indicate about the economy?
A)It is using its resources efficiently while producing food but no clothing.
B)It is using its resources efficiently to produce both food and clothing.
C)It is not using its resources efficiently.
D)It is using its resources efficiently while producing clothing but no food.
Unlock Deck
Unlock for access to all 166 flashcards in this deck.
Unlock Deck
k this deck
71
FIGURE 2-8
Refer to Figure 2-8.In order to move from Point B to Point C,what will the economy have to give up?
A)300 bushels of wheat
B)200 bushels of soybeans
C)200 bushels of wheat
D)100 bushels of soybeans
Refer to Figure 2-8.In order to move from Point B to Point C,what will the economy have to give up?
A)300 bushels of wheat
B)200 bushels of soybeans
C)200 bushels of wheat
D)100 bushels of soybeans
Unlock Deck
Unlock for access to all 166 flashcards in this deck.
Unlock Deck
k this deck
72
FIGURE 2-8
Refer to Figure 2-8.In order for the economy to move from Point B to Point E at a given point in time,what would it have to do?
A)Sacrifice wheat in favour of more soybeans.
B)Sacrifice soybeans in favour of more wheat.
C)Stop wasting resources.
D)Increase the productive capabilities of the economy.
Unlock Deck
Unlock for access to all 166 flashcards in this deck.
Unlock Deck
k this deck
73
Any point NOT on the production possibilities curve cannot be optimal.What reasoning supports this?
A)Operating inside the curve means sacrificing economic growth for current consumption, and economic growth is always a goal worth pursuing.
B)Operating inside the curve leads to inflation and inflation can be very costly.
C)Operating inside the curve is inefficient and represents wasted resources.
D)A point inside the curve implies that society is not facing up to the problem of scarcity.
Unlock Deck
Unlock for access to all 166 flashcards in this deck.
Unlock Deck
k this deck
74
FIGURE 2-5
Refer to Figure 2.5.How could Point D be described?
A)It is inefficient.
B)It is beyond the society's productive capability.
C)It is unattainable.
D)It is preferable to Point A.
Refer to Figure 2.5.How could Point D be described?
A)It is inefficient.
B)It is beyond the society's productive capability.
C)It is unattainable.
D)It is preferable to Point A.
Unlock Deck
Unlock for access to all 166 flashcards in this deck.
Unlock Deck
k this deck
75
FIGURE 2-6
Refer to Figure 2-6.The diagram represents a trade-off in an economy between prison cells and classrooms.Which position represents the choice to allocate the greatest amount of resources to producing prison cells?
A)Point A
B)Point B
C)Point C
D)Point D
Refer to Figure 2-6.The diagram represents a trade-off in an economy between prison cells and classrooms.Which position represents the choice to allocate the greatest amount of resources to producing prison cells?
A)Point A
B)Point B
C)Point C
D)Point D
Unlock Deck
Unlock for access to all 166 flashcards in this deck.
Unlock Deck
k this deck
76
FIGURE 2-8
Refer to Figure 2-8.In order to move from Point D to Point C,what will the economy have to give up?
A)200 bushels of soybeans
B)200 bushels of wheat
C)100 bushels of wheat
D)nothing
Refer to Figure 2-8.In order to move from Point D to Point C,what will the economy have to give up?
A)200 bushels of soybeans
B)200 bushels of wheat
C)100 bushels of wheat
D)nothing
Unlock Deck
Unlock for access to all 166 flashcards in this deck.
Unlock Deck
k this deck
77
FIGURE 2-5
Refer to Figure 2.5.How would Point A be described?
A)It is efficient.
B)It is preferable to Point D.
C)It is inefficient.
D)It is unattainable.
Refer to Figure 2.5.How would Point A be described?
A)It is efficient.
B)It is preferable to Point D.
C)It is inefficient.
D)It is unattainable.
Unlock Deck
Unlock for access to all 166 flashcards in this deck.
Unlock Deck
k this deck
78
FIGURE 2-4
Refer to Figure 2-4.Which of the following statements about the movement from Point D to Point E is the most accurate?
A)It results in an increase in the production of both capital and consumption goods this period.
B)It results in an increase in the production of capital goods but a decrease in the production of consumption goods this period.
C)It does not change the level of output produced since both points are on the production possibilities curve.
D)It results in an increase in the production of consumption goods but a decrease in the production of capital goods this period.
Unlock Deck
Unlock for access to all 166 flashcards in this deck.
Unlock Deck
k this deck
79
An economy is producing two goods,ice cream and cookies,and is currently operating efficiently.Under what circumstances can this economy produce more cookies?
A)if it increases the price of cookies
B)if it produces less ice cream
C)if it increases the price of ice cream
D)if more of the economy's resources become idle
A)if it increases the price of cookies
B)if it produces less ice cream
C)if it increases the price of ice cream
D)if more of the economy's resources become idle
Unlock Deck
Unlock for access to all 166 flashcards in this deck.
Unlock Deck
k this deck
80
FIGURE 2-7
Refer to Figure 2-7.What happens in the economy when production moves from Point A to Point B?
A)The economy increases production of clothing, but not food.
B)The economy operates at its productive capacity once it reaches Point B.
C)The economy increases production of food, but not clothing.
D)The economy is using its resources inefficiently to produce both food and clothing.
Unlock Deck
Unlock for access to all 166 flashcards in this deck.
Unlock Deck
k this deck
Unlock Deck
Unlock for access to all 166 flashcards in this deck.


