Deck 21: Quantitative Data Analysis
Full screen (f)
Question
Question
Question
Question
Question
Question
Question
Question
Question
Question
Question
Question
Question
Question
Question
Question
Question
Question
Question
Question
Question
Question
Question
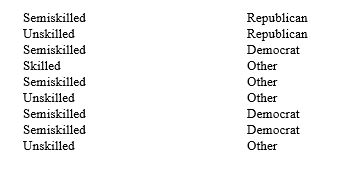
A researcher believes that a person's occupation affects his or her political party preference.Given the following data on occupation and political party preference,construct a contingency table.Percentage the table and interpret your results.
Question
Question
Question
Question
Question
Question
Question
Question
Question
Question
Interpret the following frequency distribution portraying client responses to the question,"How satisfied are you with the services you've received from this agency?"

Question
Question
Question
Question
Question
Question

Unlock Deck
Sign up to unlock the cards in this deck!
Unlock Deck
Unlock Deck
1/39
Play
Full screen (f)
Deck 21: Quantitative Data Analysis
1
The mosrequent attribute,in either grouped or ungrouped data,is the
A) mean.
B) median.
C) mode.
D) range.
E) marginal.
A) mean.
B) median.
C) mode.
D) range.
E) marginal.
C
2
Which of the following measures of central tendency can be used at any level of measurement?
A) Mean
B) Mode
C) Median
D) Standard deviation
A) Mean
B) Mode
C) Median
D) Standard deviation
B
3
If the standard deviation equals 0,we may conclude
A) that there is no dispersion in the data.
B) that the mean is a poor measure of the average.
C) that the data have a great deal of dispersion.
D) The mode is 0.
A) that there is no dispersion in the data.
B) that the mean is a poor measure of the average.
C) that the data have a great deal of dispersion.
D) The mode is 0.
A
4
A research article reports that the mean number of group treatment sessions attended by a sample of people was 20,with a median of 12 and a mode of 10.Which of the following statements is/are true about the sample?
A)It is normally distributed.
B) Some people attended much more than 20 sessions.
C) Most people attended about 15 to 20 sessions.
D) More than half the sample attended exactly 10 sessions.
A)It is normally distributed.
B) Some people attended much more than 20 sessions.
C) Most people attended about 15 to 20 sessions.
D) More than half the sample attended exactly 10 sessions.
Unlock Deck
Unlock for access to all 39 flashcards in this deck.
Unlock Deck
k this deck
5
Given the following values,the median is 4,8,5,11,13,7,9,10,3
A) 8
B) 13
C) 7.8
D) 5
A) 8
B) 13
C) 7.8
D) 5
Unlock Deck
Unlock for access to all 39 flashcards in this deck.
Unlock Deck
k this deck
6
Which of the following guidelines should be kept in mind when coding?
A) the coding scheme should be appropriate to the analysis intended in the study.
B) data should be coded in less detail than the researcher intends to use in the analysis.
C) the reliability of the coders can be assumed.
D) Codes cannot be generated from data that has already been collected.
A) the coding scheme should be appropriate to the analysis intended in the study.
B) data should be coded in less detail than the researcher intends to use in the analysis.
C) the reliability of the coders can be assumed.
D) Codes cannot be generated from data that has already been collected.
Unlock Deck
Unlock for access to all 39 flashcards in this deck.
Unlock Deck
k this deck
7
A measure of dispersion describes
A) where the data are clustered.
B) which data are the most important.
C) how spread out the data are.
D) the central tendency.
A) where the data are clustered.
B) which data are the most important.
C) how spread out the data are.
D) the central tendency.
Unlock Deck
Unlock for access to all 39 flashcards in this deck.
Unlock Deck
k this deck
8
Professor Jones asked respondents for the exact number of times they had to evacuate their home because of a hurricane.Jones,therefore,is measuring this variable at the ________ level.
A) nominal
B) interval
C) ratio
D) ordinal
A) nominal
B) interval
C) ratio
D) ordinal
Unlock Deck
Unlock for access to all 39 flashcards in this deck.
Unlock Deck
k this deck
9
A research article reports that the number of group treatment sessions attended by a sample was normally distributed,with a mean of 20 and a standard deviation of 6.Which of the following statements is/are true about the sample?
A)Over 75% attended at least 20 sessions.
B) Over one-third attended more than 26 sessions.
C) Slightly more than 15 % attended less than 14 sessions.
D) Slightly more than 15 % attended less than 8 sessions.
A)Over 75% attended at least 20 sessions.
B) Over one-third attended more than 26 sessions.
C) Slightly more than 15 % attended less than 14 sessions.
D) Slightly more than 15 % attended less than 8 sessions.
Unlock Deck
Unlock for access to all 39 flashcards in this deck.
Unlock Deck
k this deck
10
Coding refers to
A) the assignment of a number or numeral to the attributes of a variable.
B) the assignment of a row in a data matrix to each questionnaire item.
C) the assignment of a number or numeral to each questionnaire item.
D) transferring variables to the computer.
E)the assignment of a variable to a computer column.
Unlock Deck
Unlock for access to all 39 flashcards in this deck.
Unlock Deck
k this deck
11
A researcher measured attitudes about a proposed health reform bill with the categories strongly agree,agree,indifferent,disagree,and strongly disagree.The researcher was using the ______ level of measurement.
A) nominal
B) interval
C) ratio
D) ordinal
A) nominal
B) interval
C) ratio
D) ordinal
Unlock Deck
Unlock for access to all 39 flashcards in this deck.
Unlock Deck
k this deck
12
The following line of coded data applies to the codebook given in question 5:121.This line of codes
A) represents a full-time female student with a direct practice concentration.
B) represents a full-time male student with a clinical concentration.
C) represents a part-time male student with a mental health concentration.
D) represents a part-time female student with a micro concentration.
A) represents a full-time female student with a direct practice concentration.
B) represents a full-time male student with a clinical concentration.
C) represents a part-time male student with a mental health concentration.
D) represents a part-time female student with a micro concentration.
Unlock Deck
Unlock for access to all 39 flashcards in this deck.
Unlock Deck
k this deck
13
In reading a table that someone else has constructed,the rule of thumb is
A) if the table is percentaged down, read across, and if the table is percentaged across, read down.
B) if the table is percentaged down, read down.
C) if the table is percentaged across, read across.
D)The direction you read does not matter.
A) if the table is percentaged down, read across, and if the table is percentaged across, read down.
B) if the table is percentaged down, read down.
C) if the table is percentaged across, read across.
D)The direction you read does not matter.
Unlock Deck
Unlock for access to all 39 flashcards in this deck.
Unlock Deck
k this deck
14
Given the following age distribution,the mean is 16,31,5,30,4,3,2
A) 2
B) 5
C) 13
D) 30
A) 2
B) 5
C) 13
D) 30
Unlock Deck
Unlock for access to all 39 flashcards in this deck.
Unlock Deck
k this deck
15
Which of the following statements is true about data processing?
A) It is best to run your data analyses immediately after you enter your data.
B) Computers will automatically correct data entry errors.
C) Using possible code cleaning, you examine the distribution of responses to each item to see if some responses exisor codes you didn't use.
D) None of these statements is true
Unlock Deck
Unlock for access to all 39 flashcards in this deck.
Unlock Deck
k this deck
16
Your codebook contains codes 1,2,and 9 for the variable "religion." Your data show a single code of 5 in the distribution on religion.You should
A) assume this is a random error and ignore it.
B) do possible-code cleaning.
C) do contingency cleaning.
D) do some data analysis.
E none of the above.
A) assume this is a random error and ignore it.
B) do possible-code cleaning.
C) do contingency cleaning.
D) do some data analysis.
E none of the above.
Unlock Deck
Unlock for access to all 39 flashcards in this deck.
Unlock Deck
k this deck
17
Assuming that there are no missing data,which line of three codes would reflect a data entry error for at least one of the following three variables: gender male or female; whether currently incarcerated yes or no; and ethnicity White/not Hispanic,African American,Hispanic,Asian American,Other?
A) 2 2 3
B) 3 3 6
C) 1 2 4
D) 2 1 5
A) 2 2 3
B) 3 3 6
C) 1 2 4
D) 2 1 5
Unlock Deck
Unlock for access to all 39 flashcards in this deck.
Unlock Deck
k this deck
18
The following information was found in a codebook about social work students:
COLUMNS DESCRIPTION
1 Enrollment status
1 = Full-time
2 = Part-time
3 = Other
4 Gender
1 = male
2 = female
5 Concentration
1 = Direct practice
2 = Clinical
3 = Micro
4 = Macro
5 = Communities
6 = Administration
7 = Child welfare
8 = Mental health
Which of the following statements is true concerning the codebook?
A) The variables in this codebook are male, female, and concentration.
B) Gender has been coded so that the categories are mutually exclusive and exhaustive.
C) Concentration has been coded so that the categories are mutually exclusive and exhaustive.
D) None of these statements is true.
Unlock Deck
Unlock for access to all 39 flashcards in this deck.
Unlock Deck
k this deck
19
Which of the following illustrates a grouped data frequency distribution?
A) 36 students are enrolled in introductory statistics, section A.
B) 5 new students have been accepted on the editorial staff of their school paper.Two of the students are 18 years of age, one is 19 years, and two are 21 years of age.
C) of the 20 female students living in a housing complex, 10 are under 20 years of age, one is between 20 and 25 years, seven are between 26 and 30 years, and two are above 30 years.
D) none of these.
Unlock Deck
Unlock for access to all 39 flashcards in this deck.
Unlock Deck
k this deck
20
An example of multivariate analysis would be
A) an examination of the ages of all women who are corporate executives.
B) an analysis of the relationship among age, sex, and type of nightsporequented in a given city in the Midwest.
C) an analysis of the relationship that exists between types of undergraduate major and position held in business.
D) an analysis of the relationship between type of offense and length of prison sentence for those who had a jury trial.
Unlock Deck
Unlock for access to all 39 flashcards in this deck.
Unlock Deck
k this deck
21
Univariate analysis is the examination of the distribution of cases on only one variable at a time.
Unlock Deck
Unlock for access to all 39 flashcards in this deck.
Unlock Deck
k this deck
22
What is a codebook? Construct a codebook for the following questionnaire items:
(a) Gender
( ) male
( ) female
(b) Age at last birthday?
(c) How many brothers and sisters do you have? (Count only those who are now alive.Include stepbrothers and stepsisters and children adopted by your parents.)
(d) What is your marital status?
( ) married
( ) widowed
( ) divorced
( ) separated
( ) never married
Unlock Deck
Unlock for access to all 39 flashcards in this deck.
Unlock Deck
k this deck
23
A researcher believes that a person's occupation affects his or her political party preference.Given the following data on occupation and political party preference,construct a contingency table.Percentage the table and interpret your results.
Unlock Deck
Unlock for access to all 39 flashcards in this deck.
Unlock Deck
k this deck
24
Why do percentages allow us to compare two or more frequency distributions? Give examples.
Unlock Deck
Unlock for access to all 39 flashcards in this deck.
Unlock Deck
k this deck
25
What is the purpose of data cleaning? How is it done?
Unlock Deck
Unlock for access to all 39 flashcards in this deck.
Unlock Deck
k this deck
26
Grouped data are created through the combination of attributes of a variable.
Unlock Deck
Unlock for access to all 39 flashcards in this deck.
Unlock Deck
k this deck
27
An interval variable is a discrete variable.
Unlock Deck
Unlock for access to all 39 flashcards in this deck.
Unlock Deck
k this deck
28
No detail is lost when using an ungrouped frequency distribution.
Unlock Deck
Unlock for access to all 39 flashcards in this deck.
Unlock Deck
k this deck
29
A bivariate table is read by comparing the independent variable
subgroups with one another in terms of a given attribute of the
dependent variable.
subgroups with one another in terms of a given attribute of the
dependent variable.
Unlock Deck
Unlock for access to all 39 flashcards in this deck.
Unlock Deck
k this deck
30
The range is smaller than the interquartile range.
Unlock Deck
Unlock for access to all 39 flashcards in this deck.
Unlock Deck
k this deck
31
Half the cases are above the median and half the cases are below the median.
Unlock Deck
Unlock for access to all 39 flashcards in this deck.
Unlock Deck
k this deck
32
In a well-constructed table,readers will have to read the narrative text of the report before they will be able to tell what each variable in the table is and interpret the overall meaning of the table.
Unlock Deck
Unlock for access to all 39 flashcards in this deck.
Unlock Deck
k this deck
33
Interpret the following frequency distribution portraying client responses to the question,"How satisfied are you with the services you've received from this agency?"
Unlock Deck
Unlock for access to all 39 flashcards in this deck.
Unlock Deck
k this deck
34
Using a hypothetical example,illustrate how blending descriptive statistics with a qualitative inquiry can enhance the value of the qualitative inquiry as well as the interpretation of the descriptive statistics.
Unlock Deck
Unlock for access to all 39 flashcards in this deck.
Unlock Deck
k this deck
35
A codebook is a guide for locating variables and interpreting entries in one's data file.
Unlock Deck
Unlock for access to all 39 flashcards in this deck.
Unlock Deck
k this deck
36
The following is an acceptable coding scheme for the variable "religion": 1=Protestant,2=Catholic,3=Jewish,9=Not reported.
Unlock Deck
Unlock for access to all 39 flashcards in this deck.
Unlock Deck
k this deck
37
The mean is almost always sufficient in portraying the typical case in a distribution.
Unlock Deck
Unlock for access to all 39 flashcards in this deck.
Unlock Deck
k this deck
38
The mean or median can be used to describe the central tendency of the variable "ethnicity."
Unlock Deck
Unlock for access to all 39 flashcards in this deck.
Unlock Deck
k this deck
39
Provide an example of how descriptive statistics can be used in qualitative research.
Unlock Deck
Unlock for access to all 39 flashcards in this deck.
Unlock Deck
k this deck
Unlock Deck
Unlock for access to all 39 flashcards in this deck.


