Deck 8: Estimation: Additional Topics
Full screen (f)
Question
THE NEXT QUESTIONS ARE BASED ON THE FOLLOWING INFORMATION:
A dependent random sample from two normally distributed populations gives the following results:
n = 20,
= 26.5,s2 = 3.2
Calculate the margin of error for the given data assuming 95% confidence level: nx = 250
x = 0.65 ny = 360
y = 0.78
A)0.085
B)1.05
C)0.052
D)0.072
A dependent random sample from two normally distributed populations gives the following results:
n = 20,
= 26.5,s2 = 3.2
Calculate the margin of error for the given data assuming 95% confidence level: nx = 250
x = 0.65 ny = 360
y = 0.78
A)0.085
B)1.05
C)0.052
D)0.072
Question
THE NEXT QUESTIONS ARE BASED ON THE FOLLOWING INFORMATION:
For constructing a 95% confidence interval estimate for the difference between the means of two normally distributed populations,where the unknown population variances are assumed not to be equal,the summary statistics computed from two independent samples are as follows:
n1 = 50,
1 = 175,s1 = 18.5,n2 = 42,
2 = 158,and s2 = 32.4
What is the upper confidence limit of the 95% confidence interval for the difference between the means?
A)19.123
B)28.279
C)24.911
D)5)788
Question
Question
THE NEXT QUESTIONS ARE BASED ON THE FOLLOWING INFORMATION:
A dependent random sample from two normally distributed populations gives the following results:
n = 20,
= 26.5,s2 = 3.2
The pooled variance is formed by combining information from two independent samples.
If
= 39,
= 25,and n1 = n2 = 12 then
Is equal to:
A)31
B)45
C)30
D)32
A dependent random sample from two normally distributed populations gives the following results:
n = 20,
= 26.5,s2 = 3.2
The pooled variance
is formed by combining information from two independent samples.If
= 39,
= 25,and n1 = n2 = 12 then
Is equal to:
A)31
B)45
C)30
D)32
Question
Question
THE NEXT QUESTIONS ARE BASED ON THE FOLLOWING INFORMATION:
A dependent random sample from two normally distributed populations gives the following results:
n = 20,
= 26.5,s2 = 3.2
Find the width of the 98% confidence interval.
A)5.46
B)3.64
C)0.91
D)0.60
A dependent random sample from two normally distributed populations gives the following results:
n = 20,
= 26.5,s2 = 3.2
Find the width of the 98% confidence interval.
A)5.46
B)3.64
C)0.91
D)0.60
Question
THE NEXT QUESTIONS ARE BASED ON THE FOLLOWING INFORMATION:
A dependent random sample from two normally distributed populations gives the following results:
n = 20,
= 26.5,s2 = 3.2
What is the upper confidence limit of the 98% confidence interval for the difference between the population means?
A)29.81
B)327.95
C)20.60
D)28.32
A dependent random sample from two normally distributed populations gives the following results:
n = 20,
= 26.5,s2 = 3.2
What is the upper confidence limit of the 98% confidence interval for the difference between the population means?
A)29.81
B)327.95
C)20.60
D)28.32
Question
THE NEXT QUESTIONS ARE BASED ON THE FOLLOWING INFORMATION:
For constructing a 95% confidence interval estimate for the difference between the means of two normally distributed populations,where the unknown population variances are assumed not to be equal,the summary statistics computed from two independent samples are as follows:
n1 = 50,
1 = 175,s1 = 18.5,n2 = 42,
2 = 158,and s2 = 32.4
What is the lower confidence limit of the 95% confidence interval for the difference between the means?
A)5.72
B)6.37
C)8.45
D)9.20
Question
Question
Question
THE NEXT QUESTIONS ARE BASED ON THE FOLLOWING INFORMATION:
A dependent random sample from two normally distributed populations gives the following results:
n = 20,
= 26.5,s2 = 3.2
Calculate the margin of error.
A)3.32
B)2.26
C)2.05
D)1.82
A dependent random sample from two normally distributed populations gives the following results:
n = 20,
= 26.5,s2 = 3.2
Calculate the margin of error.
A)3.32
B)2.26
C)2.05
D)1.82
Question
THE NEXT QUESTIONS ARE BASED ON THE FOLLOWING INFORMATION:
nx = 360,
x = 0.69,ny = 350,
y = 0.76
What is the upper confidence limit of the 98% confidence interval for the difference in population proportions?
A)-0.0151
B)0.004
C)0.007
D)0.025
nx = 360,
x = 0.69,ny = 350,
y = 0.76
What is the upper confidence limit of the 98% confidence interval for the difference in population proportions?
A)-0.0151
B)0.004
C)0.007
D)0.025
Question
THE NEXT QUESTIONS ARE BASED ON THE FOLLOWING INFORMATION:
A dependent random sample from two normally distributed populations gives the following results:
n = 20,
= 26.5,s2 = 3.2
A 95% confidence interval estimate for the difference between two population means,μ1 - μ2,is determined to be 62.75 < μ1 - μ2 < 68.52.Which of the following is true if the confidence level is reduced to 90%?
A)The confidence interval becomes wider.
B)The confidence interval remains the same.
C)The confidence interval becomes narrower.
D)More information is required to determine the answer.
Question
Question
Question
THE NEXT QUESTIONS ARE BASED ON THE FOLLOWING INFORMATION:
A dependent random sample from two normally distributed populations gives the following results:
n = 20,
= 26.5,s2 = 3.2
Calculate the margin of error for the given data assuming 95% confidence level: nx = 200
x = 0.56 ny = 230
y = 0.46
A)0.124
B)0.094
C)0.112
D)0.265
A dependent random sample from two normally distributed populations gives the following results:
n = 20,
= 26.5,s2 = 3.2
Calculate the margin of error for the given data assuming 95% confidence level: nx = 200
x = 0.56 ny = 230
y = 0.46
A)0.124
B)0.094
C)0.112
D)0.265
Question
Question
Question
THE NEXT QUESTIONS ARE BASED ON THE FOLLOWING INFORMATION:
A dependent random sample from two normally distributed populations gives the following results:
n = 20,
= 26.5,s2 = 3.2
The confidence interval for the difference between two population means that are normally distributed where the population variances are unknown but assumed to be equal rely on:
A)the Satterthwaite's approximation.
B)the pooled sample variance.
C)the estimated sample variance.
D)the average sample variance.
Question
THE NEXT QUESTIONS ARE BASED ON THE FOLLOWING INFORMATION:
A dependent random sample from two normally distributed populations gives the following results:
n = 20,
= 26.5,s2 = 3.2
What is the lower confidence limit of the 98% confidence interval for the difference between the population means?
A)20.90
B)25.30
C)24.68
D)23.99
A dependent random sample from two normally distributed populations gives the following results:
n = 20,
= 26.5,s2 = 3.2
What is the lower confidence limit of the 98% confidence interval for the difference between the population means?
A)20.90
B)25.30
C)24.68
D)23.99
Question
THE NEXT QUESTIONS ARE BASED ON THE FOLLOWING INFORMATION:
A dependent random sample from two normally distributed populations gives the following results:
n = 20,
= 27.5,and sd = 3.2
Find the margin of error for a 90% confidence interval for the difference in the means of the two populations.
A)2.75
B)2.29
C)1.24
D)1.86
A dependent random sample from two normally distributed populations gives the following results:
n = 20,
= 27.5,and sd = 3.2
Find the margin of error for a 90% confidence interval for the difference in the means of the two populations.
A)2.75
B)2.29
C)1.24
D)1.86
Question
THE NEXT QUESTIONS ARE BASED ON THE FOLLOWING INFORMATION:
nx = 360,
x = 0.69,ny = 350,
y = 0.76
What is the lower confidence limit of the 98% confidence interval for the difference in population proportions?
A)-0.125
B)0.135
C)-0.147
D)0.147
nx = 360,
x = 0.69,ny = 350,
y = 0.76
What is the lower confidence limit of the 98% confidence interval for the difference in population proportions?
A)-0.125
B)0.135
C)-0.147
D)0.147
Question
THE NEXT QUESTIONS ARE BASED ON THE FOLLOWING INFORMATION:
A dependent random sample from two normally distributed populations gives the following results:
n = 20,
= 27.5,and sd = 3.2
Find the 95% confidence interval for the difference in the means of the two populations.
A)24.58 < μd < 26.89
B)26.26 < μd < 28.74
C)25.42 < μd < 27.93
D)28.29 < μd < 30.25
A dependent random sample from two normally distributed populations gives the following results:
n = 20,
= 27.5,and sd = 3.2
Find the 95% confidence interval for the difference in the means of the two populations.
A)24.58 < μd < 26.89
B)26.26 < μd < 28.74
C)25.42 < μd < 27.93
D)28.29 < μd < 30.25
Question
Question
Question
THE NEXT QUESTIONS ARE BASED ON THE FOLLOWING INFORMATION:
In calculating the 95% confidence interval for μ1 - μ2 the difference between the means of two normally distributed populations,the summary statistics from two independent samples are:
nx = 10,
= 50,
= 0.64,ny = 10,
= 40,and
= 1.86.
What is the upper confidence limit of the 95% confidence interval if the Population variances are unknown and are assumed to be equal?
A)11.050
B)11.072
C)12.056
D)10.980
Question
THE NEXT QUESTIONS ARE BASED ON THE FOLLOWING INFORMATION:
Independent random sampling from two normally distributed populations gives the following results:
nx = 55,
= 520,σx = 30,ny = 45,
= 482,and σy = 24
Assuming equal population variances,determine the number of degrees of freedom for the following: n1 = 18, = 28;n2 = 22,and
= 24
A)40
B)4
C)38
D)10
Independent random sampling from two normally distributed populations gives the following results:
nx = 55,
= 520,σx = 30,ny = 45,
= 482,and σy = 24
Assuming equal population variances,determine the number of degrees of freedom for the following: n1 = 18,
= 28;n2 = 22,and = 24
A)40
B)4
C)38
D)10
Question
THE NEXT QUESTIONS ARE BASED ON THE FOLLOWING INFORMATION:
The means and variances are obtained from two independent samples.Assume that the populations from which the samples were drawn have unequal variances.
Determine the number of degrees of freedom for n1 = 13, = 4,n2 = 15,and
= 10.
A)24
B)30
C)18
D)12
The means and variances are obtained from two independent samples.Assume that the populations from which the samples were drawn have unequal variances.
Determine the number of degrees of freedom for n1 = 13,
= 4,n2 = 15,and = 10.
A)24
B)30
C)18
D)12
Question
THE NEXT QUESTIONS ARE BASED ON THE FOLLOWING INFORMATION:
A confidence interval for the difference between the means of two normally distributed populations based on the following dependent samples is desired:
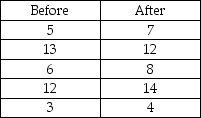
What is the width of the interval?
A)4.86
B)2.56
C)3.24
D)6.48
A confidence interval for the difference between the means of two normally distributed populations based on the following dependent samples is desired:
What is the width of the interval?
A)4.86
B)2.56
C)3.24
D)6.48
Question
If the population distribution of the differences between means of dependent samples is assumed to be normal,then a 100(1- α)% confidence interval for the difference between two means and dependent samples is given by:
A)
± tn-1,α/2

B)
± tn-1,α/2

C)
± tn-1,α/2

D)
± tn-1,α/2

A)
± tn-1,α/2
B)
± tn-1,α/2
C)
± tn-1,α/2
D)
± tn-1,α/2
Question
THE NEXT QUESTIONS ARE BASED ON THE FOLLOWING INFORMATION:
A confidence interval for the difference between the means of two normally distributed populations based on the following dependent samples is desired:
If the observed sample means are and
and 
Then a 100(1- α)% confidence interval for the difference between two means,independent samples,and known population variances is given by:
A)
-

± zα/2

B)
-

± zα/2

C)
-

± zα/2
NEWLINE

D)
-

± zα/2

A confidence interval for the difference between the means of two normally distributed populations based on the following dependent samples is desired:
If the observed sample means are
and Then a 100(1- α)% confidence interval for the difference between two means,independent samples,and known population variances is given by:
A)
-
± zα/2
B)
-
± zα/2
C)
-
± zα/2
NEWLINE
D)
-
± zα/2
Question
THE NEXT QUESTIONS ARE BASED ON THE FOLLOWING INFORMATION:
For calculating a 95% confidence interval for μ1 - μ2 the difference between the means of two normally distributed populations,the summary statistics from two independent samples are:
nx = 60,
= 180,
= 360,ny = 45,
= 160,and
= 900.
It is assumed that the Population variances are unknown and are equal.
What is the upper confidence limit of the 95% confidence interval?
A)29.505
B)30.172
C)10.006
D)22.797
Question
THE NEXT QUESTIONS ARE BASED ON THE FOLLOWING INFORMATION:
Independent random sampling from two normally distributed populations gives the following results:
nx = 55,
= 520,σx = 30,ny = 45,
= 482,and σy = 24
Find the 98% confidence interval for the difference in the means of the two populations.
A)1002 ± 12.58
B)38 ± 12.58
C)38 ± 19.86
D)1002 ± 19.86
Independent random sampling from two normally distributed populations gives the following results:
nx = 55,
= 520,σx = 30,ny = 45,
= 482,and σy = 24
Find the 98% confidence interval for the difference in the means of the two populations.
A)1002 ± 12.58
B)38 ± 12.58
C)38 ± 19.86
D)1002 ± 19.86
Question
THE NEXT QUESTIONS ARE BASED ON THE FOLLOWING INFORMATION:
For calculating a 95% confidence interval for μ1 - μ2 the difference between the means of two normally distributed populations,the summary statistics from two independent samples are:
nx = 60,
= 180,
= 360,ny = 45,
= 160,and
= 900.
It is assumed that the Population variances are unknown and are equal.
What is the lower confidence limit of the 95% confidence interval?
A)29.505
B)11.587
C)10.495
D)22.797
Question
THE NEXT QUESTIONS ARE BASED ON THE FOLLOWING INFORMATION:
In calculating the 95% confidence interval for μ1 - μ2 the difference between the means of two normally distributed populations,the summary statistics from two independent samples are:
nx = 10,
= 50,
= 0.64,ny = 10,
= 40,and
= 1.86.
What is the lower confidence limit of the 95% confidence interval if the Population variances are unknown and are assumed to be equal?
A)8.880
B)8.950
C)9.020
D)7.650
Question
Assuming unknown but equal population variances,determine the number of degrees of freedom for the following: n1 = 30,  = 16.5;n2 = 45,and
= 17.2.
A)59
B)73
C)61
D)55
= 16.5;n2 = 45,and = 17.2.
A)59
B)73
C)61
D)55
Question
THE NEXT QUESTIONS ARE BASED ON THE FOLLOWING INFORMATION:
Independent random sampling from two normally distributed populations gives the following results:
nx = 55,
= 520,σx = 30,ny = 45,
= 482,and σy = 24
Find the margin of error for a 98% confidence interval for the difference in the means of the two populations.
A)8.50
B)19.86
C)15.77
D)12.58
Independent random sampling from two normally distributed populations gives the following results:
nx = 55,
= 520,σx = 30,ny = 45,
= 482,and σy = 24
Find the margin of error for a 98% confidence interval for the difference in the means of the two populations.
A)8.50
B)19.86
C)15.77
D)12.58
Question
THE NEXT QUESTIONS ARE BASED ON THE FOLLOWING INFORMATION:
A confidence interval for the difference between the means of two normally distributed populations based on the following dependent samples is desired:
What is the upper confidence limit of the 95% confidence interval?
A)0.42
B)1.48
C)0.043
D)0.05
A confidence interval for the difference between the means of two normally distributed populations based on the following dependent samples is desired:
What is the upper confidence limit of the 95% confidence interval?
A)0.42
B)1.48
C)0.043
D)0.05
Question
THE NEXT QUESTIONS ARE BASED ON THE FOLLOWING INFORMATION:
A confidence interval for the difference between the means of two normally distributed populations based on the following dependent samples is desired:
What is the lower confidence limit of the 95% confidence interval?
A)-2.82
B)-3.88
C)2.45
D)3.88
A confidence interval for the difference between the means of two normally distributed populations based on the following dependent samples is desired:
What is the lower confidence limit of the 95% confidence interval?
A)-2.82
B)-3.88
C)2.45
D)3.88
Question
THE NEXT QUESTIONS ARE BASED ON THE FOLLOWING INFORMATION:
A confidence interval for the difference between the means of two normally distributed populations based on the following dependent samples is desired:
What is the margin of error at 95% Confidence interval?
A)2.76
B)1.62
C)1.25
D)2.00
A confidence interval for the difference between the means of two normally distributed populations based on the following dependent samples is desired:
What is the margin of error at 95% Confidence interval?
A)2.76
B)1.62
C)1.25
D)2.00
Question
Question
THE NEXT QUESTIONS ARE BASED ON THE FOLLOWING INFORMATION:
A restaurant manager was in charge of purchasing new microwaves for his restaurant.The choices were narrowed to two available models.Since the two models cost about the same,the manager was interested in determining whether there was a difference in the amount of power consumed when operated at high voltages.Based on two independent random samples,the following summary information was computed:
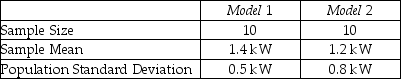
Find a 99% confidence interval for the difference in the amount of power consumed at high voltages by the two models.
A)0.2 ± 0.86
B)0.2 ± 0.58
C)0.2 ± 0.64
D)0.2 ± 0.77
A restaurant manager was in charge of purchasing new microwaves for his restaurant.The choices were narrowed to two available models.Since the two models cost about the same,the manager was interested in determining whether there was a difference in the amount of power consumed when operated at high voltages.Based on two independent random samples,the following summary information was computed:
Find a 99% confidence interval for the difference in the amount of power consumed at high voltages by the two models.
A)0.2 ± 0.86
B)0.2 ± 0.58
C)0.2 ± 0.64
D)0.2 ± 0.77
Question
THE NEXT QUESTIONS ARE BASED ON THE FOLLOWING INFORMATION:
n1 = 35,
1 = 140
= 60.84;n2 = 48,
2 = 130,and
= 156.25
What is the lower confidence limit of the 95% confidence interval?
A)8.233
B)6.333
C)10.233
D)5.233
n1 = 35,
1 = 140
= 60.84;n2 = 48,
2 = 130,and
= 156.25
What is the lower confidence limit of the 95% confidence interval?
A)8.233
B)6.333
C)10.233
D)5.233
Question
THE NEXT QUESTIONS ARE BASED ON THE FOLLOWING INFORMATION:
Two dependent random samples from two normally distributed populations gives the following results:
n = 10;
= 20.5;sd = 3.2
Find the lower confidence limit of the 95% confidence interval for the difference between the means of the two populations.
A)13.48
B)17.71
C)22.79
D)25.83
Two dependent random samples from two normally distributed populations gives the following results:
n = 10;
= 20.5;sd = 3.2
Find the lower confidence limit of the 95% confidence interval for the difference between the means of the two populations.
A)13.48
B)17.71
C)22.79
D)25.83
Question
THE NEXT QUESTIONS ARE BASED ON THE FOLLOWING INFORMATION:
The residents of Austin,Texas,complain that parking fines given in their city are higher than the parking fines that are given in Houston.Independent random samples of the amounts paid by residents for parking tickets in each of two cities over the last four months were obtained.Assume the population variances are equal.These amounts were as follows:

What is the sample variance of the parking fines issued in Austin?
A)404.49
B)230.69
C)364.04
D)201.86
The residents of Austin,Texas,complain that parking fines given in their city are higher than the parking fines that are given in Houston.Independent random samples of the amounts paid by residents for parking tickets in each of two cities over the last four months were obtained.Assume the population variances are equal.These amounts were as follows:
What is the sample variance of the parking fines issued in Austin?
A)404.49
B)230.69
C)364.04
D)201.86
Question
Question
THE NEXT QUESTIONS ARE BASED ON THE FOLLOWING INFORMATION:
n1 = 35,
1 = 140
= 60.84;n2 = 48,
2 = 130,and
= 156.25
What is the upper confidence limit of the 95% confidence interval?
A)16.879
B)12.987
C)15.233
D)14.767
n1 = 35,
1 = 140
= 60.84;n2 = 48,
2 = 130,and
= 156.25
What is the upper confidence limit of the 95% confidence interval?
A)16.879
B)12.987
C)15.233
D)14.767
Question
Question
THE NEXT QUESTIONS ARE BASED ON THE FOLLOWING INFORMATION:
The residents of Austin,Texas,complain that parking fines given in their city are higher than the parking fines that are given in Houston.Independent random samples of the amounts paid by residents for parking tickets in each of two cities over the last four months were obtained.Assume the population variances are equal.These amounts were as follows:
What is the mean of the parking fines issued in Austin?
A)97.88
B)146.75
C)78.30
D)117.40
Question
THE NEXT QUESTIONS ARE BASED ON THE FOLLOWING INFORMATION:
The means and variances are obtained from two independent samples.Assume that the populations from which the samples were drawn have unequal variances.
Determine the number of degrees of freedom for n1 = 9, = 24,n2 = 14,and
= 36
A)14
B)20
C)25
D)32
The means and variances are obtained from two independent samples.Assume that the populations from which the samples were drawn have unequal variances.
Determine the number of degrees of freedom for n1 = 9,
= 24,n2 = 14,and = 36
A)14
B)20
C)25
D)32
Question
THE NEXT QUESTIONS ARE BASED ON THE FOLLOWING INFORMATION:
A restaurant manager was in charge of purchasing new microwaves for his restaurant.The choices were narrowed to two available models.Since the two models cost about the same,the manager was interested in determining whether there was a difference in the amount of power consumed when operated at high voltages.Based on two independent random samples,the following summary information was computed:
Find a 90% confidence interval for the difference in the amount of power consumed at high voltages by the two models.
A)0.2 ± 0.49
B)0.2 ± 0.16
C)0.2 ± 0.05
D)0.2 ± 1.28
Question
Question
THE NEXT QUESTIONS ARE BASED ON THE FOLLOWING INFORMATION:
Two dependent random samples from two normally distributed populations gives the following results:
n = 10;
= 20.5;sd = 3.2
Find the width of the 95% confidence interval.
A)2.29
B)3.86
C)4.58
D)5.92
Two dependent random samples from two normally distributed populations gives the following results:
n = 10;
= 20.5;sd = 3.2
Find the width of the 95% confidence interval.
A)2.29
B)3.86
C)4.58
D)5.92
Question
THE NEXT QUESTIONS ARE BASED ON THE FOLLOWING INFORMATION:
The residents of Austin,Texas,complain that parking fines given in their city are higher than the parking fines that are given in Houston.Independent random samples of the amounts paid by residents for parking tickets in each of two cities over the last four months were obtained.Assume the population variances are equal.These amounts were as follows:
Calculate the pooled sample variance.
A)595.042
B)468.006
C)328.455
D)554.593
Question
THE NEXT QUESTIONS ARE BASED ON THE FOLLOWING INFORMATION:
Two dependent random samples from two normally distributed populations gives the following results:
n = 10;
= 20.5;sd = 3.2
Find the upper confidence limit of the 95% confidence interval for the difference between the means of the two populations.
A)13.48
B)18.21
C)22.29
D)25.83
Two dependent random samples from two normally distributed populations gives the following results:
n = 10;
= 20.5;sd = 3.2
Find the upper confidence limit of the 95% confidence interval for the difference between the means of the two populations.
A)13.48
B)18.21
C)22.29
D)25.83
Question
THE NEXT QUESTIONS ARE BASED ON THE FOLLOWING INFORMATION:
n1 = 35,
1 = 140
= 60.84;n2 = 48,
2 = 130,and
= 156.25
Find the margin of error for a 95% confidence interval for the difference in the means of the two populations assuming that the population variances are equal.
A)4.002
B)4.767
C)5.365
D)3.645
n1 = 35,
1 = 140
= 60.84;n2 = 48,
2 = 130,and
= 156.25
Find the margin of error for a 95% confidence interval for the difference in the means of the two populations assuming that the population variances are equal.
A)4.002
B)4.767
C)5.365
D)3.645
Question
THE NEXT QUESTIONS ARE BASED ON THE FOLLOWING INFORMATION:
The residents of Austin,Texas,complain that parking fines given in their city are higher than the parking fines that are given in Houston.Independent random samples of the amounts paid by residents for parking tickets in each of two cities over the last four months were obtained.Assume the population variances are equal.These amounts were as follows:
What is the mean of the parking fines issued in Houston?
A)97.88
B)146.75
C)78.30
D)117.40
Question
THE NEXT QUESTIONS ARE BASED ON THE FOLLOWING INFORMATION:
The residents of Austin,Texas,complain that parking fines given in their city are higher than the parking fines that are given in Houston.Independent random samples of the amounts paid by residents for parking tickets in each of two cities over the last four months were obtained.Assume the population variances are equal.These amounts were as follows:
What is the sample variance of the parking fines issued in Houston?
A)404.49
B)230.69
C)364.04
D)201.86
Question
THE NEXT QUESTIONS ARE BASED ON THE FOLLOWING INFORMATION:
A restaurant manager was in charge of purchasing new microwaves for his restaurant.The choices were narrowed to two available models.Since the two models cost about the same,the manager was interested in determining whether there was a difference in the amount of power consumed when operated at high voltages.Based on two independent random samples,the following summary information was computed:
Find a 95% confidence interval for the difference in the amount of power consumed at high voltages by the two models.
A)0.2 ± 0.49
B)0.2 ± 0.58
C)0.2 ± 0.64
D)0.2 ± 1.28
Question
THE NEXT QUESTIONS ARE BASED ON THE FOLLOWING INFORMATION:
Two dependent random samples from two normally distributed populations gives the following results:
n = 10;
= 20.5;sd = 3.2
Find the margin of error for a 95% confidence interval for the difference between the means of the two populations.
A)2.29
B)5.86
C)3.44
D)8.10
Two dependent random samples from two normally distributed populations gives the following results:
n = 10;
= 20.5;sd = 3.2
Find the margin of error for a 95% confidence interval for the difference between the means of the two populations.
A)2.29
B)5.86
C)3.44
D)8.10
Question
Question
Question
Question
Question
The margin of error of confidence intervals for the difference between two means,independent samples,and known population variances is given by 
-
± zα/2

.
-
± zα/2
.
Question
A 100(1- α)% confidence interval for the difference between two means,independent samples,and known population variances is given by 
-
± zα/2
.
-
± zα/2
.
Question
Question
THE NEXT QUESTIONS ARE BASED ON THE FOLLOWING INFORMATION:
Consider the data in the table below.

What is the sample variance of the Group 1?
A)345.98
B)234.56
C)366.01
D)255.89
Consider the data in the table below.
What is the sample variance of the Group 1?
A)345.98
B)234.56
C)366.01
D)255.89
Question
Question
THE NEXT QUESTIONS ARE BASED ON THE FOLLOWING INFORMATION:
The residents of Austin,Texas,complain that parking fines given in their city are higher than the parking fines that are given in Houston.Independent random samples of the amounts paid by residents for parking tickets in each of two cities over the last four months were obtained.Assume the population variances are equal.These amounts were as follows:
Determine the number of degrees of freedom.
A)18
B)16
C)20
D)9
Question
THE NEXT QUESTIONS ARE BASED ON THE FOLLOWING INFORMATION:
Consider the data in the table below.
What is the mean of the Group 2?
A)97.88
B)100.13
C)78.30
D)119.70
Consider the data in the table below.
What is the mean of the Group 2?
A)97.88
B)100.13
C)78.30
D)119.70
Question
THE NEXT QUESTIONS ARE BASED ON THE FOLLOWING INFORMATION:
The residents of Austin,Texas,complain that parking fines given in their city are higher than the parking fines that are given in Houston.Independent random samples of the amounts paid by residents for parking tickets in each of two cities over the last four months were obtained.Assume the population variances are equal.These amounts were as follows:
Find the 98% confidence interval for the difference in the mean costs of parking tickets in these two cities.
A)19.52 ± 25.37
B)19.52 ± 20.38
C)19.52 ± 22.77
D)19.52 ± 22.21
Question
THE NEXT QUESTIONS ARE BASED ON THE FOLLOWING INFORMATION:
Consider the data in the table below.
What is the sample variance of the Group 2?
A)468.70
B)366.01
C)456.19
D)490.67
Consider the data in the table below.
What is the sample variance of the Group 2?
A)468.70
B)366.01
C)456.19
D)490.67
Question
THE NEXT QUESTIONS ARE BASED ON THE FOLLOWING INFORMATION:
Consider the data in the table below.
What is the mean of the Group 1?
A)119.70
B)121.67
C)115.60
D)117.65
Consider the data in the table below.
What is the mean of the Group 1?
A)119.70
B)121.67
C)115.60
D)117.65
Question
Question
The mean of the sampling distribution of the difference between sample proportions, 
1 -
2,is equal to the difference between the corresponding population proportions,P1 - P2.
1 -
2,is equal to the difference between the corresponding population proportions,P1 - P2.
Question
Assuming equal population variances,determine the number of degrees of freedom for the following: n1 = 16, 
= 25;n2 = 20,and
= 30
A)36
B)18
C)38
D)34
= 25;n2 = 20,and
= 30
A)36
B)18
C)38
D)34
Question
Question
Question
For confidence intervals of two means that are dependent samples,the margin of error is equal to
tn-1,tα/s

.
tn-1,tα/s
.

Unlock Deck
Sign up to unlock the cards in this deck!
Unlock Deck
Unlock Deck
1/109
Play
Full screen (f)
Deck 8: Estimation: Additional Topics
1
THE NEXT QUESTIONS ARE BASED ON THE FOLLOWING INFORMATION:
A dependent random sample from two normally distributed populations gives the following results:
n = 20,
= 26.5,s2 = 3.2
Calculate the margin of error for the given data assuming 95% confidence level: nx = 250
x = 0.65 ny = 360
y = 0.78
A)0.085
B)1.05
C)0.052
D)0.072
A dependent random sample from two normally distributed populations gives the following results:
n = 20,
= 26.5,s2 = 3.2
Calculate the margin of error for the given data assuming 95% confidence level: nx = 250
x = 0.65 ny = 360
y = 0.78
A)0.085
B)1.05
C)0.052
D)0.072
0.072
2
THE NEXT QUESTIONS ARE BASED ON THE FOLLOWING INFORMATION:
For constructing a 95% confidence interval estimate for the difference between the means of two normally distributed populations,where the unknown population variances are assumed not to be equal,the summary statistics computed from two independent samples are as follows:
n1 = 50,
1 = 175,s1 = 18.5,n2 = 42,
2 = 158,and s2 = 32.4
What is the upper confidence limit of the 95% confidence interval for the difference between the means?
A)19.123
B)28.279
C)24.911
D)5)788
28.279
3
THE NEXT QUESTIONS ARE BASED ON THE FOLLOWING INFORMATION:
Independent samples of math scores from students in the U.S.and Europe were collected from normal populations.A sample of 50 students from the U.S.had an average score of 570 while a sample of 50 European students had an average score of 540.The population standard deviations for the average scores of the US and European students are 102 and 115 respectively.
The confidence interval for the difference between two population means that are normally distributed where the population variances are unknown and are not assumed to be equal rely on the use of:
A)the average sample variance.
B)the estimated sample variance.
C)Satterthwaite's approximation.
D)the pooled variance.
Satterthwaite's approximation.
4
THE NEXT QUESTIONS ARE BASED ON THE FOLLOWING INFORMATION:
A dependent random sample from two normally distributed populations gives the following results:
n = 20,
= 26.5,s2 = 3.2
The pooled variance is formed by combining information from two independent samples.
If
= 39,
= 25,and n1 = n2 = 12 then
Is equal to:
A)31
B)45
C)30
D)32
A dependent random sample from two normally distributed populations gives the following results:
n = 20,
= 26.5,s2 = 3.2
The pooled variance
is formed by combining information from two independent samples.If
= 39,
= 25,and n1 = n2 = 12 then
Is equal to:
A)31
B)45
C)30
D)32
Unlock Deck
Unlock for access to all 109 flashcards in this deck.
Unlock Deck
k this deck
5
THE NEXT QUESTIONS ARE BASED ON THE FOLLOWING INFORMATION:
In a recent survey of 240 teachers in Richmond,Virginia,77.2% supported standardized national testing of elementary students.In a survey of 162 teachers in Raleigh,North Carolina,64.2% supported national testing.
What is the upper confidence limit of the 99% confidence interval for the difference between the two population proportions?
A)0.249
B)0.222
C)0.265
D)0.278
Unlock Deck
Unlock for access to all 109 flashcards in this deck.
Unlock Deck
k this deck
6
THE NEXT QUESTIONS ARE BASED ON THE FOLLOWING INFORMATION:
A dependent random sample from two normally distributed populations gives the following results:
n = 20,
= 26.5,s2 = 3.2
Find the width of the 98% confidence interval.
A)5.46
B)3.64
C)0.91
D)0.60
A dependent random sample from two normally distributed populations gives the following results:
n = 20,
= 26.5,s2 = 3.2
Find the width of the 98% confidence interval.
A)5.46
B)3.64
C)0.91
D)0.60
Unlock Deck
Unlock for access to all 109 flashcards in this deck.
Unlock Deck
k this deck
7
THE NEXT QUESTIONS ARE BASED ON THE FOLLOWING INFORMATION:
A dependent random sample from two normally distributed populations gives the following results:
n = 20,
= 26.5,s2 = 3.2
What is the upper confidence limit of the 98% confidence interval for the difference between the population means?
A)29.81
B)327.95
C)20.60
D)28.32
A dependent random sample from two normally distributed populations gives the following results:
n = 20,
= 26.5,s2 = 3.2
What is the upper confidence limit of the 98% confidence interval for the difference between the population means?
A)29.81
B)327.95
C)20.60
D)28.32
Unlock Deck
Unlock for access to all 109 flashcards in this deck.
Unlock Deck
k this deck
8
THE NEXT QUESTIONS ARE BASED ON THE FOLLOWING INFORMATION:
For constructing a 95% confidence interval estimate for the difference between the means of two normally distributed populations,where the unknown population variances are assumed not to be equal,the summary statistics computed from two independent samples are as follows:
n1 = 50,
1 = 175,s1 = 18.5,n2 = 42,
2 = 158,and s2 = 32.4
What is the lower confidence limit of the 95% confidence interval for the difference between the means?
A)5.72
B)6.37
C)8.45
D)9.20
Unlock Deck
Unlock for access to all 109 flashcards in this deck.
Unlock Deck
k this deck
9
THE NEXT QUESTIONS ARE BASED ON THE FOLLOWING INFORMATION:
Independent samples of math scores from students in the U.S.and Europe were collected from normal populations.A sample of 50 students from the U.S.had an average score of 570 while a sample of 50 European students had an average score of 540.The population standard deviations for the average scores of the US and European students are 102 and 115 respectively.
What is the upper confidence limit of the 95% confidence interval for the difference between the population means?
A)65.65
B)51.73
C)72.61
D)94.23
Unlock Deck
Unlock for access to all 109 flashcards in this deck.
Unlock Deck
k this deck
10
THE NEXT QUESTIONS ARE BASED ON THE FOLLOWING INFORMATION:
A career counselor is interested in examining the salaries earned by graduate business school students at the end of the first year after graduation.In particular,the counselor is interested in seeing whether there is a difference between men and women graduates' salaries.From a random sample of 20 men,the mean salary is found to be $42,780 with a standard deviation of $5,426.From a sample of 12 women,the mean salary is found to be $40,136 with a standard deviation of $4,383.Assume that the random sample observations are from normally distributed populations,and that the population variances are assumed to be equal.
What is the lower confidence limit of the 95% confidence interval for the difference between the population mean salary for men and women?
A)-$1,135.781
B)-$791.792
C)-$952.833
D)$834.835
Unlock Deck
Unlock for access to all 109 flashcards in this deck.
Unlock Deck
k this deck
11
THE NEXT QUESTIONS ARE BASED ON THE FOLLOWING INFORMATION:
A dependent random sample from two normally distributed populations gives the following results:
n = 20,
= 26.5,s2 = 3.2
Calculate the margin of error.
A)3.32
B)2.26
C)2.05
D)1.82
A dependent random sample from two normally distributed populations gives the following results:
n = 20,
= 26.5,s2 = 3.2
Calculate the margin of error.
A)3.32
B)2.26
C)2.05
D)1.82
Unlock Deck
Unlock for access to all 109 flashcards in this deck.
Unlock Deck
k this deck
12
THE NEXT QUESTIONS ARE BASED ON THE FOLLOWING INFORMATION:
nx = 360,
x = 0.69,ny = 350,
y = 0.76
What is the upper confidence limit of the 98% confidence interval for the difference in population proportions?
A)-0.0151
B)0.004
C)0.007
D)0.025
nx = 360,
x = 0.69,ny = 350,
y = 0.76
What is the upper confidence limit of the 98% confidence interval for the difference in population proportions?
A)-0.0151
B)0.004
C)0.007
D)0.025
Unlock Deck
Unlock for access to all 109 flashcards in this deck.
Unlock Deck
k this deck
13
THE NEXT QUESTIONS ARE BASED ON THE FOLLOWING INFORMATION:
A dependent random sample from two normally distributed populations gives the following results:
n = 20,
= 26.5,s2 = 3.2
A 95% confidence interval estimate for the difference between two population means,μ1 - μ2,is determined to be 62.75 < μ1 - μ2 < 68.52.Which of the following is true if the confidence level is reduced to 90%?
A)The confidence interval becomes wider.
B)The confidence interval remains the same.
C)The confidence interval becomes narrower.
D)More information is required to determine the answer.
Unlock Deck
Unlock for access to all 109 flashcards in this deck.
Unlock Deck
k this deck
14
THE NEXT QUESTIONS ARE BASED ON THE FOLLOWING INFORMATION:
In a recent survey of 240 teachers in Richmond,Virginia,77.2% supported standardized national testing of elementary students.In a survey of 162 teachers in Raleigh,North Carolina,64.2% supported national testing.
What is the lower confidence limit of the 99% confidence interval for the difference between the two population proportions?
A)-0.011
B)0.036
C)-0.036
D)0.011
Unlock Deck
Unlock for access to all 109 flashcards in this deck.
Unlock Deck
k this deck
15
THE NEXT QUESTIONS ARE BASED ON THE FOLLOWING INFORMATION:
A career counselor is interested in examining the salaries earned by graduate business school students at the end of the first year after graduation.In particular,the counselor is interested in seeing whether there is a difference between men and women graduates' salaries.From a random sample of 20 men,the mean salary is found to be $42,780 with a standard deviation of $5,426.From a sample of 12 women,the mean salary is found to be $40,136 with a standard deviation of $4,383.Assume that the random sample observations are from normally distributed populations,and that the population variances are assumed to be equal.
In order to construct a confidence interval estimate for the difference between two population means,independent samples are obtained from two normal populations with unknown but assumed to be equal variances.If the first sample contains 18 items and the second sample contains 14 items,which of the following distributions will be used?
A)the t distribution with 32 degrees of freedom
B)the t distribution with 17 degrees of freedom
C)the t distribution with 13 degrees of freedom
D)the t distribution with 30 degrees of freedom
Unlock Deck
Unlock for access to all 109 flashcards in this deck.
Unlock Deck
k this deck
16
THE NEXT QUESTIONS ARE BASED ON THE FOLLOWING INFORMATION:
A dependent random sample from two normally distributed populations gives the following results:
n = 20,
= 26.5,s2 = 3.2
Calculate the margin of error for the given data assuming 95% confidence level: nx = 200
x = 0.56 ny = 230
y = 0.46
A)0.124
B)0.094
C)0.112
D)0.265
A dependent random sample from two normally distributed populations gives the following results:
n = 20,
= 26.5,s2 = 3.2
Calculate the margin of error for the given data assuming 95% confidence level: nx = 200
x = 0.56 ny = 230
y = 0.46
A)0.124
B)0.094
C)0.112
D)0.265
Unlock Deck
Unlock for access to all 109 flashcards in this deck.
Unlock Deck
k this deck
17
THE NEXT QUESTIONS ARE BASED ON THE FOLLOWING INFORMATION:
A career counselor is interested in examining the salaries earned by graduate business school students at the end of the first year after graduation.In particular,the counselor is interested in seeing whether there is a difference between men and women graduates' salaries.From a random sample of 20 men,the mean salary is found to be $42,780 with a standard deviation of $5,426.From a sample of 12 women,the mean salary is found to be $40,136 with a standard deviation of $4,383.Assume that the random sample observations are from normally distributed populations,and that the population variances are assumed to be equal.
What is the upper confidence limit of the 95% confidence interval for the difference between the population mean salary for men and women?
A)$6,122.835
B)$6,240.833
C)$6,079.79
D)$6,423.781
Unlock Deck
Unlock for access to all 109 flashcards in this deck.
Unlock Deck
k this deck
18
THE NEXT QUESTIONS ARE BASED ON THE FOLLOWING INFORMATION:
Independent samples of math scores from students in the U.S.and Europe were collected from normal populations.A sample of 50 students from the U.S.had an average score of 570 while a sample of 50 European students had an average score of 540.The population standard deviations for the average scores of the US and European students are 102 and 115 respectively.
What is the lower confidence limit of the 95% confidence interval for the difference between the population means?
A)-24.82
B)-12.61
C)-29.21
D)-18.24
Unlock Deck
Unlock for access to all 109 flashcards in this deck.
Unlock Deck
k this deck
19
THE NEXT QUESTIONS ARE BASED ON THE FOLLOWING INFORMATION:
A dependent random sample from two normally distributed populations gives the following results:
n = 20,
= 26.5,s2 = 3.2
The confidence interval for the difference between two population means that are normally distributed where the population variances are unknown but assumed to be equal rely on:
A)the Satterthwaite's approximation.
B)the pooled sample variance.
C)the estimated sample variance.
D)the average sample variance.
Unlock Deck
Unlock for access to all 109 flashcards in this deck.
Unlock Deck
k this deck
20
THE NEXT QUESTIONS ARE BASED ON THE FOLLOWING INFORMATION:
A dependent random sample from two normally distributed populations gives the following results:
n = 20,
= 26.5,s2 = 3.2
What is the lower confidence limit of the 98% confidence interval for the difference between the population means?
A)20.90
B)25.30
C)24.68
D)23.99
A dependent random sample from two normally distributed populations gives the following results:
n = 20,
= 26.5,s2 = 3.2
What is the lower confidence limit of the 98% confidence interval for the difference between the population means?
A)20.90
B)25.30
C)24.68
D)23.99
Unlock Deck
Unlock for access to all 109 flashcards in this deck.
Unlock Deck
k this deck
21
THE NEXT QUESTIONS ARE BASED ON THE FOLLOWING INFORMATION:
A dependent random sample from two normally distributed populations gives the following results:
n = 20,
= 27.5,and sd = 3.2
Find the margin of error for a 90% confidence interval for the difference in the means of the two populations.
A)2.75
B)2.29
C)1.24
D)1.86
A dependent random sample from two normally distributed populations gives the following results:
n = 20,
= 27.5,and sd = 3.2
Find the margin of error for a 90% confidence interval for the difference in the means of the two populations.
A)2.75
B)2.29
C)1.24
D)1.86
Unlock Deck
Unlock for access to all 109 flashcards in this deck.
Unlock Deck
k this deck
22
THE NEXT QUESTIONS ARE BASED ON THE FOLLOWING INFORMATION:
nx = 360,
x = 0.69,ny = 350,
y = 0.76
What is the lower confidence limit of the 98% confidence interval for the difference in population proportions?
A)-0.125
B)0.135
C)-0.147
D)0.147
nx = 360,
x = 0.69,ny = 350,
y = 0.76
What is the lower confidence limit of the 98% confidence interval for the difference in population proportions?
A)-0.125
B)0.135
C)-0.147
D)0.147
Unlock Deck
Unlock for access to all 109 flashcards in this deck.
Unlock Deck
k this deck
23
THE NEXT QUESTIONS ARE BASED ON THE FOLLOWING INFORMATION:
A dependent random sample from two normally distributed populations gives the following results:
n = 20,
= 27.5,and sd = 3.2
Find the 95% confidence interval for the difference in the means of the two populations.
A)24.58 < μd < 26.89
B)26.26 < μd < 28.74
C)25.42 < μd < 27.93
D)28.29 < μd < 30.25
A dependent random sample from two normally distributed populations gives the following results:
n = 20,
= 27.5,and sd = 3.2
Find the 95% confidence interval for the difference in the means of the two populations.
A)24.58 < μd < 26.89
B)26.26 < μd < 28.74
C)25.42 < μd < 27.93
D)28.29 < μd < 30.25
Unlock Deck
Unlock for access to all 109 flashcards in this deck.
Unlock Deck
k this deck
24
To develop a confidence interval for the difference between the means of two populations which are normally distributed and have equal variances,two independent samples of sizes n1 and n2 are randomly selected from the two populations.What is the formula used to determine the number of degrees of freedom for the t distribution?
A)n1 + n2
B)n1 + n2 - 1
C)n1 + n2 - 2
D)n1 + n2 + 1
A)n1 + n2
B)n1 + n2 - 1
C)n1 + n2 - 2
D)n1 + n2 + 1
Unlock Deck
Unlock for access to all 109 flashcards in this deck.
Unlock Deck
k this deck
25
In a random sample of 500 California residents,350 indicated that they were home owners.In another random sample of 700 Florida residents,455 indicated that they were home owners.What is the 99% confidence interval for the difference between the proportions?
A)0.05 ± 0.070
B)0.05 ± 0.085
C)0.05 ± 0.053
D)0.05 ± 0.045
A)0.05 ± 0.070
B)0.05 ± 0.085
C)0.05 ± 0.053
D)0.05 ± 0.045
Unlock Deck
Unlock for access to all 109 flashcards in this deck.
Unlock Deck
k this deck
26
THE NEXT QUESTIONS ARE BASED ON THE FOLLOWING INFORMATION:
In calculating the 95% confidence interval for μ1 - μ2 the difference between the means of two normally distributed populations,the summary statistics from two independent samples are:
nx = 10,
= 50,
= 0.64,ny = 10,
= 40,and
= 1.86.
What is the upper confidence limit of the 95% confidence interval if the Population variances are unknown and are assumed to be equal?
A)11.050
B)11.072
C)12.056
D)10.980
Unlock Deck
Unlock for access to all 109 flashcards in this deck.
Unlock Deck
k this deck
27
THE NEXT QUESTIONS ARE BASED ON THE FOLLOWING INFORMATION:
Independent random sampling from two normally distributed populations gives the following results:
nx = 55,
= 520,σx = 30,ny = 45,
= 482,and σy = 24
Assuming equal population variances,determine the number of degrees of freedom for the following: n1 = 18, = 28;n2 = 22,and
= 24
A)40
B)4
C)38
D)10
Independent random sampling from two normally distributed populations gives the following results:
nx = 55,
= 520,σx = 30,ny = 45,
= 482,and σy = 24
Assuming equal population variances,determine the number of degrees of freedom for the following: n1 = 18,
= 28;n2 = 22,and = 24
A)40
B)4
C)38
D)10
Unlock Deck
Unlock for access to all 109 flashcards in this deck.
Unlock Deck
k this deck
28
THE NEXT QUESTIONS ARE BASED ON THE FOLLOWING INFORMATION:
The means and variances are obtained from two independent samples.Assume that the populations from which the samples were drawn have unequal variances.
Determine the number of degrees of freedom for n1 = 13, = 4,n2 = 15,and
= 10.
A)24
B)30
C)18
D)12
The means and variances are obtained from two independent samples.Assume that the populations from which the samples were drawn have unequal variances.
Determine the number of degrees of freedom for n1 = 13,
= 4,n2 = 15,and = 10.
A)24
B)30
C)18
D)12
Unlock Deck
Unlock for access to all 109 flashcards in this deck.
Unlock Deck
k this deck
29
THE NEXT QUESTIONS ARE BASED ON THE FOLLOWING INFORMATION:
A confidence interval for the difference between the means of two normally distributed populations based on the following dependent samples is desired:
What is the width of the interval?
A)4.86
B)2.56
C)3.24
D)6.48
A confidence interval for the difference between the means of two normally distributed populations based on the following dependent samples is desired:
What is the width of the interval?
A)4.86
B)2.56
C)3.24
D)6.48
Unlock Deck
Unlock for access to all 109 flashcards in this deck.
Unlock Deck
k this deck
30
If the population distribution of the differences between means of dependent samples is assumed to be normal,then a 100(1- α)% confidence interval for the difference between two means and dependent samples is given by:
A)
± tn-1,α/2
B)
± tn-1,α/2
C)
± tn-1,α/2
D)
± tn-1,α/2
A)
± tn-1,α/2
B)
± tn-1,α/2
C)
± tn-1,α/2
D)
± tn-1,α/2
Unlock Deck
Unlock for access to all 109 flashcards in this deck.
Unlock Deck
k this deck
31
THE NEXT QUESTIONS ARE BASED ON THE FOLLOWING INFORMATION:
A confidence interval for the difference between the means of two normally distributed populations based on the following dependent samples is desired:
If the observed sample means are and
Then a 100(1- α)% confidence interval for the difference between two means,independent samples,and known population variances is given by:
A)
-
± zα/2
B)
-
± zα/2
C)
-
± zα/2
NEWLINE
D)
-
± zα/2
A confidence interval for the difference between the means of two normally distributed populations based on the following dependent samples is desired:
If the observed sample means are
and Then a 100(1- α)% confidence interval for the difference between two means,independent samples,and known population variances is given by:
A)
-
± zα/2
B)
-
± zα/2
C)
-
± zα/2
NEWLINE
D)
-
± zα/2
Unlock Deck
Unlock for access to all 109 flashcards in this deck.
Unlock Deck
k this deck
32
THE NEXT QUESTIONS ARE BASED ON THE FOLLOWING INFORMATION:
For calculating a 95% confidence interval for μ1 - μ2 the difference between the means of two normally distributed populations,the summary statistics from two independent samples are:
nx = 60,
= 180,
= 360,ny = 45,
= 160,and
= 900.
It is assumed that the Population variances are unknown and are equal.
What is the upper confidence limit of the 95% confidence interval?
A)29.505
B)30.172
C)10.006
D)22.797
Unlock Deck
Unlock for access to all 109 flashcards in this deck.
Unlock Deck
k this deck
33
THE NEXT QUESTIONS ARE BASED ON THE FOLLOWING INFORMATION:
Independent random sampling from two normally distributed populations gives the following results:
nx = 55,
= 520,σx = 30,ny = 45,
= 482,and σy = 24
Find the 98% confidence interval for the difference in the means of the two populations.
A)1002 ± 12.58
B)38 ± 12.58
C)38 ± 19.86
D)1002 ± 19.86
Independent random sampling from two normally distributed populations gives the following results:
nx = 55,
= 520,σx = 30,ny = 45,
= 482,and σy = 24
Find the 98% confidence interval for the difference in the means of the two populations.
A)1002 ± 12.58
B)38 ± 12.58
C)38 ± 19.86
D)1002 ± 19.86
Unlock Deck
Unlock for access to all 109 flashcards in this deck.
Unlock Deck
k this deck
34
THE NEXT QUESTIONS ARE BASED ON THE FOLLOWING INFORMATION:
For calculating a 95% confidence interval for μ1 - μ2 the difference between the means of two normally distributed populations,the summary statistics from two independent samples are:
nx = 60,
= 180,
= 360,ny = 45,
= 160,and
= 900.
It is assumed that the Population variances are unknown and are equal.
What is the lower confidence limit of the 95% confidence interval?
A)29.505
B)11.587
C)10.495
D)22.797
Unlock Deck
Unlock for access to all 109 flashcards in this deck.
Unlock Deck
k this deck
35
THE NEXT QUESTIONS ARE BASED ON THE FOLLOWING INFORMATION:
In calculating the 95% confidence interval for μ1 - μ2 the difference between the means of two normally distributed populations,the summary statistics from two independent samples are:
nx = 10,
= 50,
= 0.64,ny = 10,
= 40,and
= 1.86.
What is the lower confidence limit of the 95% confidence interval if the Population variances are unknown and are assumed to be equal?
A)8.880
B)8.950
C)9.020
D)7.650
Unlock Deck
Unlock for access to all 109 flashcards in this deck.
Unlock Deck
k this deck
36
Assuming unknown but equal population variances,determine the number of degrees of freedom for the following: n1 = 30, = 16.5;n2 = 45,and
= 17.2.
A)59
B)73
C)61
D)55
= 16.5;n2 = 45,and = 17.2.
A)59
B)73
C)61
D)55
Unlock Deck
Unlock for access to all 109 flashcards in this deck.
Unlock Deck
k this deck
37
THE NEXT QUESTIONS ARE BASED ON THE FOLLOWING INFORMATION:
Independent random sampling from two normally distributed populations gives the following results:
nx = 55,
= 520,σx = 30,ny = 45,
= 482,and σy = 24
Find the margin of error for a 98% confidence interval for the difference in the means of the two populations.
A)8.50
B)19.86
C)15.77
D)12.58
Independent random sampling from two normally distributed populations gives the following results:
nx = 55,
= 520,σx = 30,ny = 45,
= 482,and σy = 24
Find the margin of error for a 98% confidence interval for the difference in the means of the two populations.
A)8.50
B)19.86
C)15.77
D)12.58
Unlock Deck
Unlock for access to all 109 flashcards in this deck.
Unlock Deck
k this deck
38
THE NEXT QUESTIONS ARE BASED ON THE FOLLOWING INFORMATION:
A confidence interval for the difference between the means of two normally distributed populations based on the following dependent samples is desired:
What is the upper confidence limit of the 95% confidence interval?
A)0.42
B)1.48
C)0.043
D)0.05
A confidence interval for the difference between the means of two normally distributed populations based on the following dependent samples is desired:
What is the upper confidence limit of the 95% confidence interval?
A)0.42
B)1.48
C)0.043
D)0.05
Unlock Deck
Unlock for access to all 109 flashcards in this deck.
Unlock Deck
k this deck
39
THE NEXT QUESTIONS ARE BASED ON THE FOLLOWING INFORMATION:
A confidence interval for the difference between the means of two normally distributed populations based on the following dependent samples is desired:
What is the lower confidence limit of the 95% confidence interval?
A)-2.82
B)-3.88
C)2.45
D)3.88
A confidence interval for the difference between the means of two normally distributed populations based on the following dependent samples is desired:
What is the lower confidence limit of the 95% confidence interval?
A)-2.82
B)-3.88
C)2.45
D)3.88
Unlock Deck
Unlock for access to all 109 flashcards in this deck.
Unlock Deck
k this deck
40
THE NEXT QUESTIONS ARE BASED ON THE FOLLOWING INFORMATION:
A confidence interval for the difference between the means of two normally distributed populations based on the following dependent samples is desired:
What is the margin of error at 95% Confidence interval?
A)2.76
B)1.62
C)1.25
D)2.00
A confidence interval for the difference between the means of two normally distributed populations based on the following dependent samples is desired:
What is the margin of error at 95% Confidence interval?
A)2.76
B)1.62
C)1.25
D)2.00
Unlock Deck
Unlock for access to all 109 flashcards in this deck.
Unlock Deck
k this deck
41
THE NEXT QUESTIONS ARE BASED ON THE FOLLOWING INFORMATION:
From a random sample of ten students in an operations management class that uses group-learning techniques,the mean examination score was found to be 82.75 and the sample standard deviation was 3.24.For an independent random sample of eight students in another marketing research class that does not use group-learning techniques,the sample mean and standard deviation of exam scores were 75.62 and 7.27,respectively.It is assumed that the and unknown population variances are not assumed to be equal.
Find the 95% confidence for the difference between the two population mean scores.
A)7.13 ± 13.29
B)7.13 ± 0.97
C)7.13 ± 14.26
D)7.13 ± 6.16
Unlock Deck
Unlock for access to all 109 flashcards in this deck.
Unlock Deck
k this deck
42
THE NEXT QUESTIONS ARE BASED ON THE FOLLOWING INFORMATION:
A restaurant manager was in charge of purchasing new microwaves for his restaurant.The choices were narrowed to two available models.Since the two models cost about the same,the manager was interested in determining whether there was a difference in the amount of power consumed when operated at high voltages.Based on two independent random samples,the following summary information was computed:
Find a 99% confidence interval for the difference in the amount of power consumed at high voltages by the two models.
A)0.2 ± 0.86
B)0.2 ± 0.58
C)0.2 ± 0.64
D)0.2 ± 0.77
Unlock Deck
Unlock for access to all 109 flashcards in this deck.
Unlock Deck
k this deck
43
THE NEXT QUESTIONS ARE BASED ON THE FOLLOWING INFORMATION:
n1 = 35,
1 = 140
= 60.84;n2 = 48,
2 = 130,and
= 156.25
What is the lower confidence limit of the 95% confidence interval?
A)8.233
B)6.333
C)10.233
D)5.233
n1 = 35,
1 = 140
= 60.84;n2 = 48,
2 = 130,and
= 156.25
What is the lower confidence limit of the 95% confidence interval?
A)8.233
B)6.333
C)10.233
D)5.233
Unlock Deck
Unlock for access to all 109 flashcards in this deck.
Unlock Deck
k this deck
44
THE NEXT QUESTIONS ARE BASED ON THE FOLLOWING INFORMATION:
Two dependent random samples from two normally distributed populations gives the following results:
n = 10;
= 20.5;sd = 3.2
Find the lower confidence limit of the 95% confidence interval for the difference between the means of the two populations.
A)13.48
B)17.71
C)22.79
D)25.83
Two dependent random samples from two normally distributed populations gives the following results:
n = 10;
= 20.5;sd = 3.2
Find the lower confidence limit of the 95% confidence interval for the difference between the means of the two populations.
A)13.48
B)17.71
C)22.79
D)25.83
Unlock Deck
Unlock for access to all 109 flashcards in this deck.
Unlock Deck
k this deck
45
THE NEXT QUESTIONS ARE BASED ON THE FOLLOWING INFORMATION:
The residents of Austin,Texas,complain that parking fines given in their city are higher than the parking fines that are given in Houston.Independent random samples of the amounts paid by residents for parking tickets in each of two cities over the last four months were obtained.Assume the population variances are equal.These amounts were as follows:
What is the sample variance of the parking fines issued in Austin?
A)404.49
B)230.69
C)364.04
D)201.86
Unlock Deck
Unlock for access to all 109 flashcards in this deck.
Unlock Deck
k this deck
46
THE NEXT QUESTIONS ARE BASED ON THE FOLLOWING INFORMATION:
From a random sample of ten students in an operations management class that uses group-learning techniques,the mean examination score was found to be 82.75 and the sample standard deviation was 3.24.For an independent random sample of eight students in another marketing research class that does not use group-learning techniques,the sample mean and standard deviation of exam scores were 75.62 and 7.27,respectively.It is assumed that the and unknown population variances are not assumed to be equal.
Determine the number of degrees of freedom.
A)10
B)15
C)20
D)25
Unlock Deck
Unlock for access to all 109 flashcards in this deck.
Unlock Deck
k this deck
47
THE NEXT QUESTIONS ARE BASED ON THE FOLLOWING INFORMATION:
n1 = 35,
1 = 140
= 60.84;n2 = 48,
2 = 130,and
= 156.25
What is the upper confidence limit of the 95% confidence interval?
A)16.879
B)12.987
C)15.233
D)14.767
n1 = 35,
1 = 140
= 60.84;n2 = 48,
2 = 130,and
= 156.25
What is the upper confidence limit of the 95% confidence interval?
A)16.879
B)12.987
C)15.233
D)14.767
Unlock Deck
Unlock for access to all 109 flashcards in this deck.
Unlock Deck
k this deck
48
THE NEXT QUESTIONS ARE BASED ON THE FOLLOWING INFORMATION:
In a random sample of 150 large retailers,110 used regression as a method of forecasting.In an independent random sample of 180 small retailers,90 used regression as a method of forecasting.
Find the 90% confidence interval for the difference between the two population proportions.
A)0.23 ± 0.0482
B)0.23 ± 0.0854
C)1.23 ± 0.0482
D)1.23 ± 0.0854
Unlock Deck
Unlock for access to all 109 flashcards in this deck.
Unlock Deck
k this deck
49
THE NEXT QUESTIONS ARE BASED ON THE FOLLOWING INFORMATION:
The residents of Austin,Texas,complain that parking fines given in their city are higher than the parking fines that are given in Houston.Independent random samples of the amounts paid by residents for parking tickets in each of two cities over the last four months were obtained.Assume the population variances are equal.These amounts were as follows:
What is the mean of the parking fines issued in Austin?
A)97.88
B)146.75
C)78.30
D)117.40
Unlock Deck
Unlock for access to all 109 flashcards in this deck.
Unlock Deck
k this deck
50
THE NEXT QUESTIONS ARE BASED ON THE FOLLOWING INFORMATION:
The means and variances are obtained from two independent samples.Assume that the populations from which the samples were drawn have unequal variances.
Determine the number of degrees of freedom for n1 = 9, = 24,n2 = 14,and
= 36
A)14
B)20
C)25
D)32
The means and variances are obtained from two independent samples.Assume that the populations from which the samples were drawn have unequal variances.
Determine the number of degrees of freedom for n1 = 9,
= 24,n2 = 14,and = 36
A)14
B)20
C)25
D)32
Unlock Deck
Unlock for access to all 109 flashcards in this deck.
Unlock Deck
k this deck
51
THE NEXT QUESTIONS ARE BASED ON THE FOLLOWING INFORMATION:
A restaurant manager was in charge of purchasing new microwaves for his restaurant.The choices were narrowed to two available models.Since the two models cost about the same,the manager was interested in determining whether there was a difference in the amount of power consumed when operated at high voltages.Based on two independent random samples,the following summary information was computed:
Find a 90% confidence interval for the difference in the amount of power consumed at high voltages by the two models.
A)0.2 ± 0.49
B)0.2 ± 0.16
C)0.2 ± 0.05
D)0.2 ± 1.28
Unlock Deck
Unlock for access to all 109 flashcards in this deck.
Unlock Deck
k this deck
52
THE NEXT QUESTIONS ARE BASED ON THE FOLLOWING INFORMATION:
In a random sample of 150 large retailers,110 used regression as a method of forecasting.In an independent random sample of 180 small retailers,90 used regression as a method of forecasting.
Find the margin of error for a 90% confidence interval.
A)0.1453
B)0.0482
C)0.0854
D)0.1792
In a random sample of 150 large retailers,110 used regression as a method of forecasting.In an independent random sample of 180 small retailers,90 used regression as a method of forecasting.
Find the margin of error for a 90% confidence interval.
A)0.1453
B)0.0482
C)0.0854
D)0.1792
Unlock Deck
Unlock for access to all 109 flashcards in this deck.
Unlock Deck
k this deck
53
THE NEXT QUESTIONS ARE BASED ON THE FOLLOWING INFORMATION:
Two dependent random samples from two normally distributed populations gives the following results:
n = 10;
= 20.5;sd = 3.2
Find the width of the 95% confidence interval.
A)2.29
B)3.86
C)4.58
D)5.92
Two dependent random samples from two normally distributed populations gives the following results:
n = 10;
= 20.5;sd = 3.2
Find the width of the 95% confidence interval.
A)2.29
B)3.86
C)4.58
D)5.92
Unlock Deck
Unlock for access to all 109 flashcards in this deck.
Unlock Deck
k this deck
54
THE NEXT QUESTIONS ARE BASED ON THE FOLLOWING INFORMATION:
The residents of Austin,Texas,complain that parking fines given in their city are higher than the parking fines that are given in Houston.Independent random samples of the amounts paid by residents for parking tickets in each of two cities over the last four months were obtained.Assume the population variances are equal.These amounts were as follows:
Calculate the pooled sample variance.
A)595.042
B)468.006
C)328.455
D)554.593
Unlock Deck
Unlock for access to all 109 flashcards in this deck.
Unlock Deck
k this deck
55
THE NEXT QUESTIONS ARE BASED ON THE FOLLOWING INFORMATION:
Two dependent random samples from two normally distributed populations gives the following results:
n = 10;
= 20.5;sd = 3.2
Find the upper confidence limit of the 95% confidence interval for the difference between the means of the two populations.
A)13.48
B)18.21
C)22.29
D)25.83
Two dependent random samples from two normally distributed populations gives the following results:
n = 10;
= 20.5;sd = 3.2
Find the upper confidence limit of the 95% confidence interval for the difference between the means of the two populations.
A)13.48
B)18.21
C)22.29
D)25.83
Unlock Deck
Unlock for access to all 109 flashcards in this deck.
Unlock Deck
k this deck
56
THE NEXT QUESTIONS ARE BASED ON THE FOLLOWING INFORMATION:
n1 = 35,
1 = 140
= 60.84;n2 = 48,
2 = 130,and
= 156.25
Find the margin of error for a 95% confidence interval for the difference in the means of the two populations assuming that the population variances are equal.
A)4.002
B)4.767
C)5.365
D)3.645
n1 = 35,
1 = 140
= 60.84;n2 = 48,
2 = 130,and
= 156.25
Find the margin of error for a 95% confidence interval for the difference in the means of the two populations assuming that the population variances are equal.
A)4.002
B)4.767
C)5.365
D)3.645
Unlock Deck
Unlock for access to all 109 flashcards in this deck.
Unlock Deck
k this deck
57
THE NEXT QUESTIONS ARE BASED ON THE FOLLOWING INFORMATION:
The residents of Austin,Texas,complain that parking fines given in their city are higher than the parking fines that are given in Houston.Independent random samples of the amounts paid by residents for parking tickets in each of two cities over the last four months were obtained.Assume the population variances are equal.These amounts were as follows:
What is the mean of the parking fines issued in Houston?
A)97.88
B)146.75
C)78.30
D)117.40
Unlock Deck
Unlock for access to all 109 flashcards in this deck.
Unlock Deck
k this deck
58
THE NEXT QUESTIONS ARE BASED ON THE FOLLOWING INFORMATION:
The residents of Austin,Texas,complain that parking fines given in their city are higher than the parking fines that are given in Houston.Independent random samples of the amounts paid by residents for parking tickets in each of two cities over the last four months were obtained.Assume the population variances are equal.These amounts were as follows:
What is the sample variance of the parking fines issued in Houston?
A)404.49
B)230.69
C)364.04
D)201.86
Unlock Deck
Unlock for access to all 109 flashcards in this deck.
Unlock Deck
k this deck
59
THE NEXT QUESTIONS ARE BASED ON THE FOLLOWING INFORMATION:
A restaurant manager was in charge of purchasing new microwaves for his restaurant.The choices were narrowed to two available models.Since the two models cost about the same,the manager was interested in determining whether there was a difference in the amount of power consumed when operated at high voltages.Based on two independent random samples,the following summary information was computed:
Find a 95% confidence interval for the difference in the amount of power consumed at high voltages by the two models.
A)0.2 ± 0.49
B)0.2 ± 0.58
C)0.2 ± 0.64
D)0.2 ± 1.28
Unlock Deck
Unlock for access to all 109 flashcards in this deck.
Unlock Deck
k this deck
60
THE NEXT QUESTIONS ARE BASED ON THE FOLLOWING INFORMATION:
Two dependent random samples from two normally distributed populations gives the following results:
n = 10;
= 20.5;sd = 3.2
Find the margin of error for a 95% confidence interval for the difference between the means of the two populations.
A)2.29
B)5.86
C)3.44
D)8.10
Two dependent random samples from two normally distributed populations gives the following results:
n = 10;
= 20.5;sd = 3.2
Find the margin of error for a 95% confidence interval for the difference between the means of the two populations.
A)2.29
B)5.86
C)3.44
D)8.10
Unlock Deck
Unlock for access to all 109 flashcards in this deck.
Unlock Deck
k this deck
61
Calculate the pooled sample variance.
A)410.936
B)680.789
C)590.876
D)699.121
A)410.936
B)680.789
C)590.876
D)699.121
Unlock Deck
Unlock for access to all 109 flashcards in this deck.
Unlock Deck
k this deck
62
Determine the number of degrees of freedom.
A)16
B)22
C)19
D)14
A)16
B)22
C)19
D)14
Unlock Deck
Unlock for access to all 109 flashcards in this deck.
Unlock Deck
k this deck
63
Find the 95% confidence interval for the difference in the mean costs of parking tickets in these two cities.
A)19.57 ± 20.00
B)19.57 ± 20.38
C)19.57 ± 18.98
D)19.57 ± 17.68
A)19.57 ± 20.00
B)19.57 ± 20.38
C)19.57 ± 18.98
D)19.57 ± 17.68
Unlock Deck
Unlock for access to all 109 flashcards in this deck.
Unlock Deck
k this deck
64
The formula used to determine the number of degrees of freedom for the t distribution is (n1 + n2 - 2).
Unlock Deck
Unlock for access to all 109 flashcards in this deck.
Unlock Deck
k this deck
65
The margin of error of confidence intervals for the difference between two means,independent samples,and known population variances is given by
-
± zα/2
.
-
± zα/2
.
Unlock Deck
Unlock for access to all 109 flashcards in this deck.
Unlock Deck
k this deck
66
A 100(1- α)% confidence interval for the difference between two means,independent samples,and known population variances is given by
-
± zα/2
.
-
± zα/2
.
Unlock Deck
Unlock for access to all 109 flashcards in this deck.
Unlock Deck
k this deck
67
In order to measure the effectiveness of a weight loss program,members are weighed at the beginning and the end of the program.This is an example of independent samples with unequal population variances.
Unlock Deck
Unlock for access to all 109 flashcards in this deck.
Unlock Deck
k this deck
68
THE NEXT QUESTIONS ARE BASED ON THE FOLLOWING INFORMATION:
Consider the data in the table below.
What is the sample variance of the Group 1?
A)345.98
B)234.56
C)366.01
D)255.89
Consider the data in the table below.
What is the sample variance of the Group 1?
A)345.98
B)234.56
C)366.01
D)255.89
Unlock Deck
Unlock for access to all 109 flashcards in this deck.
Unlock Deck
k this deck
69
Certain situations that involve dependent samples are known as repeated measurements.
Unlock Deck
Unlock for access to all 109 flashcards in this deck.
Unlock Deck
k this deck
70
THE NEXT QUESTIONS ARE BASED ON THE FOLLOWING INFORMATION:
The residents of Austin,Texas,complain that parking fines given in their city are higher than the parking fines that are given in Houston.Independent random samples of the amounts paid by residents for parking tickets in each of two cities over the last four months were obtained.Assume the population variances are equal.These amounts were as follows:
Determine the number of degrees of freedom.
A)18
B)16
C)20
D)9
Unlock Deck
Unlock for access to all 109 flashcards in this deck.
Unlock Deck
k this deck
71
THE NEXT QUESTIONS ARE BASED ON THE FOLLOWING INFORMATION:
Consider the data in the table below.
What is the mean of the Group 2?
A)97.88
B)100.13
C)78.30
D)119.70
Consider the data in the table below.
What is the mean of the Group 2?
A)97.88
B)100.13
C)78.30
D)119.70
Unlock Deck
Unlock for access to all 109 flashcards in this deck.
Unlock Deck
k this deck
72
THE NEXT QUESTIONS ARE BASED ON THE FOLLOWING INFORMATION:
The residents of Austin,Texas,complain that parking fines given in their city are higher than the parking fines that are given in Houston.Independent random samples of the amounts paid by residents for parking tickets in each of two cities over the last four months were obtained.Assume the population variances are equal.These amounts were as follows:
Find the 98% confidence interval for the difference in the mean costs of parking tickets in these two cities.
A)19.52 ± 25.37
B)19.52 ± 20.38
C)19.52 ± 22.77
D)19.52 ± 22.21
Unlock Deck
Unlock for access to all 109 flashcards in this deck.
Unlock Deck
k this deck
73
THE NEXT QUESTIONS ARE BASED ON THE FOLLOWING INFORMATION:
Consider the data in the table below.
What is the sample variance of the Group 2?
A)468.70
B)366.01
C)456.19
D)490.67
Consider the data in the table below.
What is the sample variance of the Group 2?
A)468.70
B)366.01
C)456.19
D)490.67
Unlock Deck
Unlock for access to all 109 flashcards in this deck.
Unlock Deck
k this deck
74
THE NEXT QUESTIONS ARE BASED ON THE FOLLOWING INFORMATION:
Consider the data in the table below.
What is the mean of the Group 1?
A)119.70
B)121.67
C)115.60
D)117.65
Consider the data in the table below.
What is the mean of the Group 1?
A)119.70
B)121.67
C)115.60
D)117.65
Unlock Deck
Unlock for access to all 109 flashcards in this deck.
Unlock Deck
k this deck
75
While constructing a confidence interval for the mean difference in paired data,as the sample size increases,the width of the interval also increases.
Unlock Deck
Unlock for access to all 109 flashcards in this deck.
Unlock Deck
k this deck
76
The mean of the sampling distribution of the difference between sample proportions,
1 -
2,is equal to the difference between the corresponding population proportions,P1 - P2.
1 -
2,is equal to the difference between the corresponding population proportions,P1 - P2.
Unlock Deck
Unlock for access to all 109 flashcards in this deck.
Unlock Deck
k this deck
77
Assuming equal population variances,determine the number of degrees of freedom for the following: n1 = 16,
= 25;n2 = 20,and
= 30
A)36
B)18
C)38
D)34
= 25;n2 = 20,and
= 30
A)36
B)18
C)38
D)34
Unlock Deck
Unlock for access to all 109 flashcards in this deck.
Unlock Deck
k this deck
78
The Student's t-distribution is required to determine the confidence interval for the difference between two normal population means with unknown population variances.
Unlock Deck
Unlock for access to all 109 flashcards in this deck.
Unlock Deck
k this deck
79
The estimation procedure used to compare two population means when the sample values from the first population are influenced by the sample values from the second population is known as matched pairs.
Unlock Deck
Unlock for access to all 109 flashcards in this deck.
Unlock Deck
k this deck
80
For confidence intervals of two means that are dependent samples,the margin of error is equal to
tn-1,tα/s
.
tn-1,tα/s
.
Unlock Deck
Unlock for access to all 109 flashcards in this deck.
Unlock Deck
k this deck
Unlock Deck
Unlock for access to all 109 flashcards in this deck.


