Deck 7: Between the Extremes: Interaction and Strategy
Full screen (f)
Question
Question
Question
Question
Question
Question
Question
Question
Question
Question
Question
Question
Question
Question
Question
Question
Question
Question
Question
Question
Question
Question
The figure given below represents the total output and price produced in an oligopoly market characterized by a dominant firm and a fringe.SF represents the supply curve of the fringe, D is the market demand curve, DRES represents the residual demand curve of the dominant firm, MRRES represents the residual marginal revenue curve of the dominant firm, and MCD represents the marginal cost of the dominant firm.
Figure 7-1
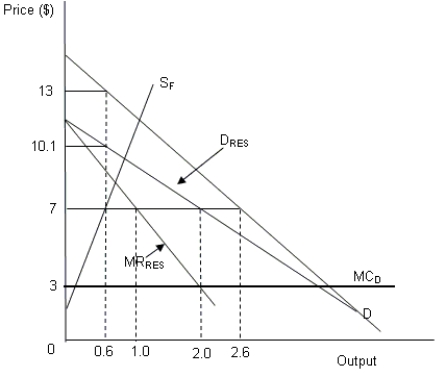
Refer to Figure 7-1.What will be the fringe's profit maximizing output?
A)0.6 unit
B)0.3 unit
C)1.6 units
D)2.6 units
Figure 7-1
Refer to Figure 7-1.What will be the fringe's profit maximizing output?
A)0.6 unit
B)0.3 unit
C)1.6 units
D)2.6 units
Question
Question
The figure given below represents the total output and price produced in an oligopoly market characterized by a dominant firm and a fringe.SF represents the supply curve of the fringe, D is the market demand curve, DRES represents the residual demand curve of the dominant firm, MRRES represents the residual marginal revenue curve of the dominant firm, and MCD represents the marginal cost of the dominant firm.
Figure 7-1
Refer to Figure 7-1.Which of the following price and output combinations represents the overall oligopoly market equilibrium?
A)Price = $3 and output = 2.6 units
B)Price = $10.1 and output = 0.6 unit
C)Price = $7 and output = 2.6 units
D)Price = $7 and output = 1 unit
Figure 7-1
Refer to Figure 7-1.Which of the following price and output combinations represents the overall oligopoly market equilibrium?
A)Price = $3 and output = 2.6 units
B)Price = $10.1 and output = 0.6 unit
C)Price = $7 and output = 2.6 units
D)Price = $7 and output = 1 unit
Question
The following matrix represents the payoffs to two producers, each making a strategic choice either to keep the output at 5 units or at 10 units.
Table 7-1
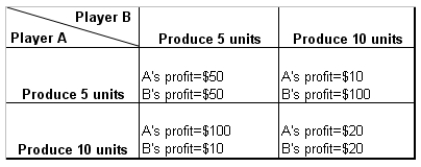
Refer to Table 7-1.Which of the following payoffs would be received by the two players if both decide to break the agreement?
A)Each player would enjoy profits worth $50.
B)Each player would incur a loss worth $10.
C)Each player would enjoy profits worth $20.
D)Each player would enjoy profits worth $100.
Table 7-1
Refer to Table 7-1.Which of the following payoffs would be received by the two players if both decide to break the agreement?
A)Each player would enjoy profits worth $50.
B)Each player would incur a loss worth $10.
C)Each player would enjoy profits worth $20.
D)Each player would enjoy profits worth $100.
Question
The following matrix represents the payoffs to two producers, each making a strategic choice either to keep the output at 5 units or at 10 units.
Table 7-1
Refer to Table 7-1.Assume that the law allows players (firms of equal sizes) in Table 7-1 to make enforceable agreements.Which of the following agreements are they likely to form?
A)Player A and Player B would produce 5 units each.
B)Player A and Player B would produce 10 units each.
C)Player A would produce 10 units and Player B would produce 5 units.
D)Player B would produce 10 units and Player A would produce 5 units.
Question
The following matrix represents the payoffs to two producers, each making a strategic choice either to keep the output at 5 units or at 10 units.
Table 7-1
Refer to Table 7-1.The matrix shown in this table is known as the:
A)matrix of choices.
B)matrix of strategies.
C)normal form of the game.
D)advanced form of the game.
Table 7-1
Refer to Table 7-1.The matrix shown in this table is known as the:
A)matrix of choices.
B)matrix of strategies.
C)normal form of the game.
D)advanced form of the game.
Question
Question
Question
The figure given below represents the total output and price produced in an oligopoly market characterized by a dominant firm and a fringe.SF represents the supply curve of the fringe, D is the market demand curve, DRES represents the residual demand curve of the dominant firm, MRRES represents the residual marginal revenue curve of the dominant firm, and MCD represents the marginal cost of the dominant firm.
Figure 7-1
Refer to Figure 7-1.If the supply curve of the fringe SF becomes steeper, which of the following changes will be observed in the oligopoly market?
A)The residual demand curve DRES will become less elastic
B)The dominant firm's profits will decrease
C)The fringe's profit will decrease
D)The dominant firm's market share will decrease
Question
The figure given below represents the total output and price produced in an oligopoly market characterized by a dominant firm and a fringe.SF represents the supply curve of the fringe, D is the market demand curve, DRES represents the residual demand curve of the dominant firm, MRRES represents the residual marginal revenue curve of the dominant firm, and MCD represents the marginal cost of the dominant firm.
Figure 7-1
Refer to Figure 7-1.Assume that in the long run new firms enter the market lowering the total cost incurred by the fringe firms below the same incurred by the dominant firm.Which of the following situations will arise?
A)The fringe supply will rotate leftward and downward reducing its profit.
B)The dominant firms market share and profit will both increase.
C)The dominant firm will be totally displaced by the fringe.
D)The fringe's market power will decrease.
Question
The figure given below represents the total output and price produced in an oligopoly market characterized by a dominant firm and a fringe.SF represents the supply curve of the fringe, D is the market demand curve, DRES represents the residual demand curve of the dominant firm, MRRES represents the residual marginal revenue curve of the dominant firm, and MCD represents the marginal cost of the dominant firm.
Figure 7-1
Refer to Figure 7-1.What will be the dominant firm's profit maximizing output?
A)1 unit
B)2 units
C)2.6 units
D)0.6 unit
Figure 7-1
Refer to Figure 7-1.What will be the dominant firm's profit maximizing output?
A)1 unit
B)2 units
C)2.6 units
D)0.6 unit
Question
The figure given below represents the total output and price produced in an oligopoly market characterized by a dominant firm and a fringe.SF represents the supply curve of the fringe, D is the market demand curve, DRES represents the residual demand curve of the dominant firm, MRRES represents the residual marginal revenue curve of the dominant firm, and MCD represents the marginal cost of the dominant firm.
Figure 7-1
Refer to Figure 7-1.If the market demand curve D rotates outward (while its vertical intercept remains unchanged), which of the following changes will be observed in the oligopoly market?
A)The fringe's market share will decline
B)The dominant firm's profits will decrease
C)The marginal cost will decrease
D)The overall market price will decline
Question
Question
The figure given below represents the total output and price produced in an oligopoly market characterized by a dominant firm and a fringe.SF represents the supply curve of the fringe, D is the market demand curve, DRES represents the residual demand curve of the dominant firm, MRRES represents the residual marginal revenue curve of the dominant firm, and MCD represents the marginal cost of the dominant firm.
Figure 7-1
Refer to Figure 7-1.If the dominant firm decides to maximize the present value of his future profits and threatens a price war:
A)new firms will not enter the oligopoly market.
B)new firms will enter the oligopoly market.
C)the market share of the existing fringe would increase.
D)the market share of the dominant firm would increase.
Question
Question
Question
Question
The following matrix represents the payoffs to two producers, each making a strategic choice either to keep the output at 5 units or at 10 units.
Table 7-1
Refer to Table 7-1.Which of the following output combinations represents the dominant strategy of the two players?
A)Each player produces 5 units of output.
B)Player A produces 5 units and Player B produces 10 units.
C)Player A produces 10 units and Player B produces 5 units.
D)Each player produces 10 units of output.
Question
Question
The figure given below represents the output choices of each of the two oligopolists, given the choices of its competitor.QA and QB are the quantities of output produced by Producer A and Producer B.The marginal cost of production is zero for both producers.
Figure 7-2
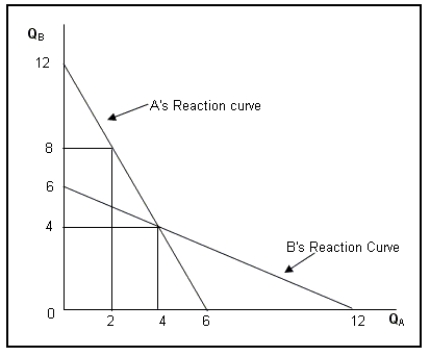
Refer to Figure 7-2.If the two producers agree to act as a single monopoly firm, what will be the total output produced in the economy?
A)10 units
B)6 units
C)12 units
D)3 units
Figure 7-2
Refer to Figure 7-2.If the two producers agree to act as a single monopoly firm, what will be the total output produced in the economy?
A)10 units
B)6 units
C)12 units
D)3 units
Question
Suppose Chord are Fredler are two automobile manufacturers, each of whom is deciding whether to launch a new model of car or increase the production of their existing models.The payoffs which each receive are provided in the matrix given below.
Table 7-2
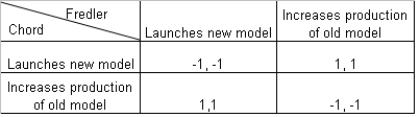
Refer to Table 7-2.Which of the following strategic choices represents the Nash equilibrium?
A)Chord increases the production of existing cars and Fredler launches a new model of car; Chord launches a new model of car and Fredler increases production.
B)Both Chord and Fredler launch new models of cars.
C)Both Chord and Fredler increase production of their existing cars.
D)Chord increases production and Fredler decides to launch a new model of car.
Table 7-2
Refer to Table 7-2.Which of the following strategic choices represents the Nash equilibrium?
A)Chord increases the production of existing cars and Fredler launches a new model of car; Chord launches a new model of car and Fredler increases production.
B)Both Chord and Fredler launch new models of cars.
C)Both Chord and Fredler increase production of their existing cars.
D)Chord increases production and Fredler decides to launch a new model of car.
Question
Question
Question
Question
Question
The figure given below represents the output choices of each of the two oligopolists, given the choices of its competitor.QA and QB are the quantities of output produced by Producer A and Producer B.The marginal cost of production is zero for both producers.
Figure 7-2
Refer to Figure 7-2.If Producer A and Producer B act as a price-takers what will be the total output produced in the market?
A)12 units
B)6 units
C)4 units
D)2 units
Figure 7-2
Refer to Figure 7-2.If Producer A and Producer B act as a price-takers what will be the total output produced in the market?
A)12 units
B)6 units
C)4 units
D)2 units
Question
Question
Question
Question
Question
Question
Question
Question
The figure given below represents the output choices of each of the two oligopolists, given the choices of its competitor.QA and QB are the quantities of output produced by Producer A and Producer B.The marginal cost of production is zero for both producers.
Figure 7-2
Refer to Figure 7-2.Suppose the government imposes a tax of $1.5 on each unit of A's output.Which of the following changes in the total output will be observed under Cournot equilibrium?
A)Total output will decrease although the market share of the producers will remain same.
B)Producer B's output will increase leading to a rise in total output.
C)Producer A's output will decline leading to a fall in total output.
D)The market share of the Producer A will fall, while that of B will increase.
Question
The figure given below represents the output choices of each of the two oligopolists, given the choices of its competitor.QA and QB are the quantities of output produced by Producer A and Producer B.The marginal cost of production is zero for both producers.
Figure 7-2
Refer to Figure 7-2.Determine the total production in this market under Cournot equilibrium?
A)6 units
B)12 units
C)8 units
D)20 units
Figure 7-2
Refer to Figure 7-2.Determine the total production in this market under Cournot equilibrium?
A)6 units
B)12 units
C)8 units
D)20 units
Question
Table 7-3
Refer to Table 7-3.What will be the Nash equilibrium if there is no interaction between the two students?
A)Student A will confess while Student B will remain silent.
B)Student B will confess while Student A will remain silent.
C)Both the students will confess.
D)Both the students will remain silent.
Question
Question
Question
Question
Question
Question
Question
Question
Question

Unlock Deck
Sign up to unlock the cards in this deck!
Unlock Deck
Unlock Deck
1/66
Play
Full screen (f)
Deck 7: Between the Extremes: Interaction and Strategy
1
In oligopoly outcomes, the dominant firm's profitability depends on how the fringe, consisting of small competing sellers, responds to its choices.
True
2
Post deregulation, airlines attempted to maintain their earlier profit levels by instituting price discrimination in such forms as advance purchase ticket restrictions and frequent-flyer mileage programs.These methods generally did not succeed in maintaining those profit levels.
True
3
After the deregulation of the airline industry, the new airlines had a competitive cost advantage over the older ones as:
A)they could practice price discrimination.
B)they did not bear any legacy cost.
C)they enjoyed economies of scale.
D)they had to pay lower fuel surcharge.
A)they could practice price discrimination.
B)they did not bear any legacy cost.
C)they enjoyed economies of scale.
D)they had to pay lower fuel surcharge.
B
4
If the supply curve of the fringe in the oligopoly market is highly elastic:
A)the dominant firm will command a higher share of market output.
B)the price chosen by the dominant firm will be high.
C)the dominant firm's profit will be lower.
D)the market price for the commodity will be low.
A)the dominant firm will command a higher share of market output.
B)the price chosen by the dominant firm will be high.
C)the dominant firm's profit will be lower.
D)the market price for the commodity will be low.
Unlock Deck
Unlock for access to all 66 flashcards in this deck.
Unlock Deck
k this deck
5
In the long run, even if new fringe firms enter the oligopoly market, the dominant firm's profit will remain unaltered.
Unlock Deck
Unlock for access to all 66 flashcards in this deck.
Unlock Deck
k this deck
6
In a mixed strategy situation, a player does best by unpredictably mixing his strategies in accordance with probabilities that depend on the strategies of the others.
Unlock Deck
Unlock for access to all 66 flashcards in this deck.
Unlock Deck
k this deck
7
In an ascending value auction, a bidder attempts to win a certain object by bidding a price below his valuation but higher than anyone else's bid.
Unlock Deck
Unlock for access to all 66 flashcards in this deck.
Unlock Deck
k this deck
8
The smaller U.S.mainframe computer and peripheral equipment manufacturers of the 1960s (the "Bunch") were perfect competitors, since they produced homogenous products and had little control over the market price.
Unlock Deck
Unlock for access to all 66 flashcards in this deck.
Unlock Deck
k this deck
9
In a price-fixing agreement amongst two oligopolists, each seller's best strategy would be to maintain the agreement, as it would leave both of them better off.
Unlock Deck
Unlock for access to all 66 flashcards in this deck.
Unlock Deck
k this deck
10
Which of the following is a characteristic of the oligopoly model?
A)The oligopoly market consists of only a small number of sellers.
B)The sellers in an oligopoly market are price takers.
C)The output decisions taken by sellers are uniform and steady.
D)There are barriers to the exit of firms in an oligopoly market.
A)The oligopoly market consists of only a small number of sellers.
B)The sellers in an oligopoly market are price takers.
C)The output decisions taken by sellers are uniform and steady.
D)There are barriers to the exit of firms in an oligopoly market.
Unlock Deck
Unlock for access to all 66 flashcards in this deck.
Unlock Deck
k this deck
11
If two players in an oligopoly game enter into an agreement whereby one player makes a grim trigger, the other player will honor the agreement only if its (i.e.the other's) annual discount rate is high.
Unlock Deck
Unlock for access to all 66 flashcards in this deck.
Unlock Deck
k this deck
12
Games with a finite number of strategies do not always have a Nash equilibrium.
Unlock Deck
Unlock for access to all 66 flashcards in this deck.
Unlock Deck
k this deck
13
In an oligopoly market with a dominant firm and a competitive fringe, if market demand is _____, the market price will be low and the _____ profit will be small.
A)less elastic; fringe's
B)less elastic; dominant firm's
C)more elastic; fringe's
D)more elastic; dominant firm's
A)less elastic; fringe's
B)less elastic; dominant firm's
C)more elastic; fringe's
D)more elastic; dominant firm's
Unlock Deck
Unlock for access to all 66 flashcards in this deck.
Unlock Deck
k this deck
14
One of the possible reasons for high sales and steady profit margins of General Motors, Ford, and Chrysler during 1950s and 1960s were aggressive pricing and design innovations.
Unlock Deck
Unlock for access to all 66 flashcards in this deck.
Unlock Deck
k this deck
15
The Stackelberg model of oligopoly assumes that each of the two producers will choose prices instead of quantities and neither will change price in response to the other's decision.
Unlock Deck
Unlock for access to all 66 flashcards in this deck.
Unlock Deck
k this deck
16
The smaller the share of the fringe firms in an oligopoly market, the smaller will be the profit earned by the dominant firm.
Unlock Deck
Unlock for access to all 66 flashcards in this deck.
Unlock Deck
k this deck
17
The demand curve faced by a dominant firm in an oligopoly model is the difference between the market demand and the supply that the fringe will produce at each price.
Unlock Deck
Unlock for access to all 66 flashcards in this deck.
Unlock Deck
k this deck
18
In finitely repeated price-fixing game, the dominant strategy of each player is to break the agreement on every play.
Unlock Deck
Unlock for access to all 66 flashcards in this deck.
Unlock Deck
k this deck
19
An oligopoly market is characterized by limited number of sellers, each having complete control over the market price level as in case of monopoly.
Unlock Deck
Unlock for access to all 66 flashcards in this deck.
Unlock Deck
k this deck
20
In the long run, if new fringe firms with same cost structures as existing fringe firms enter the oligopoly market:
A)the dominant firm's ability to extract profit from the market decreases.
B)the fringe's ability to extract profit from the market decreases.
C)the fringe supply curve rotates leftward and downward.
D)the dominant firm's residual demand curve rotates rightward.
A)the dominant firm's ability to extract profit from the market decreases.
B)the fringe's ability to extract profit from the market decreases.
C)the fringe supply curve rotates leftward and downward.
D)the dominant firm's residual demand curve rotates rightward.
Unlock Deck
Unlock for access to all 66 flashcards in this deck.
Unlock Deck
k this deck
21
Suppose the market demand curve (D) in an oligopoly market characterized by a dominant firm and a fringe is given by Q = 25 - 2P.The fringe supply curve is given by QF = -1 + 0.3P.If the marginal cost of production for the dominant is $3, calculate the market price and total output produced by the dominant firm and the fringe.
A)Q = 14.42 units and P = $8.64
B)Q = 10.69 units and P = $7.15
C)Q = 12.69 units and P = $6.5
D)Q = 8.74 units and P = $5.15
A)Q = 14.42 units and P = $8.64
B)Q = 10.69 units and P = $7.15
C)Q = 12.69 units and P = $6.5
D)Q = 8.74 units and P = $5.15
Unlock Deck
Unlock for access to all 66 flashcards in this deck.
Unlock Deck
k this deck
22
The figure given below represents the total output and price produced in an oligopoly market characterized by a dominant firm and a fringe.SF represents the supply curve of the fringe, D is the market demand curve, DRES represents the residual demand curve of the dominant firm, MRRES represents the residual marginal revenue curve of the dominant firm, and MCD represents the marginal cost of the dominant firm.
Figure 7-1
Refer to Figure 7-1.What will be the fringe's profit maximizing output?
A)0.6 unit
B)0.3 unit
C)1.6 units
D)2.6 units
Figure 7-1
Refer to Figure 7-1.What will be the fringe's profit maximizing output?
A)0.6 unit
B)0.3 unit
C)1.6 units
D)2.6 units
Unlock Deck
Unlock for access to all 66 flashcards in this deck.
Unlock Deck
k this deck
23
An agreement between the dominant firm and the fringe members to keep output low often breaks because:
A)the fringe firms usually appropriate a larger share of the profits.
B)the agreement is not self enforcing.
C)the dominant firm usually appropriates a larger share of the profits.
D)both have an incentive to charge a higher price for their output.
A)the fringe firms usually appropriate a larger share of the profits.
B)the agreement is not self enforcing.
C)the dominant firm usually appropriates a larger share of the profits.
D)both have an incentive to charge a higher price for their output.
Unlock Deck
Unlock for access to all 66 flashcards in this deck.
Unlock Deck
k this deck
24
The figure given below represents the total output and price produced in an oligopoly market characterized by a dominant firm and a fringe.SF represents the supply curve of the fringe, D is the market demand curve, DRES represents the residual demand curve of the dominant firm, MRRES represents the residual marginal revenue curve of the dominant firm, and MCD represents the marginal cost of the dominant firm.
Figure 7-1
Refer to Figure 7-1.Which of the following price and output combinations represents the overall oligopoly market equilibrium?
A)Price = $3 and output = 2.6 units
B)Price = $10.1 and output = 0.6 unit
C)Price = $7 and output = 2.6 units
D)Price = $7 and output = 1 unit
Figure 7-1
Refer to Figure 7-1.Which of the following price and output combinations represents the overall oligopoly market equilibrium?
A)Price = $3 and output = 2.6 units
B)Price = $10.1 and output = 0.6 unit
C)Price = $7 and output = 2.6 units
D)Price = $7 and output = 1 unit
Unlock Deck
Unlock for access to all 66 flashcards in this deck.
Unlock Deck
k this deck
25
The following matrix represents the payoffs to two producers, each making a strategic choice either to keep the output at 5 units or at 10 units.
Table 7-1
Refer to Table 7-1.Which of the following payoffs would be received by the two players if both decide to break the agreement?
A)Each player would enjoy profits worth $50.
B)Each player would incur a loss worth $10.
C)Each player would enjoy profits worth $20.
D)Each player would enjoy profits worth $100.
Unlock Deck
Unlock for access to all 66 flashcards in this deck.
Unlock Deck
k this deck
26
The following matrix represents the payoffs to two producers, each making a strategic choice either to keep the output at 5 units or at 10 units.
Table 7-1
Refer to Table 7-1.Assume that the law allows players (firms of equal sizes) in Table 7-1 to make enforceable agreements.Which of the following agreements are they likely to form?
A)Player A and Player B would produce 5 units each.
B)Player A and Player B would produce 10 units each.
C)Player A would produce 10 units and Player B would produce 5 units.
D)Player B would produce 10 units and Player A would produce 5 units.
Unlock Deck
Unlock for access to all 66 flashcards in this deck.
Unlock Deck
k this deck
27
The following matrix represents the payoffs to two producers, each making a strategic choice either to keep the output at 5 units or at 10 units.
Table 7-1
Refer to Table 7-1.The matrix shown in this table is known as the:
A)matrix of choices.
B)matrix of strategies.
C)normal form of the game.
D)advanced form of the game.
Table 7-1
Refer to Table 7-1.The matrix shown in this table is known as the:
A)matrix of choices.
B)matrix of strategies.
C)normal form of the game.
D)advanced form of the game.
Unlock Deck
Unlock for access to all 66 flashcards in this deck.
Unlock Deck
k this deck
28
Assume that in a price-fixing game, if Player A breaks the agreement in the first year, she earns $11 while Player B earns $5.However, if Player A breaks the agreement once, Player B decides to break the agreement for eternity, leaving each to receive $8 per year for the rest of their lives.If they both keep the agreement each receives $9 per year for the rest of their life.If the discount rate is 120 percent per period:
A)Player A will prefer to break the agreement in the first year.
B)Player A will prefer to break the agreement in the second year.
C)Player A will prefer to keep the agreement throughout her life.
D)Player A will prefer to keep the agreement only for the first five years.
A)Player A will prefer to break the agreement in the first year.
B)Player A will prefer to break the agreement in the second year.
C)Player A will prefer to keep the agreement throughout her life.
D)Player A will prefer to keep the agreement only for the first five years.
Unlock Deck
Unlock for access to all 66 flashcards in this deck.
Unlock Deck
k this deck
29
The principle of backward induction proves that in price-fixing oligopoly games:
A)the players honor the agreement if the game is repeated.
B)the players honor the agreement if the game is played five times.
C)the players dishonor the agreement if the game is not played more than twice.
D)the players dishonor the agreement if the game is repeated a number of times, as determined prior to the start of play.
Unlock Deck
Unlock for access to all 66 flashcards in this deck.
Unlock Deck
k this deck
30
The figure given below represents the total output and price produced in an oligopoly market characterized by a dominant firm and a fringe.SF represents the supply curve of the fringe, D is the market demand curve, DRES represents the residual demand curve of the dominant firm, MRRES represents the residual marginal revenue curve of the dominant firm, and MCD represents the marginal cost of the dominant firm.
Figure 7-1
Refer to Figure 7-1.If the supply curve of the fringe SF becomes steeper, which of the following changes will be observed in the oligopoly market?
A)The residual demand curve DRES will become less elastic
B)The dominant firm's profits will decrease
C)The fringe's profit will decrease
D)The dominant firm's market share will decrease
Unlock Deck
Unlock for access to all 66 flashcards in this deck.
Unlock Deck
k this deck
31
The figure given below represents the total output and price produced in an oligopoly market characterized by a dominant firm and a fringe.SF represents the supply curve of the fringe, D is the market demand curve, DRES represents the residual demand curve of the dominant firm, MRRES represents the residual marginal revenue curve of the dominant firm, and MCD represents the marginal cost of the dominant firm.
Figure 7-1
Refer to Figure 7-1.Assume that in the long run new firms enter the market lowering the total cost incurred by the fringe firms below the same incurred by the dominant firm.Which of the following situations will arise?
A)The fringe supply will rotate leftward and downward reducing its profit.
B)The dominant firms market share and profit will both increase.
C)The dominant firm will be totally displaced by the fringe.
D)The fringe's market power will decrease.
Unlock Deck
Unlock for access to all 66 flashcards in this deck.
Unlock Deck
k this deck
32
The figure given below represents the total output and price produced in an oligopoly market characterized by a dominant firm and a fringe.SF represents the supply curve of the fringe, D is the market demand curve, DRES represents the residual demand curve of the dominant firm, MRRES represents the residual marginal revenue curve of the dominant firm, and MCD represents the marginal cost of the dominant firm.
Figure 7-1
Refer to Figure 7-1.What will be the dominant firm's profit maximizing output?
A)1 unit
B)2 units
C)2.6 units
D)0.6 unit
Figure 7-1
Refer to Figure 7-1.What will be the dominant firm's profit maximizing output?
A)1 unit
B)2 units
C)2.6 units
D)0.6 unit
Unlock Deck
Unlock for access to all 66 flashcards in this deck.
Unlock Deck
k this deck
33
The figure given below represents the total output and price produced in an oligopoly market characterized by a dominant firm and a fringe.SF represents the supply curve of the fringe, D is the market demand curve, DRES represents the residual demand curve of the dominant firm, MRRES represents the residual marginal revenue curve of the dominant firm, and MCD represents the marginal cost of the dominant firm.
Figure 7-1
Refer to Figure 7-1.If the market demand curve D rotates outward (while its vertical intercept remains unchanged), which of the following changes will be observed in the oligopoly market?
A)The fringe's market share will decline
B)The dominant firm's profits will decrease
C)The marginal cost will decrease
D)The overall market price will decline
Unlock Deck
Unlock for access to all 66 flashcards in this deck.
Unlock Deck
k this deck
34
A gaming strategy in which one player states that he/she would break the agreement for eternity if his/her co-player breaks the agreement once is called:
A)a grim trigger.
B)a credible threat.
C)a chain-store paradox.
D)a dominance pull.
A)a grim trigger.
B)a credible threat.
C)a chain-store paradox.
D)a dominance pull.
Unlock Deck
Unlock for access to all 66 flashcards in this deck.
Unlock Deck
k this deck
35
The figure given below represents the total output and price produced in an oligopoly market characterized by a dominant firm and a fringe.SF represents the supply curve of the fringe, D is the market demand curve, DRES represents the residual demand curve of the dominant firm, MRRES represents the residual marginal revenue curve of the dominant firm, and MCD represents the marginal cost of the dominant firm.
Figure 7-1
Refer to Figure 7-1.If the dominant firm decides to maximize the present value of his future profits and threatens a price war:
A)new firms will not enter the oligopoly market.
B)new firms will enter the oligopoly market.
C)the market share of the existing fringe would increase.
D)the market share of the dominant firm would increase.
Unlock Deck
Unlock for access to all 66 flashcards in this deck.
Unlock Deck
k this deck
36
High barriers to entry protect the market power of existing firms and discourage the formation of firms which:
A)invest heavily in research and development activities.
B)use illegal procedures to capture the market.
C)are inefficiently small and cannot realize economies of scale.
D)are large enough to dominate the existing firms.
A)invest heavily in research and development activities.
B)use illegal procedures to capture the market.
C)are inefficiently small and cannot realize economies of scale.
D)are large enough to dominate the existing firms.
Unlock Deck
Unlock for access to all 66 flashcards in this deck.
Unlock Deck
k this deck
37
Which of the following factors can delay the entry of new competitive firms into the oligopoly market characterized by a dominant firm and some fringe firms?
A)Mergers and acquisitions
B)Price threat
C)Brandname and reputation of the dominant firm
D)Quality controls set by the government
A)Mergers and acquisitions
B)Price threat
C)Brandname and reputation of the dominant firm
D)Quality controls set by the government
Unlock Deck
Unlock for access to all 66 flashcards in this deck.
Unlock Deck
k this deck
38
Assume that in a price-fixing game, if Player A breaks the agreement in the first year, she earns $11 while Player B earns $5.However, if Player A breaks the agreement once, Player B decides to break the agreement for eternity, leaving each to receive $8 per year for the rest of their lives.If they both keep the agreement each receives $9 per year for the rest of their lives.If the discount rate is 30 percent per period:
A)Player A will prefer to break the agreement in the first year.
B)Player A will prefer to break the agreement in the second year.
C)Player A will prefer to keep the agreement throughout her life.
D)Player A will prefer to keep the agreement only for the first five years.
A)Player A will prefer to break the agreement in the first year.
B)Player A will prefer to break the agreement in the second year.
C)Player A will prefer to keep the agreement throughout her life.
D)Player A will prefer to keep the agreement only for the first five years.
Unlock Deck
Unlock for access to all 66 flashcards in this deck.
Unlock Deck
k this deck
39
The following matrix represents the payoffs to two producers, each making a strategic choice either to keep the output at 5 units or at 10 units.
Table 7-1
Refer to Table 7-1.Which of the following output combinations represents the dominant strategy of the two players?
A)Each player produces 5 units of output.
B)Player A produces 5 units and Player B produces 10 units.
C)Player A produces 10 units and Player B produces 5 units.
D)Each player produces 10 units of output.
Unlock Deck
Unlock for access to all 66 flashcards in this deck.
Unlock Deck
k this deck
40
When all players are choosing their best strategies on the assumption that their opponents are doing likewise, the outcome is called:
A)a Stackelberg equilibrium.
B)a Nash equilibrium.
C)a Cournot equilibrium.
D)a Bertrand equilibrium.
A)a Stackelberg equilibrium.
B)a Nash equilibrium.
C)a Cournot equilibrium.
D)a Bertrand equilibrium.
Unlock Deck
Unlock for access to all 66 flashcards in this deck.
Unlock Deck
k this deck
41
The figure given below represents the output choices of each of the two oligopolists, given the choices of its competitor.QA and QB are the quantities of output produced by Producer A and Producer B.The marginal cost of production is zero for both producers.
Figure 7-2
Refer to Figure 7-2.If the two producers agree to act as a single monopoly firm, what will be the total output produced in the economy?
A)10 units
B)6 units
C)12 units
D)3 units
Figure 7-2
Refer to Figure 7-2.If the two producers agree to act as a single monopoly firm, what will be the total output produced in the economy?
A)10 units
B)6 units
C)12 units
D)3 units
Unlock Deck
Unlock for access to all 66 flashcards in this deck.
Unlock Deck
k this deck
42
Suppose Chord are Fredler are two automobile manufacturers, each of whom is deciding whether to launch a new model of car or increase the production of their existing models.The payoffs which each receive are provided in the matrix given below.
Table 7-2
Refer to Table 7-2.Which of the following strategic choices represents the Nash equilibrium?
A)Chord increases the production of existing cars and Fredler launches a new model of car; Chord launches a new model of car and Fredler increases production.
B)Both Chord and Fredler launch new models of cars.
C)Both Chord and Fredler increase production of their existing cars.
D)Chord increases production and Fredler decides to launch a new model of car.
Unlock Deck
Unlock for access to all 66 flashcards in this deck.
Unlock Deck
k this deck
43
In a Betrand price-setting duopoly model, the equilibrium output:
A)will be equal to the monopoly output.
B)will be equal to the competitive market output.
C)will lie between the monopoly and the competitive market output.
D)will be higher than the monopoly output.
A)will be equal to the monopoly output.
B)will be equal to the competitive market output.
C)will lie between the monopoly and the competitive market output.
D)will be higher than the monopoly output.
Unlock Deck
Unlock for access to all 66 flashcards in this deck.
Unlock Deck
k this deck
44
In a first-price auction:
A)the lowest bidder receives its actual bid as a payment for the job.
B)the lowest bidder wins the bid and pays the amount bid by the first runner-up.
C)the bidder bids less than its cost and incurs a loss.
D)the lowest bidder wins the bid and has to pay the actual bid for the good.
A)the lowest bidder receives its actual bid as a payment for the job.
B)the lowest bidder wins the bid and pays the amount bid by the first runner-up.
C)the bidder bids less than its cost and incurs a loss.
D)the lowest bidder wins the bid and has to pay the actual bid for the good.
Unlock Deck
Unlock for access to all 66 flashcards in this deck.
Unlock Deck
k this deck
45
Why do competitive firms enter the market in spite of the price war threatened by the dominant firm?
Unlock Deck
Unlock for access to all 66 flashcards in this deck.
Unlock Deck
k this deck
46
Which of the following statements about Nash equilibrium is true?
A)Every finite game has more than one Nash equilibrium.
B)A pair of dominant strategies in a price-fixing game is always a Nash equilibrium.
C)A dominance solvable game does not have a Nash equilibrium.
D)Games with an infinite number of strategies have multiple Nash equilibria.
A)Every finite game has more than one Nash equilibrium.
B)A pair of dominant strategies in a price-fixing game is always a Nash equilibrium.
C)A dominance solvable game does not have a Nash equilibrium.
D)Games with an infinite number of strategies have multiple Nash equilibria.
Unlock Deck
Unlock for access to all 66 flashcards in this deck.
Unlock Deck
k this deck
47
The figure given below represents the output choices of each of the two oligopolists, given the choices of its competitor.QA and QB are the quantities of output produced by Producer A and Producer B.The marginal cost of production is zero for both producers.
Figure 7-2
Refer to Figure 7-2.If Producer A and Producer B act as a price-takers what will be the total output produced in the market?
A)12 units
B)6 units
C)4 units
D)2 units
Figure 7-2
Refer to Figure 7-2.If Producer A and Producer B act as a price-takers what will be the total output produced in the market?
A)12 units
B)6 units
C)4 units
D)2 units
Unlock Deck
Unlock for access to all 66 flashcards in this deck.
Unlock Deck
k this deck
48
Which of the following assumptions were made by the Cournot model of oligopoly?
A)Each seller psychoanalyzes the competition and decides how to react in all possible situations.
B)Each seller psychoanalyzes the competition and exactly predicts the output decisions of the competitors.
C)Each seller chooses its own output and believes the others in the market will respond to its choices.
D)Each seller chooses its own output and believes the others in the market will not respond to its choices.
Unlock Deck
Unlock for access to all 66 flashcards in this deck.
Unlock Deck
k this deck
49
In a game, which strategic choice is called a dominant strategy?
Unlock Deck
Unlock for access to all 66 flashcards in this deck.
Unlock Deck
k this deck
50
In the Stackelberg leadership model,
A)the leader earns a larger profit compared to the follower.
B)the leader charges a higher price for its output compared to the follower.
C)the follower produces a larger output compared to the leader.
D)the follower charges a lower price for its output compared to the leader.
A)the leader earns a larger profit compared to the follower.
B)the leader charges a higher price for its output compared to the follower.
C)the follower produces a larger output compared to the leader.
D)the follower charges a lower price for its output compared to the leader.
Unlock Deck
Unlock for access to all 66 flashcards in this deck.
Unlock Deck
k this deck
51
Which of the following games will have a solution in mixed strategies?
A)A price-fixing game
B)A Prisoner's dilemma
C)A drafting game used by racing cars.
D)A product choice game with asymmetric profits
A)A price-fixing game
B)A Prisoner's dilemma
C)A drafting game used by racing cars.
D)A product choice game with asymmetric profits
Unlock Deck
Unlock for access to all 66 flashcards in this deck.
Unlock Deck
k this deck
52
In a mixed strategy situation, like the "heads or tails" game, the players can maximize their income by randomly choosing head or tail each with a probability of:
A)0.25
B)0.5
C)0.75
D)1.0
A)0.25
B)0.5
C)0.75
D)1.0
Unlock Deck
Unlock for access to all 66 flashcards in this deck.
Unlock Deck
k this deck
53
How does the existence of the fringe alter the price and output in an oligopoly market?
Unlock Deck
Unlock for access to all 66 flashcards in this deck.
Unlock Deck
k this deck
54
Why did the attempts by some airlines to introduce uniform pricing for all air trips in 1980s and 1990s fail?
Unlock Deck
Unlock for access to all 66 flashcards in this deck.
Unlock Deck
k this deck
55
The figure given below represents the output choices of each of the two oligopolists, given the choices of its competitor.QA and QB are the quantities of output produced by Producer A and Producer B.The marginal cost of production is zero for both producers.
Figure 7-2
Refer to Figure 7-2.Suppose the government imposes a tax of $1.5 on each unit of A's output.Which of the following changes in the total output will be observed under Cournot equilibrium?
A)Total output will decrease although the market share of the producers will remain same.
B)Producer B's output will increase leading to a rise in total output.
C)Producer A's output will decline leading to a fall in total output.
D)The market share of the Producer A will fall, while that of B will increase.
Unlock Deck
Unlock for access to all 66 flashcards in this deck.
Unlock Deck
k this deck
56
The figure given below represents the output choices of each of the two oligopolists, given the choices of its competitor.QA and QB are the quantities of output produced by Producer A and Producer B.The marginal cost of production is zero for both producers.
Figure 7-2
Refer to Figure 7-2.Determine the total production in this market under Cournot equilibrium?
A)6 units
B)12 units
C)8 units
D)20 units
Figure 7-2
Refer to Figure 7-2.Determine the total production in this market under Cournot equilibrium?
A)6 units
B)12 units
C)8 units
D)20 units
Unlock Deck
Unlock for access to all 66 flashcards in this deck.
Unlock Deck
k this deck
57
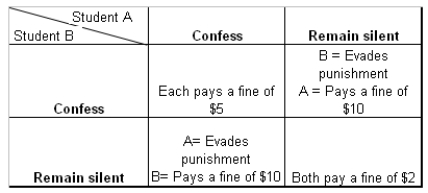
Table 7-3
Refer to Table 7-3.What will be the Nash equilibrium if there is no interaction between the two students?
A)Student A will confess while Student B will remain silent.
B)Student B will confess while Student A will remain silent.
C)Both the students will confess.
D)Both the students will remain silent.
Refer to Table 7-3.What will be the Nash equilibrium if there is no interaction between the two students?
A)Student A will confess while Student B will remain silent.
B)Student B will confess while Student A will remain silent.
C)Both the students will confess.
D)Both the students will remain silent.
Unlock Deck
Unlock for access to all 66 flashcards in this deck.
Unlock Deck
k this deck
58
In games without dominant strategies the Nash equilibrium can be found by using:
A)the cooperation vs.grim trigger strategy.
B)the chain-store paradox.
C)the principle of backward induction.
D)the method of iterated elimination of dominated strategies.
A)the cooperation vs.grim trigger strategy.
B)the chain-store paradox.
C)the principle of backward induction.
D)the method of iterated elimination of dominated strategies.
Unlock Deck
Unlock for access to all 66 flashcards in this deck.
Unlock Deck
k this deck
59
How does a dominant firm try to prevent new competitors from entering the oligopoly market?
Unlock Deck
Unlock for access to all 66 flashcards in this deck.
Unlock Deck
k this deck
60
How is the dominant firm's residual demand curve derived in an oligopoly market?
Unlock Deck
Unlock for access to all 66 flashcards in this deck.
Unlock Deck
k this deck
61
What is an ascending-value auction?
Unlock Deck
Unlock for access to all 66 flashcards in this deck.
Unlock Deck
k this deck
62
When can a grim trigger prevent oligopolists from breaking an agreement?
Unlock Deck
Unlock for access to all 66 flashcards in this deck.
Unlock Deck
k this deck
63
When is a game dominance solvable?
Unlock Deck
Unlock for access to all 66 flashcards in this deck.
Unlock Deck
k this deck
64
Decsribe the mechanism by which two oligopolists reach an equilibrium in the Cournot duopoly model.
Unlock Deck
Unlock for access to all 66 flashcards in this deck.
Unlock Deck
k this deck
65
Explain the concept of Nash equilibrium with an example.
Unlock Deck
Unlock for access to all 66 flashcards in this deck.
Unlock Deck
k this deck
66
What is the difference between a solution to a game in a pure strategy and a mixed strategy situation?
Unlock Deck
Unlock for access to all 66 flashcards in this deck.
Unlock Deck
k this deck
Unlock Deck
Unlock for access to all 66 flashcards in this deck.


