Deck 7: Beyond Alleles: Quantitative Genetics and the Evolution of Phenotypes
Full screen (f)
Question
Question
Question
Question
Question
Question
Question
Question
Question
Question
Question
The graph below plots survival versus birth weight for human babies. What type of selection is operating? 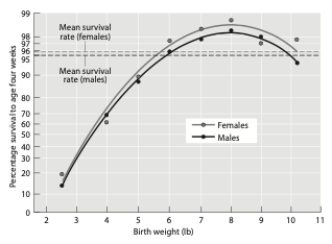
A) stabilizing
B) disruptive
C) directional
D) negative frequency-dependent
A) stabilizing
B) disruptive
C) directional
D) negative frequency-dependent
Question
Question
Question
Question
Question
Question
Question
Question
Question
Question
Question
Question
Each graph below shows the phenotype produced by three different genotypes in different environmental conditions (each line is a genotype). For each graph write "plasticity" or "no plasticity" depending on whether the graph depicts phenotypic plasticity. Also, write "G × E" or "no G × E" depending on whether the graph depicts a genotype by environment interaction. 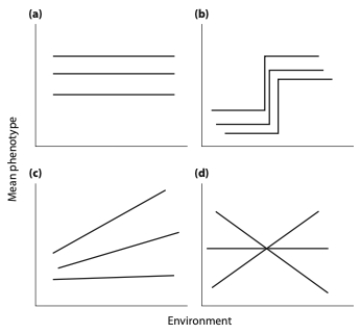
Question
Question
Question
Question
Given the graph below, and assuming that corolla flare is heritable, what type of selection should occur? 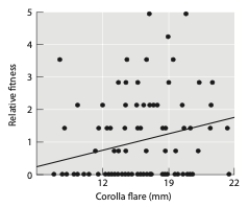
A) directional
B) stabilizing
C) disruptive
D) overdominance
E) frequency-dependent
A) directional
B) stabilizing
C) disruptive
D) overdominance
E) frequency-dependent
Question
Question
Question
Question
Question
Question
Question
Question
You are studying directional selection on neck length in two giraffe populations. Below you can see data on neck length (in inches) of the whole population and breeding parents for each of the two populations. 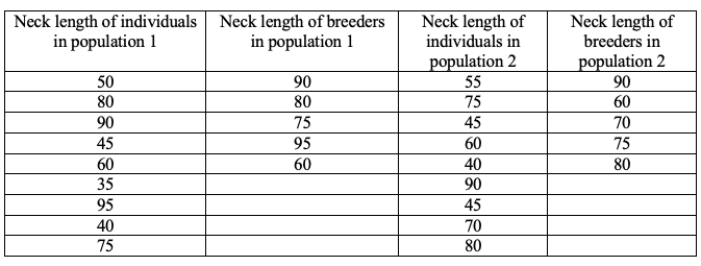 (a) Calculate the selection differential for each population. Show your work.
You also have data on the length of necks for parents and their offspring (offspring corresponding to each midparent listed in the adjacent cell).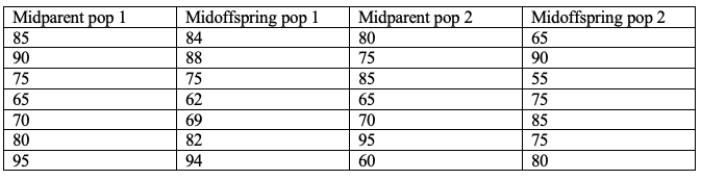 (b) Describe how you would use this data to calculate narrow sense heritability.
(c) Based on parts a and b, in which population would you expect to see the largest evolutionary change in neck length in the next generation? Explain your answer.
(a) Calculate the selection differential for each population. Show your work.You also have data on the length of necks for parents and their offspring (offspring corresponding to each midparent listed in the adjacent cell).
(b) Describe how you would use this data to calculate narrow sense heritability.(c) Based on parts a and b, in which population would you expect to see the largest evolutionary change in neck length in the next generation? Explain your answer.
Question
Question
Question
Question
Question
Question
You are studying the effect of directional selection on body height in three populations (a, b, and c) below. 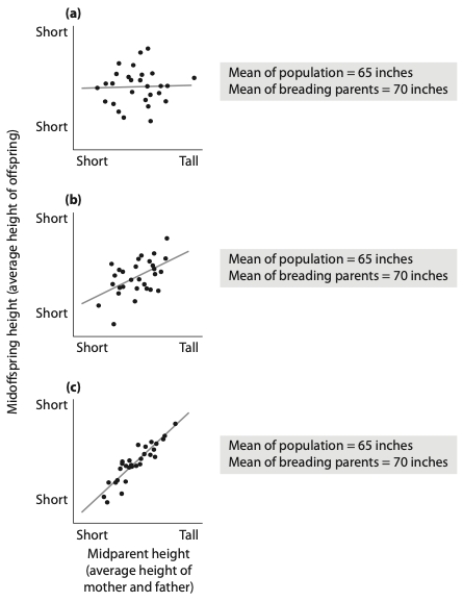 (a) What is the selection differential? Show your calculation.
(b) Which population has the highest narrow sense heritability for height? Explain your answer.
(c) If you examined the offspring in the next generation in each population, which population would have the highest mean height? Why?
(a) What is the selection differential? Show your calculation.(b) Which population has the highest narrow sense heritability for height? Explain your answer.
(c) If you examined the offspring in the next generation in each population, which population would have the highest mean height? Why?
Question
Each graph below depicts reaction norms for three different genotypes reared in different environments. In which case(s) is/are there a capacity for phenotypic plasticity to further evolve (you can assume that graphs for parents and their offspring would be the same)? Explain your answer. 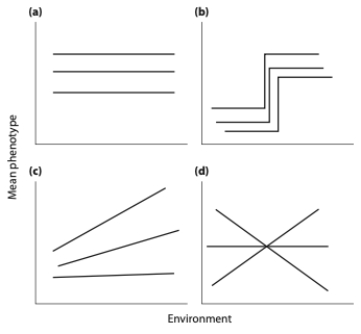

Unlock Deck
Sign up to unlock the cards in this deck!
Unlock Deck
Unlock Deck
1/42
Play
Full screen (f)
Deck 7: Beyond Alleles: Quantitative Genetics and the Evolution of Phenotypes
1
The greyhound is a dog breed known for its amazing speed. This breed was produced by taking the fastest animals and breeding them together, generation after generation. Though artificial, this is an example of __________.
A) stabilizing selection
B) disruptive selection
C) overdominance
D) directional selection
E) underdominance
A) stabilizing selection
B) disruptive selection
C) overdominance
D) directional selection
E) underdominance
D
2
Which of the following steps is a part of QTL association studies?
A) crossing individuals from genetically divergent populations
B) sampling a large number of individuals from within a population
C) raising individuals in a large range of environmental conditions
D) calculating the expected frequency of alleles in a population
A) crossing individuals from genetically divergent populations
B) sampling a large number of individuals from within a population
C) raising individuals in a large range of environmental conditions
D) calculating the expected frequency of alleles in a population
A
3
The total variance in a phenotypic trait in a population (VP ) is accurately expressed as
A) VP = VG + VE.
B) VP = VA + VD + VI.
C) VP = VA + VD + VI + VE.
D) a and b
E) a and c
A) VP = VG + VE.
B) VP = VA + VD + VI.
C) VP = VA + VD + VI + VE.
D) a and b
E) a and c
E
4
What does VG×E represent?
A) the genetic variance associated with epistatic effects
B) genotype variation caused by linkage disequilibrium
C) the variance in how genotypes interact with their environment
D) phenotypic variation resulting from genetically programmed responses
A) the genetic variance associated with epistatic effects
B) genotype variation caused by linkage disequilibrium
C) the variance in how genotypes interact with their environment
D) phenotypic variation resulting from genetically programmed responses
Unlock Deck
Unlock for access to all 42 flashcards in this deck.
Unlock Deck
k this deck
5
A quantitative trait locus is
A) a section of DNA that regulates the expression of a gene.
B) a genetic mutation responsible for a certain disease.
C) a change in the phenotype produced by a single genotype.
D) a stretch of DNA correlated with variation in a phenotypic trait.
A) a section of DNA that regulates the expression of a gene.
B) a genetic mutation responsible for a certain disease.
C) a change in the phenotype produced by a single genotype.
D) a stretch of DNA correlated with variation in a phenotypic trait.
Unlock Deck
Unlock for access to all 42 flashcards in this deck.
Unlock Deck
k this deck
6
Which event would result in an allele or alleles being in a state of perfect linkage disequilibrium?
A) A new mutation arises on a chromosome.
B) Two individuals from a different species mate to produce a hybrid offspring.
C) Crossing over of chromosomes occurs during meiosis.
D) a and b
E) a, b, and c
A) A new mutation arises on a chromosome.
B) Two individuals from a different species mate to produce a hybrid offspring.
C) Crossing over of chromosomes occurs during meiosis.
D) a and b
E) a, b, and c
Unlock Deck
Unlock for access to all 42 flashcards in this deck.
Unlock Deck
k this deck
7
Scientists studying a species of fish using quantitative trait locus analysis found that fishes with paternal alleles at a marker have larger body sizes than fishes with maternal alleles at the marker. This suggests that
A) the alleles controlling body size are in a state of linkage disequilibrium.
B) the genetic marker itself has a direct effect on body size.
C) the loci that affect body size may be nearby the marker.
D) fish body size is a highly heritable trait.
A) the alleles controlling body size are in a state of linkage disequilibrium.
B) the genetic marker itself has a direct effect on body size.
C) the loci that affect body size may be nearby the marker.
D) fish body size is a highly heritable trait.
Unlock Deck
Unlock for access to all 42 flashcards in this deck.
Unlock Deck
k this deck
8
The selection differential for a quantitative trait is ____________. Assuming heritability is the same in all cases, a larger selection differential ___________.
A) the amount that the mean of the trait changes in the next generation; means there was more change in the trait between generations
B) the difference between the mean for the trait in the original population and the mean of those individuals that reproduced; means there will be more change in the trait in the next generation
C) the difference between the mean for the trait in the original population and the mean of those individuals that reproduced; means there will be less change in the trait in the next generation
D) the amount that the mean of the trait changes in the next generation; means there was less change in the trait between generations
Unlock Deck
Unlock for access to all 42 flashcards in this deck.
Unlock Deck
k this deck
9
A trait with h2 = 0
A) must have no genetic basis.
B) means that most of the phenotypic variation in the population is explained by differences in the alleles that individuals have.
C) means that there is no phenotypic variation.
D) means that the phenotypic variation in the population is explained by differences in the environments experienced by individuals.
E) a and d
Unlock Deck
Unlock for access to all 42 flashcards in this deck.
Unlock Deck
k this deck
10
If A1 represents an allele at one locus and B1 represents an allele at another locus, what is ?
A) the expected frequency of A1B1 individuals if the two loci are segregating independently
B) the observed frequency of individuals with A1 and B1
C) all possible combinations of the A and B alleles
D) the frequency of A1 and B1 in the population
A) the expected frequency of A1B1 individuals if the two loci are segregating independently
B) the observed frequency of individuals with A1 and B1
C) all possible combinations of the A and B alleles
D) the frequency of A1 and B1 in the population
Unlock Deck
Unlock for access to all 42 flashcards in this deck.
Unlock Deck
k this deck
11
The graph below plots survival versus birth weight for human babies. What type of selection is operating?
A) stabilizing
B) disruptive
C) directional
D) negative frequency-dependent
A) stabilizing
B) disruptive
C) directional
D) negative frequency-dependent
Unlock Deck
Unlock for access to all 42 flashcards in this deck.
Unlock Deck
k this deck
12
Which of the following is true of QTL association studies?
A) They pinpoint the specific gene(s) responsible for phenotypic variation.
B) F1 offspring are examined to look for genetic markers linked to phenotypic variation.
C) They rely on recombination to create a wide range of phenotypic variation.
D) all of the above
E) none of the above
A) They pinpoint the specific gene(s) responsible for phenotypic variation.
B) F1 offspring are examined to look for genetic markers linked to phenotypic variation.
C) They rely on recombination to create a wide range of phenotypic variation.
D) all of the above
E) none of the above
Unlock Deck
Unlock for access to all 42 flashcards in this deck.
Unlock Deck
k this deck
13
If the heritability of a trait in a population is low,
A) few individuals have the trait.
B) most of the phenotypic variation for the trait in the population is due to environmental differences experienced by individuals.
C) most of the phenotypic variation for the trait in the population is due to genetic differences among individuals.
D) there are no genes that code for the trait.
E) b and d
Unlock Deck
Unlock for access to all 42 flashcards in this deck.
Unlock Deck
k this deck
14
When sources of genetic variation act independently, their effects are
A) additive.
B) dominant.
C) non-additive.
D) recessive.
A) additive.
B) dominant.
C) non-additive.
D) recessive.
Unlock Deck
Unlock for access to all 42 flashcards in this deck.
Unlock Deck
k this deck
15
The pattern of phenotypic expression of a single genotype across a range of environments is
A) phenotypic plasticity.
B) a reaction norm.
C) a quantitative trait locus.
D) polyphenism.
A) phenotypic plasticity.
B) a reaction norm.
C) a quantitative trait locus.
D) polyphenism.
Unlock Deck
Unlock for access to all 42 flashcards in this deck.
Unlock Deck
k this deck
16
Which process would oppose natural selection of a favorable combination of alleles?
A) disruptive selection
B) linkage disequilibrium
C) phenotypic plasticity
D) recombination
A) disruptive selection
B) linkage disequilibrium
C) phenotypic plasticity
D) recombination
Unlock Deck
Unlock for access to all 42 flashcards in this deck.
Unlock Deck
k this deck
17
If VG×E > 0,
A) there is genetic variation for phenotypic plasticity.
B) phenotypic plasticity is at least partially heritable.
C) genotypes would need to be grown in different environments to achieve a true estimate of narrow sense heritability.
D) all of the above
E) none of the above
A) there is genetic variation for phenotypic plasticity.
B) phenotypic plasticity is at least partially heritable.
C) genotypes would need to be grown in different environments to achieve a true estimate of narrow sense heritability.
D) all of the above
E) none of the above
Unlock Deck
Unlock for access to all 42 flashcards in this deck.
Unlock Deck
k this deck
18
How does genome wide association (GWA) mapping differ from quantitative trait locus (QTL) mapping?
A) GWA mapping samples individuals from within a single population.
B) GWA mapping crosses individuals from genetically divergent populations.
C) QTL mapping searches for markers associated with expression of a trait.
D) GWA mapping can identify the specific gene in that causes a trait.
A) GWA mapping samples individuals from within a single population.
B) GWA mapping crosses individuals from genetically divergent populations.
C) QTL mapping searches for markers associated with expression of a trait.
D) GWA mapping can identify the specific gene in that causes a trait.
Unlock Deck
Unlock for access to all 42 flashcards in this deck.
Unlock Deck
k this deck
19
Which of the following statements about linkage disequilibrium is false?
A) Physical linkage is required for two loci to be in a state of linkage disequilibrium.
B) Linkage disequilibrium is a statistical state detected when two loci segregate independently.
C) Linkage disequilibrium is a transient state that can disappear with genetic recombination.
D) A new mutation first exists in a state of perfect, chromosome-wide linkage disequilibrium.
Unlock Deck
Unlock for access to all 42 flashcards in this deck.
Unlock Deck
k this deck
20
Below are some different scenarios for the heritability of a trait and the selection differential in a population. Which scenario will produce the largest response to selection?
A) h2 = 0.9; S = 0.6
B) h2 = 0.5; S = 0.9
C) h2 = 0.2; S = 0.1
D) h2 = 0.5; S = 0.5
A) h2 = 0.9; S = 0.6
B) h2 = 0.5; S = 0.9
C) h2 = 0.2; S = 0.1
D) h2 = 0.5; S = 0.5
Unlock Deck
Unlock for access to all 42 flashcards in this deck.
Unlock Deck
k this deck
21
Which of the following scenarios best describes how you would study reaction norms?
A) Rear genetically similar organisms under different environmental conditions.
B) Randomly breed individuals together and measure the phenotype of their offspring.
C) Allow individuals from different populations to mate and observe the offspring phenotypes.
D) Raise individuals under different environmental conditions than they were born in.
Unlock Deck
Unlock for access to all 42 flashcards in this deck.
Unlock Deck
k this deck
22
If chromosomes were passed down unchanged from generation to generation, then this state would best be described as
A) linkage equilibrium.
B) linkage disequilibrium.
C) broad sense heritability.
D) physical linkage.
A) linkage equilibrium.
B) linkage disequilibrium.
C) broad sense heritability.
D) physical linkage.
Unlock Deck
Unlock for access to all 42 flashcards in this deck.
Unlock Deck
k this deck
23
Each graph below shows the phenotype produced by three different genotypes in different environmental conditions (each line is a genotype). For each graph write "plasticity" or "no plasticity" depending on whether the graph depicts phenotypic plasticity. Also, write "G × E" or "no G × E" depending on whether the graph depicts a genotype by environment interaction.
Unlock Deck
Unlock for access to all 42 flashcards in this deck.
Unlock Deck
k this deck
24
Which response to different environmental conditions would you expect from a species that has a high VG×E for a trait?
A) All genotypes respond similarly to environmental conditions.
B) The magnitude of each genotype's response is always similar.
C) Different genotypes have varying responses to different conditions.
D) The same genotype will have the same response to different conditions.
A) All genotypes respond similarly to environmental conditions.
B) The magnitude of each genotype's response is always similar.
C) Different genotypes have varying responses to different conditions.
D) The same genotype will have the same response to different conditions.
Unlock Deck
Unlock for access to all 42 flashcards in this deck.
Unlock Deck
k this deck
25
As a result of warming climate, most butterfly species in California mature 24 days sooner than they did 30 years ago.
(a) Please describe a scenario that would account for this change through phenotypic plasticity.
(b) Please describe a scenario that would account for this change through evolution by natural selection.
(a) Please describe a scenario that would account for this change through phenotypic plasticity.
(b) Please describe a scenario that would account for this change through evolution by natural selection.
Unlock Deck
Unlock for access to all 42 flashcards in this deck.
Unlock Deck
k this deck
26
If A1 represents an allele at one locus and B1 represents an allele at another locus, which equation represents linkage disequilibrium?
A)
B)
C)
D)
A)
B)
C)
D)
Unlock Deck
Unlock for access to all 42 flashcards in this deck.
Unlock Deck
k this deck
27
Given the graph below, and assuming that corolla flare is heritable, what type of selection should occur?
A) directional
B) stabilizing
C) disruptive
D) overdominance
E) frequency-dependent
A) directional
B) stabilizing
C) disruptive
D) overdominance
E) frequency-dependent
Unlock Deck
Unlock for access to all 42 flashcards in this deck.
Unlock Deck
k this deck
28
What effect does each type of selection, directional, stabilizing, and disruptive, have on the mean and variance of the trait in the next generation?
Unlock Deck
Unlock for access to all 42 flashcards in this deck.
Unlock Deck
k this deck
29
Stalk-eyed flies are so named because their eyes are situated at the end of long stalks extending away from their head. Stalk length is a quantitative trait that is variable in populations. Describe the steps you would need to take in order to find quantitative trait loci linked to differences in eye stalk length.
Unlock Deck
Unlock for access to all 42 flashcards in this deck.
Unlock Deck
k this deck
30
Agree or disagree with the following statement and explain your answer: If a trait such as height has high narrow sense heritability (say 0.7), this means that genetics is more important than environment in determining the height of any given individual.
Unlock Deck
Unlock for access to all 42 flashcards in this deck.
Unlock Deck
k this deck
31
Please describe a scenario where selection occurs on a trait, but there is no evolutionary change.
Unlock Deck
Unlock for access to all 42 flashcards in this deck.
Unlock Deck
k this deck
32
Broad sense heritability differs from narrow sense heritability in that
A) for broad sense heritability, VG includes only additive effects of alleles.
B) for broad sense heritability, VG includes additive, dominance, and epistatic effects.
C) broad sense heritability includes only components of variance that cause offspring to resemble their parents.
D) all of the above
E) none of the above
Unlock Deck
Unlock for access to all 42 flashcards in this deck.
Unlock Deck
k this deck
33
Consider selection on a quantitative trait such as height. Please graph a fitness function (fitness on the y axis; height on the x axis) for each of the following types of selection: directional, stabilizing, and disruptive.
Unlock Deck
Unlock for access to all 42 flashcards in this deck.
Unlock Deck
k this deck
34
The residues ("tailings") of mines often contain such high concentrations of toxic metals (e.g., copper, lead) that most plants are unable to grow on them. However, some hardy species (e.g., certain grasses) are able to spread from the surrounding uncontaminated soil into such areas. These plants evolve resistance to the toxic metals, while their ability to grow on uncontaminated soil decreases. Because grasses are wind pollinated, breeding between the resistant and nonresistant populations continues, but offspring of crosses between the two populations are intermediate and have low fitness. This is an example of
A) stabilizing selection.
B) directional selection.
C) frequency-dependent selection.
D) disruptive selection.
E) underdominance.
A) stabilizing selection.
B) directional selection.
C) frequency-dependent selection.
D) disruptive selection.
E) underdominance.
Unlock Deck
Unlock for access to all 42 flashcards in this deck.
Unlock Deck
k this deck
35
You are studying directional selection on neck length in two giraffe populations. Below you can see data on neck length (in inches) of the whole population and breeding parents for each of the two populations. (a) Calculate the selection differential for each population. Show your work.
You also have data on the length of necks for parents and their offspring (offspring corresponding to each midparent listed in the adjacent cell). (b) Describe how you would use this data to calculate narrow sense heritability.
(c) Based on parts a and b, in which population would you expect to see the largest evolutionary change in neck length in the next generation? Explain your answer.
(a) Calculate the selection differential for each population. Show your work.You also have data on the length of necks for parents and their offspring (offspring corresponding to each midparent listed in the adjacent cell).
(b) Describe how you would use this data to calculate narrow sense heritability.(c) Based on parts a and b, in which population would you expect to see the largest evolutionary change in neck length in the next generation? Explain your answer.
Unlock Deck
Unlock for access to all 42 flashcards in this deck.
Unlock Deck
k this deck
36
Given the warming climate, you are interested in how seed production of a certain plant species is affected by temperature. In particular, you are interested in whether seed production shows a plastic response to temperature and, if so, whether there is the possibility for adaptive evolution of phenotypic plasticity in response to climate change. Please describe the steps that would be needed to demonstrate that there is the capacity for adaptive evolution in the population you are studying.
Unlock Deck
Unlock for access to all 42 flashcards in this deck.
Unlock Deck
k this deck
37
The genetic component of variance for narrow sense heritability includes
A) additive effects.
B) dominance effects.
C) G × E interactions.
D) a and b
E) a, b, and c
A) additive effects.
B) dominance effects.
C) G × E interactions.
D) a and b
E) a, b, and c
Unlock Deck
Unlock for access to all 42 flashcards in this deck.
Unlock Deck
k this deck
38
Which of the following equations illustrates phenotypic variation that comes from both the genotype and the environment?
A) VP = VG
B) VP = VE
C) VP = VG + VE
D) VP = VG + VE + VG×E
A) VP = VG
B) VP = VE
C) VP = VG + VE
D) VP = VG + VE + VG×E
Unlock Deck
Unlock for access to all 42 flashcards in this deck.
Unlock Deck
k this deck
39
How is linkage disequilibrium used as a tool for determining the genetic basis of complex phenotypic traits?
Unlock Deck
Unlock for access to all 42 flashcards in this deck.
Unlock Deck
k this deck
40
The heritability of a trait describes
A) the proportion of phenotypic variation in the population that is due to genetic differences between individuals.
B) whether selection on a trait will result in evolutionary change.
C) the proportion of an individual's phenotype that is due to its genotype.
D) a and b
E) a, b, and c
A) the proportion of phenotypic variation in the population that is due to genetic differences between individuals.
B) whether selection on a trait will result in evolutionary change.
C) the proportion of an individual's phenotype that is due to its genotype.
D) a and b
E) a, b, and c
Unlock Deck
Unlock for access to all 42 flashcards in this deck.
Unlock Deck
k this deck
41
You are studying the effect of directional selection on body height in three populations (a, b, and c) below. (a) What is the selection differential? Show your calculation.
(b) Which population has the highest narrow sense heritability for height? Explain your answer.
(c) If you examined the offspring in the next generation in each population, which population would have the highest mean height? Why?
(a) What is the selection differential? Show your calculation.(b) Which population has the highest narrow sense heritability for height? Explain your answer.
(c) If you examined the offspring in the next generation in each population, which population would have the highest mean height? Why?
Unlock Deck
Unlock for access to all 42 flashcards in this deck.
Unlock Deck
k this deck
42
Each graph below depicts reaction norms for three different genotypes reared in different environments. In which case(s) is/are there a capacity for phenotypic plasticity to further evolve (you can assume that graphs for parents and their offspring would be the same)? Explain your answer.
Unlock Deck
Unlock for access to all 42 flashcards in this deck.
Unlock Deck
k this deck
Unlock Deck
Unlock for access to all 42 flashcards in this deck.


