Deck 16: Demand Forecasting Methods
Full screen (f)
Question
Question
Question
Question
Question
Question
Question
Question
Question
Question
Question
Question
Question
Question
Question
Question
Question
Question
Question
Question
Question
Question
Question
Question
Question
Question
Question
Question
Question
Question
32)Using the weighted average method,with W₁ = 0.5,W2 = 0.3 and W₃ = 0.2,compute the forecast for Week 5 with the data that follows. 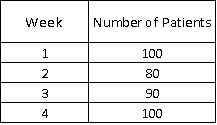
A)93
B)96
C)98
D)100
A)93
B)96
C)98
D)100
Question
Question
30)Using the moving average technique,compute the forecast for Week 5 with n = 3 with the data that follows. 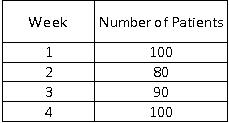
A)100
B)90
C)80
D)75
A)100
B)90
C)80
D)75
Question
Question
Question
Question
Question
Question
Question
Question
33)Using the naïve approach,compute the forecast for Week 5 with the data that follows. 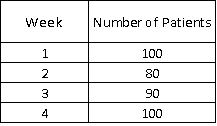
A)90
B)80
C)110
D)100
A)90
B)80
C)110
D)100
Question
Question
Question
Question
Question
Question
Question
50)Using the data that follows,compute the seasonal indices for January,February,and March using the simple average method. 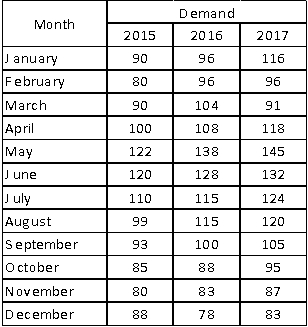
A)January: 0.10,February: 0.88,March: 0.92
B)January: 0.97,February: 1.01,March: 0.72
C)January: 0.87,February: 1.08,March: 0.92
D)January: 0.97,February: 0.88,March: 0.92
A)January: 0.10,February: 0.88,March: 0.92
B)January: 0.97,February: 1.01,March: 0.72
C)January: 0.87,February: 1.08,March: 0.92
D)January: 0.97,February: 0.88,March: 0.92
Question
Question
Question
Question
Question
Question
Question
Question
Question
Question
Question
Question
Question
Question
Question
Question
Question
Question
Question
Question
Question
Question
Question
Question
Question
Question
Question
Question
Question
Question
Question
Question
Question

Unlock Deck
Sign up to unlock the cards in this deck!
Unlock Deck
Unlock Deck
1/100
Play
Full screen (f)
Deck 16: Demand Forecasting Methods
1
14)______ is used to forecast demand for a new product or service that is similar to existing products.
A)Market research
B)The Delphi method
C)A historical life-cycle analogy
D)A sales force opinion
A)Market research
B)The Delphi method
C)A historical life-cycle analogy
D)A sales force opinion
C
2
1)Which of the following is an example of a forecasted activity in tactical decision making?
A)new product development
B)sales and production planning
C)production scheduling
D)worker assignments
A)new product development
B)sales and production planning
C)production scheduling
D)worker assignments
B
3
10)Which of the following is an example of a qualitative method?
A)Delphi method
B)moving average
C)weighted moving average
D)linear trend analysis
A)Delphi method
B)moving average
C)weighted moving average
D)linear trend analysis
A
4
20)Which of the following is NOT a major component of a time series?
A)seasonal variations
B)trend line
C)irregular variations
D)best-fit line
A)seasonal variations
B)trend line
C)irregular variations
D)best-fit line
Unlock Deck
Unlock for access to all 100 flashcards in this deck.
Unlock Deck
k this deck
5
9)The two broad categories of forecasting methods are ______
A)dependent and independent
B)time series and causal
C)qualitative and quantitative
D)time series and regression analysis
A)dependent and independent
B)time series and causal
C)qualitative and quantitative
D)time series and regression analysis
Unlock Deck
Unlock for access to all 100 flashcards in this deck.
Unlock Deck
k this deck
6
6)Which of the following statements is FALSE about good forecasts?
A)Short-term forecasts tend to be more accurate than long-term forecasts.
B)Aggregate forecasts for groups of products or services tend to be more accurate than forecasts for individual products.
C)The forecasts for dependent-demand items are more accurate than forecasts for independent-demand items.
D)Long-term forecasts tend to be more accurate than short-term forecasts.
Unlock Deck
Unlock for access to all 100 flashcards in this deck.
Unlock Deck
k this deck
7
13)______ is a qualitative method that attempts to eliminate or minimize the problem of bias in the opinion of a single expert by using a panel of experts to generate forecasts.
A)Expert opinion
B)Sales force opinion
C)Market research
D)The Delphi method
A)Expert opinion
B)Sales force opinion
C)Market research
D)The Delphi method
Unlock Deck
Unlock for access to all 100 flashcards in this deck.
Unlock Deck
k this deck
8
19)Past behavior of demand is indicative of its future behavior,therefore past demand data can be used to construct demand forecasts.This statement is the underlying principle of the ______ method.
A)causal
B)market research
C)time series analysis
D)Delphi
A)causal
B)market research
C)time series analysis
D)Delphi
Unlock Deck
Unlock for access to all 100 flashcards in this deck.
Unlock Deck
k this deck
9
18)The two subcategories of quantitative methods are ______.
A)time series analysis and causal methods
B)simple linear regression and multiple linear regression analysis
C)exponential smoothing and seasonality techniques
D)simple moving average and weighted moving average
A)time series analysis and causal methods
B)simple linear regression and multiple linear regression analysis
C)exponential smoothing and seasonality techniques
D)simple moving average and weighted moving average
Unlock Deck
Unlock for access to all 100 flashcards in this deck.
Unlock Deck
k this deck
10
2)Product scheduling and worker assignments are examples of forecasted activities in ______ decision-making.
A)operational
B)tactical
C)strategic
D)functional
A)operational
B)tactical
C)strategic
D)functional
Unlock Deck
Unlock for access to all 100 flashcards in this deck.
Unlock Deck
k this deck
11
15)One drawback of surveys is that they are ______.
A)time-consuming
B)inexpensive
C)necessary for a high response rate
D)efficient
A)time-consuming
B)inexpensive
C)necessary for a high response rate
D)efficient
Unlock Deck
Unlock for access to all 100 flashcards in this deck.
Unlock Deck
k this deck
12
3)In order to be useful,demand forecasts should be ______.
A)consistent
B)complex
C)time-consuming
D)inaccurate
A)consistent
B)complex
C)time-consuming
D)inaccurate
Unlock Deck
Unlock for access to all 100 flashcards in this deck.
Unlock Deck
k this deck
13
12)______ methods are used when no measurable,reliable,historic,or statistical data are available and are primarily based on intuition,judgment,or informed opinions of experts in the industry.
A)Market research
B)Qualitative
C)Quantitative
D)Causal
A)Market research
B)Qualitative
C)Quantitative
D)Causal
Unlock Deck
Unlock for access to all 100 flashcards in this deck.
Unlock Deck
k this deck
14
17)Which of the following statements is true about quantitative methods?
A)They are appropriate for demand forecasting if there are causal relationships between explanatory variables.
B)They cannot be used for short or medium-to-intermediate timeframes.
C)They are used if measurable,historical data are not available.
D)They are inappropriate for demand forecasting if there are causal relationships between explanatory variables.
Unlock Deck
Unlock for access to all 100 flashcards in this deck.
Unlock Deck
k this deck
15
16)______ methods can be used if measurable,historical data are available,and there is evidence that past demand is indicative of the future demand.
A)Simulation analysis
B)Qualitative
C)Quantitative
D)Market research
A)Simulation analysis
B)Qualitative
C)Quantitative
D)Market research
Unlock Deck
Unlock for access to all 100 flashcards in this deck.
Unlock Deck
k this deck
16
4)Which of the following statements is FALSE about good forecasts?
A)They should be easy to interpret so that users have confidence in the forecasts.
B)The costs of preparing the forecasts should outweigh its benefits.
C)Any deviations from actual demand should be small.
D)They should be available within a reasonable timeframe.
A)They should be easy to interpret so that users have confidence in the forecasts.
B)The costs of preparing the forecasts should outweigh its benefits.
C)Any deviations from actual demand should be small.
D)They should be available within a reasonable timeframe.
Unlock Deck
Unlock for access to all 100 flashcards in this deck.
Unlock Deck
k this deck
17
5)Which of the following is NOT a feature of a good forecast?
A)timely
B)complex
C)efficient
D)consistent
A)timely
B)complex
C)efficient
D)consistent
Unlock Deck
Unlock for access to all 100 flashcards in this deck.
Unlock Deck
k this deck
18
7)______ is a part or component of an end product whose demand depends on the demand for the end product.
A)Dependent demand item
B)Independent demand item
C)Variable demand item
D)Seasonal demand item
A)Dependent demand item
B)Independent demand item
C)Variable demand item
D)Seasonal demand item
Unlock Deck
Unlock for access to all 100 flashcards in this deck.
Unlock Deck
k this deck
19
11)Exponential smoothing and weighted moving average are examples of ______.
A)causal methods
B)qualitative methods
C)time series analysis
D)simulation methods
A)causal methods
B)qualitative methods
C)time series analysis
D)simulation methods
Unlock Deck
Unlock for access to all 100 flashcards in this deck.
Unlock Deck
k this deck
20
8)An end product is a(n)______ whose demand is unrelated to the demand of any other product or item.
A)dependent demand item
B)independent demand item
C)variable demand item
D)seasonal demand item
A)dependent demand item
B)independent demand item
C)variable demand item
D)seasonal demand item
Unlock Deck
Unlock for access to all 100 flashcards in this deck.
Unlock Deck
k this deck
21
28)______ is a forecasting method in which it is assumed that the demand in the next period will be the same as it is in the current period.
A)Moving average
B)Naïve approach
C)Simple average
D)Sales force opinion
A)Moving average
B)Naïve approach
C)Simple average
D)Sales force opinion
Unlock Deck
Unlock for access to all 100 flashcards in this deck.
Unlock Deck
k this deck
22
40)Simple exponential smoothing or the first-order smoothing model can be used when ______.
A)demand exhibits different types of trend patterns
B)demand is constant or level
C)demand exhibits both trend and seasonal patterns
D)demand is fluctuating
A)demand exhibits different types of trend patterns
B)demand is constant or level
C)demand exhibits both trend and seasonal patterns
D)demand is fluctuating
Unlock Deck
Unlock for access to all 100 flashcards in this deck.
Unlock Deck
k this deck
23
38)Which of the following is a component of trend-adjusted forecast (TAF)?
A)leading indicators
B)seasonal indices
C)trend factors
D)tracking signals
A)leading indicators
B)seasonal indices
C)trend factors
D)tracking signals
Unlock Deck
Unlock for access to all 100 flashcards in this deck.
Unlock Deck
k this deck
24
22)A ______ trend often occurs when new products are introduced.
A)linear
B)nonlinear
C)no trend (level demand)
D)damped
A)linear
B)nonlinear
C)no trend (level demand)
D)damped
Unlock Deck
Unlock for access to all 100 flashcards in this deck.
Unlock Deck
k this deck
25
31)______ is a short-term time series forecasting method in which forecasters assign more weight to most recent values in the time series if they feel that these values reflect how the actual demand will behave in the near future.
A)Moving average
B)Linear trend multiplicative method
C)Weighted moving average
D)Linear regression technique
A)Moving average
B)Linear trend multiplicative method
C)Weighted moving average
D)Linear regression technique
Unlock Deck
Unlock for access to all 100 flashcards in this deck.
Unlock Deck
k this deck
26
24)Increased retail sales in December and peak demand for snow shovels during winter are examples of ______
A)cyclical variations
B)seasonal variations
C)irregular variations
D)random variations
A)cyclical variations
B)seasonal variations
C)irregular variations
D)random variations
Unlock Deck
Unlock for access to all 100 flashcards in this deck.
Unlock Deck
k this deck
27
34)New forecast = [(α *latest observation)+((1 - α)* old forecast)] is the formula for ______.
A)moving average
B)weighted moving average
C)exponential smoothing
D)factor rating method
A)moving average
B)weighted moving average
C)exponential smoothing
D)factor rating method
Unlock Deck
Unlock for access to all 100 flashcards in this deck.
Unlock Deck
k this deck
28
37)In order to begin exponential smoothing,a forecaster needs ______.
A)seasonal indices
B)tracking signals
C)the value of α
D)leading indicators
A)seasonal indices
B)tracking signals
C)the value of α
D)leading indicators
Unlock Deck
Unlock for access to all 100 flashcards in this deck.
Unlock Deck
k this deck
29
26)______ variations are treated as outliers and are eliminated from consideration for forecasting purposes.
A)Cyclical
B)Seasonal
C)Irregular
D)Regular
A)Cyclical
B)Seasonal
C)Irregular
D)Regular
Unlock Deck
Unlock for access to all 100 flashcards in this deck.
Unlock Deck
k this deck
30
32)Using the weighted average method,with W₁ = 0.5,W2 = 0.3 and W₃ = 0.2,compute the forecast for Week 5 with the data that follows.
A)93
B)96
C)98
D)100
A)93
B)96
C)98
D)100
Unlock Deck
Unlock for access to all 100 flashcards in this deck.
Unlock Deck
k this deck
31
21)Which of the following is a type of nonlinear trend pattern?
A)damped trend
B)trend line
C)no trend (level demand)
D)exponential growth
A)damped trend
B)trend line
C)no trend (level demand)
D)exponential growth
Unlock Deck
Unlock for access to all 100 flashcards in this deck.
Unlock Deck
k this deck
32
30)Using the moving average technique,compute the forecast for Week 5 with n = 3 with the data that follows.
A)100
B)90
C)80
D)75
A)100
B)90
C)80
D)75
Unlock Deck
Unlock for access to all 100 flashcards in this deck.
Unlock Deck
k this deck
33
35)When the smoothing constant (α)is set to 1,then exponential smoothing is equivalent to ______.
A)naïve approach
B)weighted moving average
C)moving average
D)factor rating method
A)naïve approach
B)weighted moving average
C)moving average
D)factor rating method
Unlock Deck
Unlock for access to all 100 flashcards in this deck.
Unlock Deck
k this deck
34
36)The smoothing constant can take a value between ______.
A)-1 to +1
B)0 to 1
C)-1 to 0
D)-∞ to +∞
A)-1 to +1
B)0 to 1
C)-1 to 0
D)-∞ to +∞
Unlock Deck
Unlock for access to all 100 flashcards in this deck.
Unlock Deck
k this deck
35
27)Which of the following is NOT an example of short-term time series forecasting methods?
A)naïve approach
B)moving averages
C)exponential smoothing
D)expert opinion
A)naïve approach
B)moving averages
C)exponential smoothing
D)expert opinion
Unlock Deck
Unlock for access to all 100 flashcards in this deck.
Unlock Deck
k this deck
36
39)Which of the following is FALSE about exponential smoothing models?
A)They create accurate forecasts.
B)They lend themselves to large-scale forecasting.
C)They are not very adaptive.
D)They can be easily applied and automated.
A)They create accurate forecasts.
B)They lend themselves to large-scale forecasting.
C)They are not very adaptive.
D)They can be easily applied and automated.
Unlock Deck
Unlock for access to all 100 flashcards in this deck.
Unlock Deck
k this deck
37
23)A linear trend can be ______.
A)positive
B)cyclical
C)irregular
D)random
A)positive
B)cyclical
C)irregular
D)random
Unlock Deck
Unlock for access to all 100 flashcards in this deck.
Unlock Deck
k this deck
38
29)______ is a short-term time series forecasting method in which the average of the most recent demand periods is used to predict demand in the future period.
A)Moving average
B)Naïve approach
C)Linear regression
D)Exponential smoothing
A)Moving average
B)Naïve approach
C)Linear regression
D)Exponential smoothing
Unlock Deck
Unlock for access to all 100 flashcards in this deck.
Unlock Deck
k this deck
39
25)______ are wave-like oscillations in demand about the trend line caused by changes in economic or business cycles or due to changes in political conditions.
A)Cyclical variations
B)Seasonal variations
C)Irregular variations
D)Random variations
A)Cyclical variations
B)Seasonal variations
C)Irregular variations
D)Random variations
Unlock Deck
Unlock for access to all 100 flashcards in this deck.
Unlock Deck
k this deck
40
33)Using the naïve approach,compute the forecast for Week 5 with the data that follows.
A)90
B)80
C)110
D)100
A)90
B)80
C)110
D)100
Unlock Deck
Unlock for access to all 100 flashcards in this deck.
Unlock Deck
k this deck
41
44)The line of best fit obtained by the least-squares method is called ______.
A)regression line
B)linear line
C)nonlinear line
D)moving average line
A)regression line
B)linear line
C)nonlinear line
D)moving average line
Unlock Deck
Unlock for access to all 100 flashcards in this deck.
Unlock Deck
k this deck
42
41)Which of the following models can be used when demand exhibits different types of changing trend patterns?
A)simple exponential smoothing
B)second-order or double smoothing
C)third-order or triple smoothing
D)linear trend multiplicative method
A)simple exponential smoothing
B)second-order or double smoothing
C)third-order or triple smoothing
D)linear trend multiplicative method
Unlock Deck
Unlock for access to all 100 flashcards in this deck.
Unlock Deck
k this deck
43
56)In linear regression analysis,the term predicted variable is another name for ______.
A)independent variable
B)random variable
C)dependent variable
D)discrete variable
A)independent variable
B)random variable
C)dependent variable
D)discrete variable
Unlock Deck
Unlock for access to all 100 flashcards in this deck.
Unlock Deck
k this deck
44
54)Which of the following is a form of quantitative analysis that uses causal techniques in order to identify related variables in order to make forecasts?
A)associative methods
B)time series analysis
C)the Delphi method
D)moving average
A)associative methods
B)time series analysis
C)the Delphi method
D)moving average
Unlock Deck
Unlock for access to all 100 flashcards in this deck.
Unlock Deck
k this deck
45
57)Which of the following is NOT used to evaluate the validity of the regression equation for forecasting?
A)standard error of the estimate
B)coefficient of determination
C)correlation coefficient
D)mean absolute deviation (MAD)
A)standard error of the estimate
B)coefficient of determination
C)correlation coefficient
D)mean absolute deviation (MAD)
Unlock Deck
Unlock for access to all 100 flashcards in this deck.
Unlock Deck
k this deck
46
46)Which of the following is a model of combining the trend and seasonal components?
A)subtractive
B)multiplicative
C)trend-adjusted exponential smoothing
D)linear trend analysis
A)subtractive
B)multiplicative
C)trend-adjusted exponential smoothing
D)linear trend analysis
Unlock Deck
Unlock for access to all 100 flashcards in this deck.
Unlock Deck
k this deck
47
50)Using the data that follows,compute the seasonal indices for January,February,and March using the simple average method.
A)January: 0.10,February: 0.88,March: 0.92
B)January: 0.97,February: 1.01,March: 0.72
C)January: 0.87,February: 1.08,March: 0.92
D)January: 0.97,February: 0.88,March: 0.92
A)January: 0.10,February: 0.88,March: 0.92
B)January: 0.97,February: 1.01,March: 0.72
C)January: 0.87,February: 1.08,March: 0.92
D)January: 0.97,February: 0.88,March: 0.92
Unlock Deck
Unlock for access to all 100 flashcards in this deck.
Unlock Deck
k this deck
48
59)The ______ is the proportion of variation explained by regression.
A)standard error of the estimate
B)total sum of squares (SST)
C)correlation coefficient
D)coefficient of determination
A)standard error of the estimate
B)total sum of squares (SST)
C)correlation coefficient
D)coefficient of determination
Unlock Deck
Unlock for access to all 100 flashcards in this deck.
Unlock Deck
k this deck
49
51)In ______ method,the seasonal indices are expressed as percentage and the combined forecast is expressed as percentage adjustments of the underlying linear trend.
A)linear trend analysis
B)trend-adjusted exponential smoothing
C)linear trend multiplicative
D)linear trend additive
A)linear trend analysis
B)trend-adjusted exponential smoothing
C)linear trend multiplicative
D)linear trend additive
Unlock Deck
Unlock for access to all 100 flashcards in this deck.
Unlock Deck
k this deck
50
58)Which of the following is NOT a measure of variation that must be calculated prior to determining the value of coefficient of determination (R²)?
A)total sum of squares (SST)
B)error sum of squares (SSE)
C)regression sum of squares (SSR)
D)cumulative sum of error (CSE)
A)total sum of squares (SST)
B)error sum of squares (SSE)
C)regression sum of squares (SSR)
D)cumulative sum of error (CSE)
Unlock Deck
Unlock for access to all 100 flashcards in this deck.
Unlock Deck
k this deck
51
55)The independent variable in linear regression analysis is also referred to as the ______.
A)predicted variable
B)predictor variable
C)random variable
D)discrete variable
A)predicted variable
B)predictor variable
C)random variable
D)discrete variable
Unlock Deck
Unlock for access to all 100 flashcards in this deck.
Unlock Deck
k this deck
52
60)In regression analysis,the ______ is the measure of the variation of the actual Y (independent variable)values around the mean Y (Y̅).
A)total sum of squares (SST)
B)error sum of squares (SSE)
C)regression sum of squares (SSR)
D)standard error of the estimate
A)total sum of squares (SST)
B)error sum of squares (SSE)
C)regression sum of squares (SSR)
D)standard error of the estimate
Unlock Deck
Unlock for access to all 100 flashcards in this deck.
Unlock Deck
k this deck
53
42)______ is a predictive technique that models the relationship between a dependent variable and one or more independent variables.
A)Linear regression analysis
B)Linear trend multiplicative method
C)Linear trend additive method
D)Second-order or double smoothing
A)Linear regression analysis
B)Linear trend multiplicative method
C)Linear trend additive method
D)Second-order or double smoothing
Unlock Deck
Unlock for access to all 100 flashcards in this deck.
Unlock Deck
k this deck
54
52)One requirement for using the linear trend multiplicative method is ______.
A)tracking signals should be used
B)time series demand data should exhibit a linear trend with seasonal variations
C)seasonal indices need not be available
D)time series demand should exhibit a nonlinear trend with seasonal variations
A)tracking signals should be used
B)time series demand data should exhibit a linear trend with seasonal variations
C)seasonal indices need not be available
D)time series demand should exhibit a nonlinear trend with seasonal variations
Unlock Deck
Unlock for access to all 100 flashcards in this deck.
Unlock Deck
k this deck
55
49)Which of the following methods is used for calculating seasonal indices?
A)simple linear regression
B)centered moving average
C)multiple linear regression
D)weighted moving average
A)simple linear regression
B)centered moving average
C)multiple linear regression
D)weighted moving average
Unlock Deck
Unlock for access to all 100 flashcards in this deck.
Unlock Deck
k this deck
56
48)Additive models are used when patterns of seasonal variations ______.
A)remain constant over time
B)become more or less pronounced as the trend component increases or decreases
C)keep fluctuating over time
D)exhibits different types of trend patterns
A)remain constant over time
B)become more or less pronounced as the trend component increases or decreases
C)keep fluctuating over time
D)exhibits different types of trend patterns
Unlock Deck
Unlock for access to all 100 flashcards in this deck.
Unlock Deck
k this deck
57
53)Which of the following statements is true?
A)Leading indicators are frequently used to track cyclical fluctuations.
B)Leading indicators are frequently used to track seasonal fluctuations.
C)Lagging indicators are frequently used to track cyclical fluctuations.
D)Lagging indicators are frequently used to track seasonal fluctuations.
A)Leading indicators are frequently used to track cyclical fluctuations.
B)Leading indicators are frequently used to track seasonal fluctuations.
C)Lagging indicators are frequently used to track cyclical fluctuations.
D)Lagging indicators are frequently used to track seasonal fluctuations.
Unlock Deck
Unlock for access to all 100 flashcards in this deck.
Unlock Deck
k this deck
58
45)Which of the following methods can be used to evaluate the trend component of a time series?
A)simple moving average
B)trend-adjusted exponential smoothing
C)simple linear regression
D)multiple linear regression
A)simple moving average
B)trend-adjusted exponential smoothing
C)simple linear regression
D)multiple linear regression
Unlock Deck
Unlock for access to all 100 flashcards in this deck.
Unlock Deck
k this deck
59
43)______ method results in a straight line that minimizes the sum of the squares of the differences between the line and each of the actual observations.
A)Best-fit
B)Straight-line
C)Least-squares
D)Linear-line
A)Best-fit
B)Straight-line
C)Least-squares
D)Linear-line
Unlock Deck
Unlock for access to all 100 flashcards in this deck.
Unlock Deck
k this deck
60
47)In a(n)______ model,the seasonal indices are added to the projected trend data to create a combined forecast.
A)additive
B)multiplicative
C)subtractive
D)trend-adjusted
A)additive
B)multiplicative
C)subtractive
D)trend-adjusted
Unlock Deck
Unlock for access to all 100 flashcards in this deck.
Unlock Deck
k this deck
61
77)Which of the following is a drawback of mean absolute deviation (MAD)?
A)There is no information about the forecasting bias.
B)The cancellation of the positive and negative forecast errors can distort the information.
C)Large errors tend to be magnified because they are squared.
D)It is very complex to calculate.
A)There is no information about the forecasting bias.
B)The cancellation of the positive and negative forecast errors can distort the information.
C)Large errors tend to be magnified because they are squared.
D)It is very complex to calculate.
Unlock Deck
Unlock for access to all 100 flashcards in this deck.
Unlock Deck
k this deck
62
80)Which of the following variations cannot be predicted and can be identified only after occurrence?
A)random variations
B)irregular variations
C)seasonal variations
D)cyclical variations
A)random variations
B)irregular variations
C)seasonal variations
D)cyclical variations
Unlock Deck
Unlock for access to all 100 flashcards in this deck.
Unlock Deck
k this deck
63
62)Which of the following statements is true about the error sum of squares (SSE)?
A)It measures the variation resulting from the relationship between the independent and dependent variable.
B)It measures the variation of the actual Y (independent variable)values around the mean Y (Y̅).
C)It measures the variation not explained by the regression but resulting from other factors or variables.
D)It measures the variation explained by the regression.
Unlock Deck
Unlock for access to all 100 flashcards in this deck.
Unlock Deck
k this deck
64
74)The tendency to consistently produce a particular type of forecast (high or low)that isn't accurate is called a(n)______.
A)overestimate
B)underestimate
C)bias
D)wrong estimate
A)overestimate
B)underestimate
C)bias
D)wrong estimate
Unlock Deck
Unlock for access to all 100 flashcards in this deck.
Unlock Deck
k this deck
65
66)The correlation coefficient takes on a value between ______.
A)0 and 1
B)-1 and +1
C)-∞ to +∞
D)-2 to +2
A)0 and 1
B)-1 and +1
C)-∞ to +∞
D)-2 to +2
Unlock Deck
Unlock for access to all 100 flashcards in this deck.
Unlock Deck
k this deck
66
76)Mean absolute percentage error (MAPE)is the ______.
A)average of the sum of the absolute differences between the actual and forecasted demand values
B)average of the sum of the squared differences between the actual and forecasted demand values
C)average of the absolute percentage error
D)average of the absolute differences between the actual and forecasted demand values
Unlock Deck
Unlock for access to all 100 flashcards in this deck.
Unlock Deck
k this deck
67
64)Which of the following statements is true about the coefficient of determination (R²)?
A)The higher the value of R²,the more confidence we have that the estimate is accurate.
B)The lower the value of R²,the more confidence we have that the estimate is accurate.
C)The value of R² has no significance on the accuracy of the estimate.
D)The estimate is accurate when R² = 0.
A)The higher the value of R²,the more confidence we have that the estimate is accurate.
B)The lower the value of R²,the more confidence we have that the estimate is accurate.
C)The value of R² has no significance on the accuracy of the estimate.
D)The estimate is accurate when R² = 0.
Unlock Deck
Unlock for access to all 100 flashcards in this deck.
Unlock Deck
k this deck
68
65)The ______ measures the strength of the relationship between the independent and dependent variable in regression analysis.
A)standard error of the estimate
B)total sum of squares (SST)
C)coefficient of determination
D)correlation coefficient
A)standard error of the estimate
B)total sum of squares (SST)
C)coefficient of determination
D)correlation coefficient
Unlock Deck
Unlock for access to all 100 flashcards in this deck.
Unlock Deck
k this deck
69
69)"The demand for a product is a function of both the price of the product and the dollars spent on promotions by the company that produced it." Which of the following methods is appropriate to forecast demand for the product?
A)simple linear regression analysis
B)multiple linear regression analysis
C)multiplicative method
D)additive method
A)simple linear regression analysis
B)multiple linear regression analysis
C)multiplicative method
D)additive method
Unlock Deck
Unlock for access to all 100 flashcards in this deck.
Unlock Deck
k this deck
70
70)Which of following approaches should forecasters follow while choosing the best forecasting method?
A)Select the method that results in the fewest forecasting errors.
B)Examine the performance of a single forecasting method over time.
C)Select the method that results in the largest forecasting errors.
D)There is no significance on the forecasting method selected since there will always be differences between the forecasts and actual values.
Unlock Deck
Unlock for access to all 100 flashcards in this deck.
Unlock Deck
k this deck
71
79)Which of the following statements is true about the forecasting error measures?
A)Mean absolute deviation is complex and difficult to compute.
B)Cumulative sum error tracks the forecasting bias.
C)Mean absolute deviation provides the percentage of error.
D)Mean squared errors cannot track the accuracy of the forecast.
A)Mean absolute deviation is complex and difficult to compute.
B)Cumulative sum error tracks the forecasting bias.
C)Mean absolute deviation provides the percentage of error.
D)Mean squared errors cannot track the accuracy of the forecast.
Unlock Deck
Unlock for access to all 100 flashcards in this deck.
Unlock Deck
k this deck
72
63)The coefficient of determination has a value between ______.
A)0 and 1
B)-1 and +1
C)-∞ to +∞
D)-1 to 0
A)0 and 1
B)-1 and +1
C)-∞ to +∞
D)-1 to 0
Unlock Deck
Unlock for access to all 100 flashcards in this deck.
Unlock Deck
k this deck
73
75)The ______ is the average of the sum of the squared differences between the actual and the forecasted demand values.
A)mean squared error (MSE)
B)mean absolute deviation (MAD)
C)mean absolute percentage error (MAPE)
D)cumulative sum error (CSE)
A)mean squared error (MSE)
B)mean absolute deviation (MAD)
C)mean absolute percentage error (MAPE)
D)cumulative sum error (CSE)
Unlock Deck
Unlock for access to all 100 flashcards in this deck.
Unlock Deck
k this deck
74
67)The ______ measures the random variation,which is the variation of the actual (observed)y values from the predicted y values (ŷᵢ).
A)correlation coefficient
B)error sum of squares (SSE)
C)coefficient of determination
D)standard error of the estimate
A)correlation coefficient
B)error sum of squares (SSE)
C)coefficient of determination
D)standard error of the estimate
Unlock Deck
Unlock for access to all 100 flashcards in this deck.
Unlock Deck
k this deck
75
71)Which of the following is NOT a way to measure forecasting errors?
A)mean squared error (MSE)
B)mean absolute deviation (MAD)
C)mean absolute percentage error (MAPE)
D)error sum of squares (SSE)
A)mean squared error (MSE)
B)mean absolute deviation (MAD)
C)mean absolute percentage error (MAPE)
D)error sum of squares (SSE)
Unlock Deck
Unlock for access to all 100 flashcards in this deck.
Unlock Deck
k this deck
76
61)The regression sum of squares (SSR)is the ______.
A)unexplained variation
B)explained variation
C)total variation
D)random variation
A)unexplained variation
B)explained variation
C)total variation
D)random variation
Unlock Deck
Unlock for access to all 100 flashcards in this deck.
Unlock Deck
k this deck
77
72)______ is the average of the sum of the absolute differences between the actual and forecasted demand values.
A)Mean squared error (MSE)
B)Mean absolute deviation (MAD)
C)Mean absolute percentage error (MAPE)
D)Cumulative sum error (CSE)
A)Mean squared error (MSE)
B)Mean absolute deviation (MAD)
C)Mean absolute percentage error (MAPE)
D)Cumulative sum error (CSE)
Unlock Deck
Unlock for access to all 100 flashcards in this deck.
Unlock Deck
k this deck
78
68)Which of following assumptions related to the validity of the linear regression model is false?
A)The independent and dependent variables have a linear relationship.
B)The error terms have a constant variance.
C)The error terms are not normally distributed.
D)The error terms have no correlation.
A)The independent and dependent variables have a linear relationship.
B)The error terms have a constant variance.
C)The error terms are not normally distributed.
D)The error terms have no correlation.
Unlock Deck
Unlock for access to all 100 flashcards in this deck.
Unlock Deck
k this deck
79
73)A large positive value of cumulative sum error (CSE)implies ______.
A)the forecast is consistently overstating the actual demand
B)the forecast is consistently understating the actual demand
C)the forecast is exactly equal to the actual demand
D)the forecast is never equal to actual demand
A)the forecast is consistently overstating the actual demand
B)the forecast is consistently understating the actual demand
C)the forecast is exactly equal to the actual demand
D)the forecast is never equal to actual demand
Unlock Deck
Unlock for access to all 100 flashcards in this deck.
Unlock Deck
k this deck
80
78)"Cancellation of the positive and negative forecast errors can distort the information." This is a drawback of ______.
A)mean squared error (MSE)
B)mean absolute deviation (MAD)
C)mean absolute percentage error (MAPE)
D)cumulative sum error (CSE)
A)mean squared error (MSE)
B)mean absolute deviation (MAD)
C)mean absolute percentage error (MAPE)
D)cumulative sum error (CSE)
Unlock Deck
Unlock for access to all 100 flashcards in this deck.
Unlock Deck
k this deck
Unlock Deck
Unlock for access to all 100 flashcards in this deck.


