Deck 2: Organizing and Visualizing Data
Full screen (f)
Question
Question
Question
Question
Question
The table below shows the number of students registered in Accounting 101, Finance 101, Marketing 101 and Statistics 101.
 What percent of the students is registered in Statistics 101?
A) 30%
B) 20%
C) 40%
D) 10%
E) 100%
What percent of the students is registered in Statistics 101?A) 30%
B) 20%
C) 40%
D) 10%
E) 100%
Question
Question
Question
A sample of 188 workers were asked whether they bring bagged lunch to work or buy lunch. The contingency table below displays the results by job type and their lunch choice.
 How many of the workers surveyed were non-management and brought a bagged lunch?
A) 45
B) 57
C) 86
D) 103
E) 188
How many of the workers surveyed were non-management and brought a bagged lunch?A) 45
B) 57
C) 86
D) 103
E) 188
Question
Question
Question
Question
Question
Question
Question
Question
Question
Question
A sample of 188 workers were asked whether they bring bagged lunch to work or buy lunch. The contingency table below displays the results by gender and their lunch choice.
 What proportion of the workers surveyed were management and buy lunch?
A) 0.22
B) 0.24
C) 0.30
D) 0.46
E) 0.55
What proportion of the workers surveyed were management and buy lunch?A) 0.22
B) 0.24
C) 0.30
D) 0.46
E) 0.55
Question
Question
Question
Question
Consider the following frequency distribution: 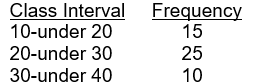
What is the midpoint of the first class?
A) 10
B) 20
C) 15
D) 30
E) 40
What is the midpoint of the first class?
A) 10
B) 20
C) 15
D) 30
E) 40
Question
Consider the following frequency distribution: 
What is the cumulative frequency of the second class interval?
A) 25
B) 40
C) 15
D) 50
What is the cumulative frequency of the second class interval?
A) 25
B) 40
C) 15
D) 50
Question
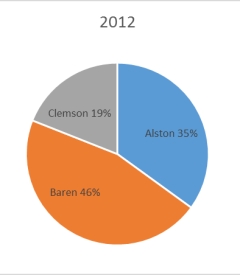
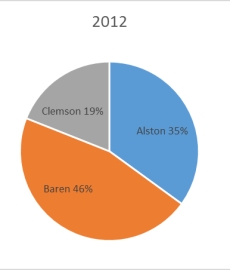
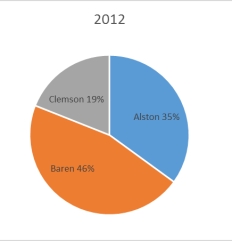
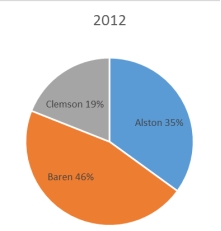
The 2010 and 2012 market share data of the three competitors (Alston, Baren, and Clemson) in an oligopolistic industry are presented in the following pie charts. Total sales for this industry were $1.5 billion in 2010 and $1.8 billion in 2012. Clemson's sales in 2010 were ___. 
A) $330 million
B) $630 million
C) $675 million
D) $828 million
E) $928 million
A) $330 million
B) $630 million
C) $675 million
D) $828 million
E) $928 million
Question
According to the following graphic, "Bent Pins" account for ___% of PCB Failures. 
A) 10
B) 20
C) 30
D) 40
E) 50
A) 10
B) 20
C) 30
D) 40
E) 50
Question
The 2010 and 2012 market share data of the three competitors (Alston, Baren, and Clemson) in an oligopolistic industry are presented in the following pie charts. Total sales for this industry were $1.5 billion in 2010 and $1.8 billion in 2012. Baren's sales in 2010 were ___. 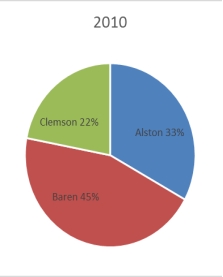
A) $342 million
B) $630 million
C) $675 million
D) $828 million
E) $928 million
A) $342 million
B) $630 million
C) $675 million
D) $828 million
E) $928 million
Question
Question
An instructor made a frequency table of the scores his students got on a test: 
Approximately what percent of students got more than 70?
A) 36
B) 20
C) 50
D) 10
E) 64
Approximately what percent of students got more than 70?
A) 36
B) 20
C) 50
D) 10
E) 64
Question
Question
Question
The 2010 and 2012 market share data of the three competitors (Alston, Baren, and Clemson) in an oligopolistic industry are presented in the following pie charts. 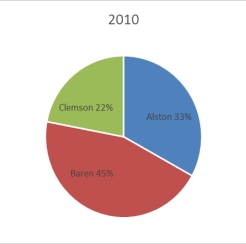
Which of the following is true?
A) Only Baren share.
B) Only Clemson lost market share.
C) Alston lost market share.
D) Baren lost market share.
E) All companies lost market share.
Which of the following is true?
A) Only Baren share.
B) Only Clemson lost market share.
C) Alston lost market share.
D) Baren lost market share.
E) All companies lost market share.
Question
According to the following graphic, the most common cause of PCB Failures is a ___. 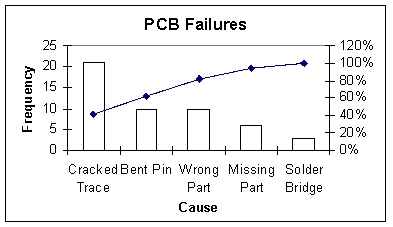
A) cracked trace
B) bent pin
C) missing part
D) solder bridge
E) wrong Part
A) cracked trace
B) bent pin
C) missing part
D) solder bridge
E) wrong Part
Question
Consider the following frequency distribution:
What is the relative frequency of the first class?
A) 0.15
B) 0.30
C) 0.10
D) 0.20
E) 0.40
What is the relative frequency of the first class?
A) 0.15
B) 0.30
C) 0.10
D) 0.20
E) 0.40
Question
Question
The following graphic of PCB Failures is a ___. 
A) scatter plot
B) Pareto chart
C) pie chart
D) cumulative histogram chart
E) line diagram
A) scatter plot
B) Pareto chart
C) pie chart
D) cumulative histogram chart
E) line diagram
Question
An instructor made a frequency table of the scores his students got on a test: 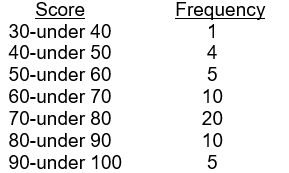
The midpoint of the last class interval is ___.
A) 90
B) 5
C) 95
D) 100
E) 50
The midpoint of the last class interval is ___.
A) 90
B) 5
C) 95
D) 100
E) 50
Question
Question
The 2010 and 2012 market share data of the three competitors (Alston, Baren, and Clemson) in an oligopolistic industry are presented in the following pie charts: 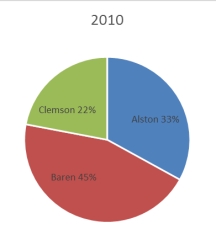
Which of the following may be a false statement?
A) Sales revenues declined at Clemson.
B) Only Clemson lost market share.
C) Alston gained market share.
D) Baren gained market share.
E) Both Alston and Baren gained market share.
Which of the following may be a false statement?
A) Sales revenues declined at Clemson.
B) Only Clemson lost market share.
C) Alston gained market share.
D) Baren gained market share.
E) Both Alston and Baren gained market share.
Question
Question
Question
Question
Consider the relative frequency distribution given below: 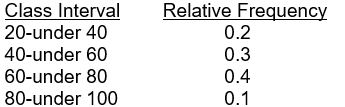
There were 60 numbers in the data set. How many of the number were less than 80?
A) 90
B) 80
C) 0.9
D) 54
E) 100
There were 60 numbers in the data set. How many of the number were less than 80?
A) 90
B) 80
C) 0.9
D) 54
E) 100
Question
The number of phone calls arriving at a switchboard each hour has been recorded, and the following frequency distribution has been developed. 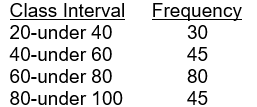
What is the midpoint of the last class?
A) 80
B) 100
C) 95
D) 90
E) 85
What is the midpoint of the last class?
A) 80
B) 100
C) 95
D) 90
E) 85
Question
Consider the following frequency distribution: 
What is the cumulative frequency of the second class interval?
A) 25
B) 45
C) 70
D) 100
E) 250
What is the cumulative frequency of the second class interval?
A) 25
B) 45
C) 70
D) 100
E) 250
Question
Consider the following frequency distribution: 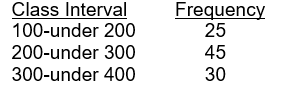
What is the relative frequency of the second class interval?
A) 0.45
B) 0.70
C) 0.30
D) 0.33
E) 0.50
What is the relative frequency of the second class interval?
A) 0.45
B) 0.70
C) 0.30
D) 0.33
E) 0.50
Question
Consider the relative frequency distribution given below: 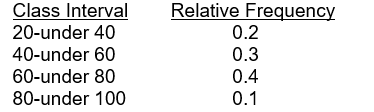
There were 60 numbers in the data set. How many numbers were in the interval 40-under 60?
A) 30
B) 50
C) 18
D) 12
E) 15
There were 60 numbers in the data set. How many numbers were in the interval 40-under 60?
A) 30
B) 50
C) 18
D) 12
E) 15
Question
Abel Alonzo, Director of Human Resources, is exploring employee absenteeism at the Harrison Haulers Plant during the last operating year. A review of all personnel records indicated that absences ranged from zero to twenty-nine days per employee. The following class intervals were proposed for a frequency distribution of absences. 
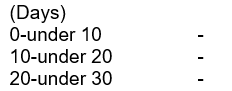
Which of the following might represent a problem with this set of intervals?
A) There are too few intervals.
B) Some numbers between 0 and 29 would not fall into any interval.
C) The first and second interval overlaps.
D) There are too many intervals.
E) The second and the third interval overlap.
Which of the following might represent a problem with this set of intervals?
A) There are too few intervals.
B) Some numbers between 0 and 29 would not fall into any interval.
C) The first and second interval overlaps.
D) There are too many intervals.
E) The second and the third interval overlap.
Question
The number of phone calls arriving at a switchboard each hour has been recorded, and the following frequency distribution has been developed.
What is the cumulative frequency of the third class?
A) 80
B) 0.40
C) 155
D) 75
E) 105
What is the cumulative frequency of the third class?
A) 80
B) 0.40
C) 155
D) 75
E) 105
Question
Pinky Bauer, Chief Financial Officer of Harrison Haulers, Inc., suspects irregularities in the payroll system and orders an inspection of "each and every payroll voucher issued since January 1, 2000." Each payroll voucher was inspected and the following frequency distribution was compiled.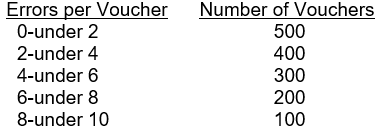
The cumulative frequency of the second class interval is ___.
A) 1,500
B) 500
C) 900
D) 1,000
E) 1,200
The cumulative frequency of the second class interval is ___.
A) 1,500
B) 500
C) 900
D) 1,000
E) 1,200
Question
The number of phone calls arriving at a switchboard each hour has been recorded, and the following frequency distribution has been developed.
What is the relative frequency of the second class?
A) 0.455
B) 0.900
C) 0.225
D) 0.750
E) 0.725
What is the relative frequency of the second class?
A) 0.455
B) 0.900
C) 0.225
D) 0.750
E) 0.725
Question
Pinky Bauer, Chief Financial Officer of Harrison Haulers, Inc., suspects irregularities in the payroll system and orders an inspection of "each and every payroll voucher issued since January 1, 2000." Each payroll voucher was inspected and the following frequency distribution was compiled. 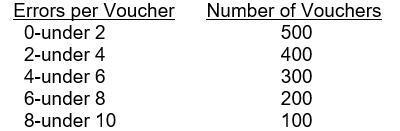
The relative frequency of the first class interval is ___.
A) 0.50
B) 0.33
C) 0.40
D) 0.27
E) 0.67
The relative frequency of the first class interval is ___.
A) 0.50
B) 0.33
C) 0.40
D) 0.27
E) 0.67
Question
Consider the following frequency distribution: 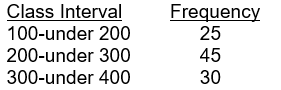
What is the midpoint of the last class interval?
A) 15
B) 350
C) 300
D) 200
E) 400
What is the midpoint of the last class interval?
A) 15
B) 350
C) 300
D) 200
E) 400
Question
Question
The following class intervals for a frequency distribution were developed to provide information regarding the starting salaries for students graduating from a particular school: 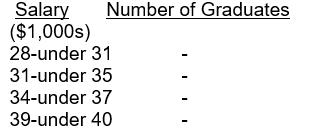
Before data was collected, someone questioned the validity of this arrangement. Which of the following represents a problem with this set of intervals?
A) There are too many intervals.
B) The class widths are too small.
C) The class widths are too large.
D) The second and the third interval overlap.
E) There are too few intervals.
Question
Abel Alonzo, Director of Human Resources, is exploring employee absenteeism at the Harrison Haulers Plant during the last operating year. A review of all personnel records indicated that absences ranged from zero to twenty-nine days per employee. The following class intervals were proposed for a frequency distribution of absences. 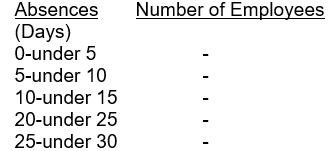
Which of the following represents a problem with this set of intervals?
A) There are too few intervals.
B) Some numbers between 0 and 29, inclusively, would not fall into any interval.
C) The first and second interval overlaps.
D) There are too many intervals.
E) The second and the third interval overlap.
Question
Question
Question
Consider the relative frequency distribution given below: 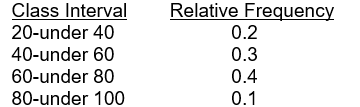
There were 60 numbers in the data set. How many numbers were in the interval 20-under 40?
A) 12
B) 20
C) 40
D) 10
E) 15
There were 60 numbers in the data set. How many numbers were in the interval 20-under 40?
A) 12
B) 20
C) 40
D) 10
E) 15
Question
The following class intervals for a frequency distribution were developed to provide information regarding the starting salaries for students graduating from a particular school: 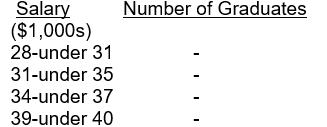
Before data was collected, someone questioned the validity of this arrangement. Which of the following represents a problem with this set of intervals?
A) There are too many intervals.
B) The class widths are too small.
C) Some numbers between 28,000 and 40,000 would fall into two different intervals.
D) The first and the second interval overlap.
E) There are too few intervals.
Question
Consider the following frequency distribution: 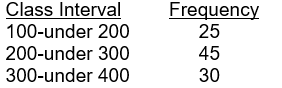
What is the midpoint of the first class?
A) 100
B) 150
C) 25
D) 250
E) 200
What is the midpoint of the first class?
A) 100
B) 150
C) 25
D) 250
E) 200
Question
Question
Question
Each day, the office staff at Oasis Quick Shop prepares a frequency distribution and an ogive of sales transactions by dollar value of the transactions. Saturday's cumulative frequency ogive follows: 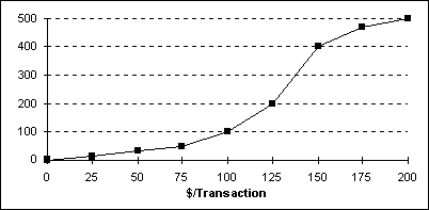 The percentage of sales transactions on Saturday that were under $100 each was ___.
A) 100
B) 10
C) 80
D) 20
E) 15
The percentage of sales transactions on Saturday that were under $100 each was ___.A) 100
B) 10
C) 80
D) 20
E) 15
Question
Scott Brim, Chief Financial Officer of Space Mall, Inc., wants to better understand the biest business hours during the weekend. There are door sensors that approximately count the number of people who enter the mall. The table below presents the average number of people coming in during the weekend, for the last month: 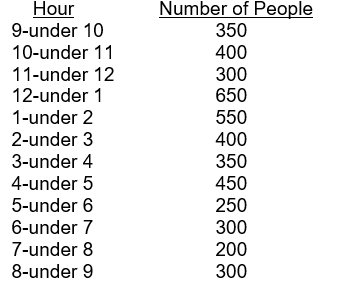
The relative frequency of the fourth class interval is ___.
A) 0.07
B) 0.08
C) 0.14
D) 0.15
E) 0.38
The relative frequency of the fourth class interval is ___.
A) 0.07
B) 0.08
C) 0.14
D) 0.15
E) 0.38
Question
Each day, the manager at Jamie's Auto Care Shop prepares a frequency distribution and a histogram of sales transactions by dollar value of the transactions. Friday's histogram follows: 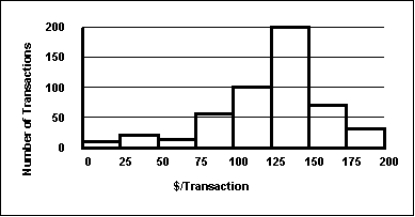 On Friday, the approximate number of sales transactions in the 75-under 100 category was ___.
A) 50
B) 100
C) 150
D) 200
E) 60
On Friday, the approximate number of sales transactions in the 75-under 100 category was ___.A) 50
B) 100
C) 150
D) 200
E) 60
Question
Question
Question
Question
Question
Each day, the office staff at Oasis Quick Shop prepares a frequency distribution and an ogive of sales transactions by dollar value of the transactions. Saturday's cumulative frequency ogive follows:  The total number of sales transactions on Saturday was ___.
A) 200
B) 500
C) 300
D) 100
E) 400
The total number of sales transactions on Saturday was ___.A) 200
B) 500
C) 300
D) 100
E) 400
Question
The staff of Mr. Wayne Wertz, VP of Operations at Portland Peoples Bank, prepared a cumulative frequency ogive of waiting time for walk-in customers.  The percentage of walk-in customers waiting one minute or less was ___.
A) 22%
B) 11%
C) 67%
D) 10%
E) 5%
The percentage of walk-in customers waiting one minute or less was ___.A) 22%
B) 11%
C) 67%
D) 10%
E) 5%
Question
Question
The staff of Mr. Wayne Wertz, VP of Operations at Portland Peoples Bank, prepared a frequency histogram of waiting time for drive up ATM customers. 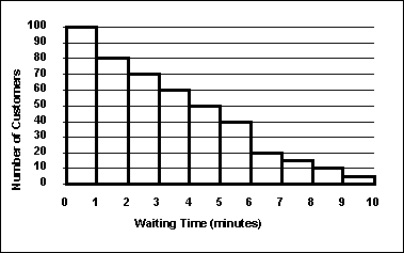 Approximately ___ drive up ATM customers waited less than 2 minutes.
A) 20
B) 30
C) 100
D) 180
E) 200
Approximately ___ drive up ATM customers waited less than 2 minutes.A) 20
B) 30
C) 100
D) 180
E) 200
Question
The staff of Mr. Wayne Wertz, VP of Operations at Portland Peoples Bank, prepared a cumulative frequency ogive of waiting time for walk-in customers. 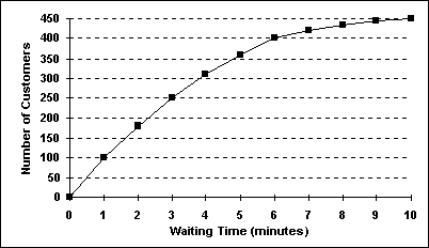 The percentage of walk-in customers waiting more than 6 minutes was ___.
A) 22%
B) 11%
C) 67%
D) 10%
E) 75%
The percentage of walk-in customers waiting more than 6 minutes was ___.A) 22%
B) 11%
C) 67%
D) 10%
E) 75%
Question
Each day, the manager at Jamie's Auto Care prepares a frequency distribution and a histogram of sales transactions by dollar value of the transactions. Friday's histogram follows:  On Friday, the approximate number of sales transactions between $150 and $175 was ___.
A) 75
B) 200
C) 300
D) 400
E) 500
On Friday, the approximate number of sales transactions between $150 and $175 was ___.A) 75
B) 200
C) 300
D) 400
E) 500
Question
Each day, the office staff at Oasis Quick Shop prepares a frequency distribution and an ogive of sales transactions by dollar value of the transactions. Saturday's cumulative frequency ogive follows:  The percentage of sales transactions on Saturday that were at least $100 each was ___.
A) 100
B) 10
C) 80
D) 20
E) 15
The percentage of sales transactions on Saturday that were at least $100 each was ___.A) 100
B) 10
C) 80
D) 20
E) 15
Question
Each day, the office staff at Oasis Quick Shop prepares a frequency distribution and an ogive of sales transactions by dollar value of the transactions. Saturday's cumulative frequency ogive follows:  The percentage of sales transactions on Saturday that were between $100 and $150 was ___.
A) 20%
B) 40%
C) 60%
D) 80%
E) 10%
The percentage of sales transactions on Saturday that were between $100 and $150 was ___.A) 20%
B) 40%
C) 60%
D) 80%
E) 10%
Question
The staff of Mr. Wayne Wertz, VP of Operations at Portland Peoples Bank, prepared a cumulative frequency ogive of waiting time for walk-in customers.  The total number of walk-in customers included in the study was ___.
A) 100
B) 250
C) 300
D) 450
E) 500
The total number of walk-in customers included in the study was ___.A) 100
B) 250
C) 300
D) 450
E) 500
Question
The staff of Mr. Wayne Wertz, VP of Operations at Portland Peoples Bank, prepared a cumulative frequency ogive of waiting time for walk-in customers.  The percentage of walk-in customers waiting between 1 and 6 minutes was ___.
A) 22%
B) 11%
C) 37%
D) 10%
E) 67%
The percentage of walk-in customers waiting between 1 and 6 minutes was ___.A) 22%
B) 11%
C) 37%
D) 10%
E) 67%
Question
Pinky Bauer, Chief Financial Officer of Harrison Haulers, Inc., suspects irregularities in the payroll system and orders an inspection of "each and every payroll voucher issued since January 1, 2000." Each payroll voucher was inspected and the following frequency distribution was compiled.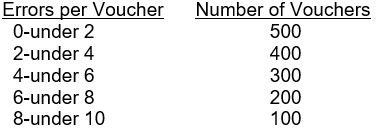
The midpoint of the first class interval is ___.
A) 500
B) 2
C) 1.5
D) 1
E) 250
The midpoint of the first class interval is ___.
A) 500
B) 2
C) 1.5
D) 1
E) 250

Unlock Deck
Sign up to unlock the cards in this deck!
Unlock Deck
Unlock Deck
1/95
Play
Full screen (f)
Deck 2: Organizing and Visualizing Data
1
A cumulative frequency distribution provides a running total of the frequencies in the classes.
True
2
A Pareto chart and a pie chart are both types of categorical graphs.
True
3
In contrast to quantitative data graphs that are plotted along a numerical scale, categorical graphs are plotted using non-numerical categories.
False
4
One rule that must always be followed in constructing frequency distributions is that the adjacent classes must overlap.
Unlock Deck
Unlock for access to all 95 flashcards in this deck.
Unlock Deck
k this deck
5
The table below shows the number of students registered in Accounting 101, Finance 101, Marketing 101 and Statistics 101.
What percent of the students is registered in Statistics 101?
A) 30%
B) 20%
C) 40%
D) 10%
E) 100%
What percent of the students is registered in Statistics 101?A) 30%
B) 20%
C) 40%
D) 10%
E) 100%
Unlock Deck
Unlock for access to all 95 flashcards in this deck.
Unlock Deck
k this deck
6
A scatter plot is useful for examining the relationship between two numerical variables.
Unlock Deck
Unlock for access to all 95 flashcards in this deck.
Unlock Deck
k this deck
7
Which of the following statements is/are true?
I. Cross tabulation is a two-dimensional table that displays the frequency for two categorical variables.
II. Cross tabulation can be referred to as a contingency table.
III. Excel calls contingency table as pivot table.
A) I only
B) II only
C) III only
D) I and III only
E) all of the above
I. Cross tabulation is a two-dimensional table that displays the frequency for two categorical variables.
II. Cross tabulation can be referred to as a contingency table.
III. Excel calls contingency table as pivot table.
A) I only
B) II only
C) III only
D) I and III only
E) all of the above
Unlock Deck
Unlock for access to all 95 flashcards in this deck.
Unlock Deck
k this deck
8
A sample of 188 workers were asked whether they bring bagged lunch to work or buy lunch. The contingency table below displays the results by job type and their lunch choice.
How many of the workers surveyed were non-management and brought a bagged lunch?
A) 45
B) 57
C) 86
D) 103
E) 188
How many of the workers surveyed were non-management and brought a bagged lunch?A) 45
B) 57
C) 86
D) 103
E) 188
Unlock Deck
Unlock for access to all 95 flashcards in this deck.
Unlock Deck
k this deck
9
A summary of data in which raw data are grouped into categories and the number of items in each category is listed is called a
A) frequency table.
B) summary statistics.
C) grouped frequency.
D) table of content.
E) none of the above
A) frequency table.
B) summary statistics.
C) grouped frequency.
D) table of content.
E) none of the above
Unlock Deck
Unlock for access to all 95 flashcards in this deck.
Unlock Deck
k this deck
10
The difference between the highest number and the lowest number in a set of data is called the differential frequency.
Unlock Deck
Unlock for access to all 95 flashcards in this deck.
Unlock Deck
k this deck
11
A summary of data in which raw data are grouped into different intervals and the number of items in each group is listed is called a frequency distribution.
Unlock Deck
Unlock for access to all 95 flashcards in this deck.
Unlock Deck
k this deck
12
A histogram can be described as a type of vertical bar chart.
Unlock Deck
Unlock for access to all 95 flashcards in this deck.
Unlock Deck
k this deck
13
If the individual class frequency is divided by the total frequency, the result is the median frequency.
Unlock Deck
Unlock for access to all 95 flashcards in this deck.
Unlock Deck
k this deck
14
A scatter plot shows how the numbers in a data set are scattered around their average.
Unlock Deck
Unlock for access to all 95 flashcards in this deck.
Unlock Deck
k this deck
15
A cumulative frequency polygon is also called an ogive.
Unlock Deck
Unlock for access to all 95 flashcards in this deck.
Unlock Deck
k this deck
16
A graphical representation of a frequency distribution is called a pie chart.
Unlock Deck
Unlock for access to all 95 flashcards in this deck.
Unlock Deck
k this deck
17
In a histogram, the tallest bar represents the class with the highest cumulative frequency.
Unlock Deck
Unlock for access to all 95 flashcards in this deck.
Unlock Deck
k this deck
18
A sample of 188 workers were asked whether they bring bagged lunch to work or buy lunch. The contingency table below displays the results by gender and their lunch choice.
What proportion of the workers surveyed were management and buy lunch?
A) 0.22
B) 0.24
C) 0.30
D) 0.46
E) 0.55
What proportion of the workers surveyed were management and buy lunch?A) 0.22
B) 0.24
C) 0.30
D) 0.46
E) 0.55
Unlock Deck
Unlock for access to all 95 flashcards in this deck.
Unlock Deck
k this deck
19
For any given data set, a frequency distribution with a larger number of classes will always be better than the one with a smaller number of classes.
Unlock Deck
Unlock for access to all 95 flashcards in this deck.
Unlock Deck
k this deck
20
A scatter plot is a two-dimensional graph plot of data containing pairs of observations on two numerical variables.
Unlock Deck
Unlock for access to all 95 flashcards in this deck.
Unlock Deck
k this deck
21
Categorical data can be represented graphically by a(n)
A) histogram.
B) frequency polygon.
C) ogive.
D) bar chart.
E) none of the above
A) histogram.
B) frequency polygon.
C) ogive.
D) bar chart.
E) none of the above
Unlock Deck
Unlock for access to all 95 flashcards in this deck.
Unlock Deck
k this deck
22
Consider the following frequency distribution:
What is the midpoint of the first class?
A) 10
B) 20
C) 15
D) 30
E) 40
What is the midpoint of the first class?
A) 10
B) 20
C) 15
D) 30
E) 40
Unlock Deck
Unlock for access to all 95 flashcards in this deck.
Unlock Deck
k this deck
23
Consider the following frequency distribution:
What is the cumulative frequency of the second class interval?
A) 25
B) 40
C) 15
D) 50
What is the cumulative frequency of the second class interval?
A) 25
B) 40
C) 15
D) 50
Unlock Deck
Unlock for access to all 95 flashcards in this deck.
Unlock Deck
k this deck
24
The 2010 and 2012 market share data of the three competitors (Alston, Baren, and Clemson) in an oligopolistic industry are presented in the following pie charts. Total sales for this industry were $1.5 billion in 2010 and $1.8 billion in 2012. Clemson's sales in 2010 were ___.
A) $330 million
B) $630 million
C) $675 million
D) $828 million
E) $928 million
A) $330 million
B) $630 million
C) $675 million
D) $828 million
E) $928 million
Unlock Deck
Unlock for access to all 95 flashcards in this deck.
Unlock Deck
k this deck
25
According to the following graphic, "Bent Pins" account for ___% of PCB Failures.
A) 10
B) 20
C) 30
D) 40
E) 50
A) 10
B) 20
C) 30
D) 40
E) 50
Unlock Deck
Unlock for access to all 95 flashcards in this deck.
Unlock Deck
k this deck
26
The 2010 and 2012 market share data of the three competitors (Alston, Baren, and Clemson) in an oligopolistic industry are presented in the following pie charts. Total sales for this industry were $1.5 billion in 2010 and $1.8 billion in 2012. Baren's sales in 2010 were ___.
A) $342 million
B) $630 million
C) $675 million
D) $828 million
E) $928 million
A) $342 million
B) $630 million
C) $675 million
D) $828 million
E) $928 million
Unlock Deck
Unlock for access to all 95 flashcards in this deck.
Unlock Deck
k this deck
27
Which of the following would be most helpful in constructing a pie chart?
A) cumulative percent
B) relative frequency
C) ogive
D) frequency
E) none of the above
A) cumulative percent
B) relative frequency
C) ogive
D) frequency
E) none of the above
Unlock Deck
Unlock for access to all 95 flashcards in this deck.
Unlock Deck
k this deck
28
An instructor made a frequency table of the scores his students got on a test:
Approximately what percent of students got more than 70?
A) 36
B) 20
C) 50
D) 10
E) 64
Approximately what percent of students got more than 70?
A) 36
B) 20
C) 50
D) 10
E) 64
Unlock Deck
Unlock for access to all 95 flashcards in this deck.
Unlock Deck
k this deck
29
Categorical data
A) are always nonnumeric.
B) may be either numeric or nonnumeric.
C) are always numeric.
D) indicate how many or how much.
E) none of the above
A) are always nonnumeric.
B) may be either numeric or nonnumeric.
C) are always numeric.
D) indicate how many or how much.
E) none of the above
Unlock Deck
Unlock for access to all 95 flashcards in this deck.
Unlock Deck
k this deck
30
A graph that can be used to represent data on two categorical variables simultaneously is called a(n)
A) Pareto chart.
B) ogive.
C) two variable bar chart.
D) contingency table.
E) histogram.
A) Pareto chart.
B) ogive.
C) two variable bar chart.
D) contingency table.
E) histogram.
Unlock Deck
Unlock for access to all 95 flashcards in this deck.
Unlock Deck
k this deck
31
The 2010 and 2012 market share data of the three competitors (Alston, Baren, and Clemson) in an oligopolistic industry are presented in the following pie charts.
Which of the following is true?
A) Only Baren share.
B) Only Clemson lost market share.
C) Alston lost market share.
D) Baren lost market share.
E) All companies lost market share.
Which of the following is true?
A) Only Baren share.
B) Only Clemson lost market share.
C) Alston lost market share.
D) Baren lost market share.
E) All companies lost market share.
Unlock Deck
Unlock for access to all 95 flashcards in this deck.
Unlock Deck
k this deck
32
According to the following graphic, the most common cause of PCB Failures is a ___.
A) cracked trace
B) bent pin
C) missing part
D) solder bridge
E) wrong Part
A) cracked trace
B) bent pin
C) missing part
D) solder bridge
E) wrong Part
Unlock Deck
Unlock for access to all 95 flashcards in this deck.
Unlock Deck
k this deck
33
Consider the following frequency distribution:
What is the relative frequency of the first class?
A) 0.15
B) 0.30
C) 0.10
D) 0.20
E) 0.40
What is the relative frequency of the first class?
A) 0.15
B) 0.30
C) 0.10
D) 0.20
E) 0.40
Unlock Deck
Unlock for access to all 95 flashcards in this deck.
Unlock Deck
k this deck
34
An instructor has decided to graphically represent the grades on a test. The instructor uses a plus/minus grading system (i.e. she gives grades of A-, B+, etc.). Which of the following would provide the most information for the students?
A) a histogram
B) bar chart
C) a cumulative frequency distribution
D) a frequency distribution
E) a scatter plot
A) a histogram
B) bar chart
C) a cumulative frequency distribution
D) a frequency distribution
E) a scatter plot
Unlock Deck
Unlock for access to all 95 flashcards in this deck.
Unlock Deck
k this deck
35
The following graphic of PCB Failures is a ___.
A) scatter plot
B) Pareto chart
C) pie chart
D) cumulative histogram chart
E) line diagram
A) scatter plot
B) Pareto chart
C) pie chart
D) cumulative histogram chart
E) line diagram
Unlock Deck
Unlock for access to all 95 flashcards in this deck.
Unlock Deck
k this deck
36
An instructor made a frequency table of the scores his students got on a test:
The midpoint of the last class interval is ___.
A) 90
B) 5
C) 95
D) 100
E) 50
The midpoint of the last class interval is ___.
A) 90
B) 5
C) 95
D) 100
E) 50
Unlock Deck
Unlock for access to all 95 flashcards in this deck.
Unlock Deck
k this deck
37
Categorical data can be represented graphically by a(n)
A) histogram.
B) frequency polygon.
C) ogive.
D) pie chart.
E) none of the above
A) histogram.
B) frequency polygon.
C) ogive.
D) pie chart.
E) none of the above
Unlock Deck
Unlock for access to all 95 flashcards in this deck.
Unlock Deck
k this deck
38
The 2010 and 2012 market share data of the three competitors (Alston, Baren, and Clemson) in an oligopolistic industry are presented in the following pie charts:
Which of the following may be a false statement?
A) Sales revenues declined at Clemson.
B) Only Clemson lost market share.
C) Alston gained market share.
D) Baren gained market share.
E) Both Alston and Baren gained market share.
Which of the following may be a false statement?
A) Sales revenues declined at Clemson.
B) Only Clemson lost market share.
C) Alston gained market share.
D) Baren gained market share.
E) Both Alston and Baren gained market share.
Unlock Deck
Unlock for access to all 95 flashcards in this deck.
Unlock Deck
k this deck
39
The staffs of the Accounting and the Quality Control departments rated their respective supervisor's leadership style as either (1) authoritarian or (2) participatory. Sixty-eight percent of the accounting staff rated their supervisor "authoritarian," and thirty-two percent rated him "participatory." Forty percent of the quality control staff rated their supervisor "authoritarian," and sixty percent rated her "participatory." The best graphic depiction of these data would be two ___.
A) histograms
B) frequency polygons
C) ogives
D) pie charts
E) scatter plots
A) histograms
B) frequency polygons
C) ogives
D) pie charts
E) scatter plots
Unlock Deck
Unlock for access to all 95 flashcards in this deck.
Unlock Deck
k this deck
40
The relative frequency of a category is computed by
A) dividing the frequency of the category by the sample size.
B) multiplying the frequency of the category by the sample size.
C) dividing the sample size by the frequency of the category.
D) frequency of the category.
E) none of the above
A) dividing the frequency of the category by the sample size.
B) multiplying the frequency of the category by the sample size.
C) dividing the sample size by the frequency of the category.
D) frequency of the category.
E) none of the above
Unlock Deck
Unlock for access to all 95 flashcards in this deck.
Unlock Deck
k this deck
41
A frequency distribution was developed. The lower endpoint of the first class is 9.30, and the midpoint is 9.35. What is the upper endpoint of this class?
A) 9.50
B) 9.60
C) 9.70
D) 9.40
E) 9.80
A) 9.50
B) 9.60
C) 9.70
D) 9.40
E) 9.80
Unlock Deck
Unlock for access to all 95 flashcards in this deck.
Unlock Deck
k this deck
42
Consider the relative frequency distribution given below:
There were 60 numbers in the data set. How many of the number were less than 80?
A) 90
B) 80
C) 0.9
D) 54
E) 100
There were 60 numbers in the data set. How many of the number were less than 80?
A) 90
B) 80
C) 0.9
D) 54
E) 100
Unlock Deck
Unlock for access to all 95 flashcards in this deck.
Unlock Deck
k this deck
43
The number of phone calls arriving at a switchboard each hour has been recorded, and the following frequency distribution has been developed.
What is the midpoint of the last class?
A) 80
B) 100
C) 95
D) 90
E) 85
What is the midpoint of the last class?
A) 80
B) 100
C) 95
D) 90
E) 85
Unlock Deck
Unlock for access to all 95 flashcards in this deck.
Unlock Deck
k this deck
44
Consider the following frequency distribution:
What is the cumulative frequency of the second class interval?
A) 25
B) 45
C) 70
D) 100
E) 250
What is the cumulative frequency of the second class interval?
A) 25
B) 45
C) 70
D) 100
E) 250
Unlock Deck
Unlock for access to all 95 flashcards in this deck.
Unlock Deck
k this deck
45
Consider the following frequency distribution:
What is the relative frequency of the second class interval?
A) 0.45
B) 0.70
C) 0.30
D) 0.33
E) 0.50
What is the relative frequency of the second class interval?
A) 0.45
B) 0.70
C) 0.30
D) 0.33
E) 0.50
Unlock Deck
Unlock for access to all 95 flashcards in this deck.
Unlock Deck
k this deck
46
Consider the relative frequency distribution given below:
There were 60 numbers in the data set. How many numbers were in the interval 40-under 60?
A) 30
B) 50
C) 18
D) 12
E) 15
There were 60 numbers in the data set. How many numbers were in the interval 40-under 60?
A) 30
B) 50
C) 18
D) 12
E) 15
Unlock Deck
Unlock for access to all 95 flashcards in this deck.
Unlock Deck
k this deck
47
Abel Alonzo, Director of Human Resources, is exploring employee absenteeism at the Harrison Haulers Plant during the last operating year. A review of all personnel records indicated that absences ranged from zero to twenty-nine days per employee. The following class intervals were proposed for a frequency distribution of absences.
Which of the following might represent a problem with this set of intervals?
A) There are too few intervals.
B) Some numbers between 0 and 29 would not fall into any interval.
C) The first and second interval overlaps.
D) There are too many intervals.
E) The second and the third interval overlap.
Which of the following might represent a problem with this set of intervals?
A) There are too few intervals.
B) Some numbers between 0 and 29 would not fall into any interval.
C) The first and second interval overlaps.
D) There are too many intervals.
E) The second and the third interval overlap.
Unlock Deck
Unlock for access to all 95 flashcards in this deck.
Unlock Deck
k this deck
48
The number of phone calls arriving at a switchboard each hour has been recorded, and the following frequency distribution has been developed.
What is the cumulative frequency of the third class?
A) 80
B) 0.40
C) 155
D) 75
E) 105
What is the cumulative frequency of the third class?
A) 80
B) 0.40
C) 155
D) 75
E) 105
Unlock Deck
Unlock for access to all 95 flashcards in this deck.
Unlock Deck
k this deck
49
Pinky Bauer, Chief Financial Officer of Harrison Haulers, Inc., suspects irregularities in the payroll system and orders an inspection of "each and every payroll voucher issued since January 1, 2000." Each payroll voucher was inspected and the following frequency distribution was compiled.
The cumulative frequency of the second class interval is ___.
A) 1,500
B) 500
C) 900
D) 1,000
E) 1,200
The cumulative frequency of the second class interval is ___.
A) 1,500
B) 500
C) 900
D) 1,000
E) 1,200
Unlock Deck
Unlock for access to all 95 flashcards in this deck.
Unlock Deck
k this deck
50
The number of phone calls arriving at a switchboard each hour has been recorded, and the following frequency distribution has been developed.
What is the relative frequency of the second class?
A) 0.455
B) 0.900
C) 0.225
D) 0.750
E) 0.725
What is the relative frequency of the second class?
A) 0.455
B) 0.900
C) 0.225
D) 0.750
E) 0.725
Unlock Deck
Unlock for access to all 95 flashcards in this deck.
Unlock Deck
k this deck
51
Pinky Bauer, Chief Financial Officer of Harrison Haulers, Inc., suspects irregularities in the payroll system and orders an inspection of "each and every payroll voucher issued since January 1, 2000." Each payroll voucher was inspected and the following frequency distribution was compiled.
The relative frequency of the first class interval is ___.
A) 0.50
B) 0.33
C) 0.40
D) 0.27
E) 0.67
The relative frequency of the first class interval is ___.
A) 0.50
B) 0.33
C) 0.40
D) 0.27
E) 0.67
Unlock Deck
Unlock for access to all 95 flashcards in this deck.
Unlock Deck
k this deck
52
Consider the following frequency distribution:
What is the midpoint of the last class interval?
A) 15
B) 350
C) 300
D) 200
E) 400
What is the midpoint of the last class interval?
A) 15
B) 350
C) 300
D) 200
E) 400
Unlock Deck
Unlock for access to all 95 flashcards in this deck.
Unlock Deck
k this deck
53
A person has decided to construct a frequency distribution for a set of data containing 60 numbers. The lowest number is 23 and the highest number is 68. If 7 classes are used, the class width should be approximately ___.
A) 5
B) 7
C) 9
D) 11
E) 12
A) 5
B) 7
C) 9
D) 11
E) 12
Unlock Deck
Unlock for access to all 95 flashcards in this deck.
Unlock Deck
k this deck
54
The following class intervals for a frequency distribution were developed to provide information regarding the starting salaries for students graduating from a particular school:
Before data was collected, someone questioned the validity of this arrangement. Which of the following represents a problem with this set of intervals?
A) There are too many intervals.
B) The class widths are too small.
C) The class widths are too large.
D) The second and the third interval overlap.
E) There are too few intervals.
Unlock Deck
Unlock for access to all 95 flashcards in this deck.
Unlock Deck
k this deck
55
Abel Alonzo, Director of Human Resources, is exploring employee absenteeism at the Harrison Haulers Plant during the last operating year. A review of all personnel records indicated that absences ranged from zero to twenty-nine days per employee. The following class intervals were proposed for a frequency distribution of absences.
Which of the following represents a problem with this set of intervals?
A) There are too few intervals.
B) Some numbers between 0 and 29, inclusively, would not fall into any interval.
C) The first and second interval overlaps.
D) There are too many intervals.
E) The second and the third interval overlap.
Unlock Deck
Unlock for access to all 95 flashcards in this deck.
Unlock Deck
k this deck
56
A person has decided to construct a frequency distribution for a set of data containing 60 numbers. The lowest number is 23 and the highest number is 68. If 5 classes are used, the class width should be approximately ___.
A) 4
B) 12
C) 8
D) 5
E) 9
A) 4
B) 12
C) 8
D) 5
E) 9
Unlock Deck
Unlock for access to all 95 flashcards in this deck.
Unlock Deck
k this deck
57
The cumulative frequency for a class is 27. The cumulative frequency for the next (non-empty) class will be ___.
A) less than 27
B) equal to 27
C) next class frequency minus 27
D) 27 minus the next class frequency
E) 27 plus the next class frequency
A) less than 27
B) equal to 27
C) next class frequency minus 27
D) 27 minus the next class frequency
E) 27 plus the next class frequency
Unlock Deck
Unlock for access to all 95 flashcards in this deck.
Unlock Deck
k this deck
58
Consider the relative frequency distribution given below:
There were 60 numbers in the data set. How many numbers were in the interval 20-under 40?
A) 12
B) 20
C) 40
D) 10
E) 15
There were 60 numbers in the data set. How many numbers were in the interval 20-under 40?
A) 12
B) 20
C) 40
D) 10
E) 15
Unlock Deck
Unlock for access to all 95 flashcards in this deck.
Unlock Deck
k this deck
59
The following class intervals for a frequency distribution were developed to provide information regarding the starting salaries for students graduating from a particular school:
Before data was collected, someone questioned the validity of this arrangement. Which of the following represents a problem with this set of intervals?
A) There are too many intervals.
B) The class widths are too small.
C) Some numbers between 28,000 and 40,000 would fall into two different intervals.
D) The first and the second interval overlap.
E) There are too few intervals.
Unlock Deck
Unlock for access to all 95 flashcards in this deck.
Unlock Deck
k this deck
60
Consider the following frequency distribution:
What is the midpoint of the first class?
A) 100
B) 150
C) 25
D) 250
E) 200
What is the midpoint of the first class?
A) 100
B) 150
C) 25
D) 250
E) 200
Unlock Deck
Unlock for access to all 95 flashcards in this deck.
Unlock Deck
k this deck
61
Given two class intervals and their respective frequencies and relative frequencies, the ratio of the frequencies ___ the ratio of the relative frequencies.
A) is less than
B) is the same as
C) is larger than
D) could be less, equal, or larger than
E) less than or equal to
A) is less than
B) is the same as
C) is larger than
D) could be less, equal, or larger than
E) less than or equal to
Unlock Deck
Unlock for access to all 95 flashcards in this deck.
Unlock Deck
k this deck
62
Your company is doing market research to assess the feasibility of a new product. The market research team gathers pricing information of the 60 existing products in the market that would compete with your company's product. The most expensive brand is priced at $22.95, and the least expensive one at $20.59. If the relative frequency of the first class is 0.05 and the cumulative frequency for the second class is 10, then the relative frequency for the second class is
A) 0.05.
B) 0.11.
C) 0.12.
D) 0.17.
E) 1.67.
A) 0.05.
B) 0.11.
C) 0.12.
D) 0.17.
E) 1.67.
Unlock Deck
Unlock for access to all 95 flashcards in this deck.
Unlock Deck
k this deck
63
Each day, the office staff at Oasis Quick Shop prepares a frequency distribution and an ogive of sales transactions by dollar value of the transactions. Saturday's cumulative frequency ogive follows: The percentage of sales transactions on Saturday that were under $100 each was ___.
A) 100
B) 10
C) 80
D) 20
E) 15
The percentage of sales transactions on Saturday that were under $100 each was ___.A) 100
B) 10
C) 80
D) 20
E) 15
Unlock Deck
Unlock for access to all 95 flashcards in this deck.
Unlock Deck
k this deck
64
Scott Brim, Chief Financial Officer of Space Mall, Inc., wants to better understand the biest business hours during the weekend. There are door sensors that approximately count the number of people who enter the mall. The table below presents the average number of people coming in during the weekend, for the last month:
The relative frequency of the fourth class interval is ___.
A) 0.07
B) 0.08
C) 0.14
D) 0.15
E) 0.38
The relative frequency of the fourth class interval is ___.
A) 0.07
B) 0.08
C) 0.14
D) 0.15
E) 0.38
Unlock Deck
Unlock for access to all 95 flashcards in this deck.
Unlock Deck
k this deck
65
Each day, the manager at Jamie's Auto Care Shop prepares a frequency distribution and a histogram of sales transactions by dollar value of the transactions. Friday's histogram follows: On Friday, the approximate number of sales transactions in the 75-under 100 category was ___.
A) 50
B) 100
C) 150
D) 200
E) 60
On Friday, the approximate number of sales transactions in the 75-under 100 category was ___.A) 50
B) 100
C) 150
D) 200
E) 60
Unlock Deck
Unlock for access to all 95 flashcards in this deck.
Unlock Deck
k this deck
66
The class mark is the ___, and it is ___.
A) total number of class intervals in a frequency distribution; usually between 5 and 15
B) range of the observed values; the difference between the max and min values
C) width of the class intervals; approximately equal to the range divided by the number of classes
D) midpoint of each class interval; geometric mean of the class interval endpoints
E) midpoint of each class interval; arithmetic mean of the class interval endpoints
Unlock Deck
Unlock for access to all 95 flashcards in this deck.
Unlock Deck
k this deck
67
Your company is doing market research to assess the feasibility of a new product. The market research team gathers pricing information of all the existing products that would compete with your company's product. The most expensive brand is priced at $22.95, and the least expensive one at $20.59. If a class width of 0.25 is used, then the number of classes will be
A) 9.
B) 9.4.
C) undetermined, so you can choose either 9 or 10.
D) undetermined, so you must choose another class width.
E) 10.
A) 9.
B) 9.4.
C) undetermined, so you can choose either 9 or 10.
D) undetermined, so you must choose another class width.
E) 10.
Unlock Deck
Unlock for access to all 95 flashcards in this deck.
Unlock Deck
k this deck
68
In a frequency distribution, the first class interval begins at 18. The midpoint of the first class interval is 19.5, and the midpoint of the last class interval is 49.5. How many class intervals are there?
A) 11
B) 17
C) 22
D) 33
E) 34
A) 11
B) 17
C) 22
D) 33
E) 34
Unlock Deck
Unlock for access to all 95 flashcards in this deck.
Unlock Deck
k this deck
69
Your company is doing market research to assess the feasibility of a new product. The market research team gathers pricing information of all the existing products that would compete with your company's product. The most expensive brand is priced at $22.95, and the least expensive one at $20.59. If a class width of 0.25 is used, then the class mark of the first class interval will be
A) 20.50.
B) 20.59.
C) 20.63.
D) 21.75.
E) 23.09.
A) 20.50.
B) 20.59.
C) 20.63.
D) 21.75.
E) 23.09.
Unlock Deck
Unlock for access to all 95 flashcards in this deck.
Unlock Deck
k this deck
70
Each day, the office staff at Oasis Quick Shop prepares a frequency distribution and an ogive of sales transactions by dollar value of the transactions. Saturday's cumulative frequency ogive follows: The total number of sales transactions on Saturday was ___.
A) 200
B) 500
C) 300
D) 100
E) 400
The total number of sales transactions on Saturday was ___.A) 200
B) 500
C) 300
D) 100
E) 400
Unlock Deck
Unlock for access to all 95 flashcards in this deck.
Unlock Deck
k this deck
71
The staff of Mr. Wayne Wertz, VP of Operations at Portland Peoples Bank, prepared a cumulative frequency ogive of waiting time for walk-in customers. The percentage of walk-in customers waiting one minute or less was ___.
A) 22%
B) 11%
C) 67%
D) 10%
E) 5%
The percentage of walk-in customers waiting one minute or less was ___.A) 22%
B) 11%
C) 67%
D) 10%
E) 5%
Unlock Deck
Unlock for access to all 95 flashcards in this deck.
Unlock Deck
k this deck
72
In a frequency distribution, the first class interval begins at 18. The midpoint of the first class interval is 19.5, and the last class interval ends at 51. How many class intervals are there?
A) 11
B) 17
C) 22
D) 33
E) 34
A) 11
B) 17
C) 22
D) 33
E) 34
Unlock Deck
Unlock for access to all 95 flashcards in this deck.
Unlock Deck
k this deck
73
The staff of Mr. Wayne Wertz, VP of Operations at Portland Peoples Bank, prepared a frequency histogram of waiting time for drive up ATM customers. Approximately ___ drive up ATM customers waited less than 2 minutes.
A) 20
B) 30
C) 100
D) 180
E) 200
Approximately ___ drive up ATM customers waited less than 2 minutes.A) 20
B) 30
C) 100
D) 180
E) 200
Unlock Deck
Unlock for access to all 95 flashcards in this deck.
Unlock Deck
k this deck
74
The staff of Mr. Wayne Wertz, VP of Operations at Portland Peoples Bank, prepared a cumulative frequency ogive of waiting time for walk-in customers. The percentage of walk-in customers waiting more than 6 minutes was ___.
A) 22%
B) 11%
C) 67%
D) 10%
E) 75%
The percentage of walk-in customers waiting more than 6 minutes was ___.A) 22%
B) 11%
C) 67%
D) 10%
E) 75%
Unlock Deck
Unlock for access to all 95 flashcards in this deck.
Unlock Deck
k this deck
75
Each day, the manager at Jamie's Auto Care prepares a frequency distribution and a histogram of sales transactions by dollar value of the transactions. Friday's histogram follows: On Friday, the approximate number of sales transactions between $150 and $175 was ___.
A) 75
B) 200
C) 300
D) 400
E) 500
On Friday, the approximate number of sales transactions between $150 and $175 was ___.A) 75
B) 200
C) 300
D) 400
E) 500
Unlock Deck
Unlock for access to all 95 flashcards in this deck.
Unlock Deck
k this deck
76
Each day, the office staff at Oasis Quick Shop prepares a frequency distribution and an ogive of sales transactions by dollar value of the transactions. Saturday's cumulative frequency ogive follows: The percentage of sales transactions on Saturday that were at least $100 each was ___.
A) 100
B) 10
C) 80
D) 20
E) 15
The percentage of sales transactions on Saturday that were at least $100 each was ___.A) 100
B) 10
C) 80
D) 20
E) 15
Unlock Deck
Unlock for access to all 95 flashcards in this deck.
Unlock Deck
k this deck
77
Each day, the office staff at Oasis Quick Shop prepares a frequency distribution and an ogive of sales transactions by dollar value of the transactions. Saturday's cumulative frequency ogive follows: The percentage of sales transactions on Saturday that were between $100 and $150 was ___.
A) 20%
B) 40%
C) 60%
D) 80%
E) 10%
The percentage of sales transactions on Saturday that were between $100 and $150 was ___.A) 20%
B) 40%
C) 60%
D) 80%
E) 10%
Unlock Deck
Unlock for access to all 95 flashcards in this deck.
Unlock Deck
k this deck
78
The staff of Mr. Wayne Wertz, VP of Operations at Portland Peoples Bank, prepared a cumulative frequency ogive of waiting time for walk-in customers. The total number of walk-in customers included in the study was ___.
A) 100
B) 250
C) 300
D) 450
E) 500
The total number of walk-in customers included in the study was ___.A) 100
B) 250
C) 300
D) 450
E) 500
Unlock Deck
Unlock for access to all 95 flashcards in this deck.
Unlock Deck
k this deck
79
The staff of Mr. Wayne Wertz, VP of Operations at Portland Peoples Bank, prepared a cumulative frequency ogive of waiting time for walk-in customers. The percentage of walk-in customers waiting between 1 and 6 minutes was ___.
A) 22%
B) 11%
C) 37%
D) 10%
E) 67%
The percentage of walk-in customers waiting between 1 and 6 minutes was ___.A) 22%
B) 11%
C) 37%
D) 10%
E) 67%
Unlock Deck
Unlock for access to all 95 flashcards in this deck.
Unlock Deck
k this deck
80
Pinky Bauer, Chief Financial Officer of Harrison Haulers, Inc., suspects irregularities in the payroll system and orders an inspection of "each and every payroll voucher issued since January 1, 2000." Each payroll voucher was inspected and the following frequency distribution was compiled.
The midpoint of the first class interval is ___.
A) 500
B) 2
C) 1.5
D) 1
E) 250
The midpoint of the first class interval is ___.
A) 500
B) 2
C) 1.5
D) 1
E) 250
Unlock Deck
Unlock for access to all 95 flashcards in this deck.
Unlock Deck
k this deck
Unlock Deck
Unlock for access to all 95 flashcards in this deck.


