Deck 13: Inflation, Unemployment, and Bank of Canada Policy
Full screen (f)
Question
Question
Question
Question
Question
Question
Question
Question
Figure 13.1  Alt text for Figure 13.1: In figure 13.1, a short-run Phillips curve.
Long description for Figure 13.1: The x-axis is labelled, unemployment rate percent, and the y-axis is labelled, inflation rate percent per year.A straight line labelled, Philips curve, begins at the top left corner and slopes down to the end of the x-axis.Point A is plotted half way along the line.Point B is plotted to the right of point A.Point C is plotted is to the left of point A.Point D is plotted above this line, in the left center of the quadrant.Point E is plotted below this line, directly beneath point A.
Refer to Figure 13.1.Suppose that the economy is currently at point A on the short-run Phillips curve in the figure above, and the unemployment rate at A is the natural rate.If the economy was to move to point C, which of the following must be true?
A)The economy is producing a level of GDP equal to potential GDP.
B)Aggregate demand must have decreased.
C)Equilibrium GDP at point C must be above potential GDP.
D)The Bank of Canada conducted contractionary policy to cause the move.
E)The Bank of Canada sold Canada bonds to cause the move.
Alt text for Figure 13.1: In figure 13.1, a short-run Phillips curve.Long description for Figure 13.1: The x-axis is labelled, unemployment rate percent, and the y-axis is labelled, inflation rate percent per year.A straight line labelled, Philips curve, begins at the top left corner and slopes down to the end of the x-axis.Point A is plotted half way along the line.Point B is plotted to the right of point A.Point C is plotted is to the left of point A.Point D is plotted above this line, in the left center of the quadrant.Point E is plotted below this line, directly beneath point A.
Refer to Figure 13.1.Suppose that the economy is currently at point A on the short-run Phillips curve in the figure above, and the unemployment rate at A is the natural rate.If the economy was to move to point C, which of the following must be true?
A)The economy is producing a level of GDP equal to potential GDP.
B)Aggregate demand must have decreased.
C)Equilibrium GDP at point C must be above potential GDP.
D)The Bank of Canada conducted contractionary policy to cause the move.
E)The Bank of Canada sold Canada bonds to cause the move.
Question
Question
Figure 13.1 Alt text for Figure 13.1: In figure 13.1, a short-run Phillips curve.
Long description for Figure 13.1: The x-axis is labelled, unemployment rate percent, and the y-axis is labelled, inflation rate percent per year.A straight line labelled, Philips curve, begins at the top left corner and slopes down to the end of the x-axis.Point A is plotted half way along the line.Point B is plotted to the right of point A.Point C is plotted is to the left of point A.Point D is plotted above this line, in the left center of the quadrant.Point E is plotted below this line, directly beneath point A.
Refer to Figure 13.1.Suppose that the economy is currently at point A, and the unemployment rate at A is the natural rate.What policy would the Bank of Canada pursue if it wanted the economy to move to point B in the long run?
A)Buy Canada bonds.
B)Sell Canada bonds.
C)Raise the discount rate.
D)Decrease the money supply.
E)No policy will move the economy to point B in the long run.
Alt text for Figure 13.1: In figure 13.1, a short-run Phillips curve.Long description for Figure 13.1: The x-axis is labelled, unemployment rate percent, and the y-axis is labelled, inflation rate percent per year.A straight line labelled, Philips curve, begins at the top left corner and slopes down to the end of the x-axis.Point A is plotted half way along the line.Point B is plotted to the right of point A.Point C is plotted is to the left of point A.Point D is plotted above this line, in the left center of the quadrant.Point E is plotted below this line, directly beneath point A.
Refer to Figure 13.1.Suppose that the economy is currently at point A, and the unemployment rate at A is the natural rate.What policy would the Bank of Canada pursue if it wanted the economy to move to point B in the long run?
A)Buy Canada bonds.
B)Sell Canada bonds.
C)Raise the discount rate.
D)Decrease the money supply.
E)No policy will move the economy to point B in the long run.
Question
Question
Question
Question
Question
Figure 13.1 Alt text for Figure 13.1: In figure 13.1, a short-run Phillips curve.
Long description for Figure 13.1: The x-axis is labelled, unemployment rate percent, and the y-axis is labelled, inflation rate percent per year.A straight line labelled, Philips curve, begins at the top left corner and slopes down to the end of the x-axis.Point A is plotted half way along the line.Point B is plotted to the right of point A.Point C is plotted is to the left of point A.Point D is plotted above this line, in the left center of the quadrant.Point E is plotted below this line, directly beneath point A.
Refer to Figure 13.1.Suppose that the economy is currently at point A.If the Bank of Canada engaged in contractionary monetary policy, where would the economy end up in the short run?
A)It would remain at point A.
B)point B
C)point C
D)point D
E)point E
Alt text for Figure 13.1: In figure 13.1, a short-run Phillips curve.Long description for Figure 13.1: The x-axis is labelled, unemployment rate percent, and the y-axis is labelled, inflation rate percent per year.A straight line labelled, Philips curve, begins at the top left corner and slopes down to the end of the x-axis.Point A is plotted half way along the line.Point B is plotted to the right of point A.Point C is plotted is to the left of point A.Point D is plotted above this line, in the left center of the quadrant.Point E is plotted below this line, directly beneath point A.
Refer to Figure 13.1.Suppose that the economy is currently at point A.If the Bank of Canada engaged in contractionary monetary policy, where would the economy end up in the short run?
A)It would remain at point A.
B)point B
C)point C
D)point D
E)point E
Question
Question
Question
Question
Figure 13.1 Alt text for Figure 13.1: In figure 13.1, a short-run Phillips curve.
Long description for Figure 13.1: The x-axis is labelled, unemployment rate percent, and the y-axis is labelled, inflation rate percent per year.A straight line labelled, Philips curve, begins at the top left corner and slopes down to the end of the x-axis.Point A is plotted half way along the line.Point B is plotted to the right of point A.Point C is plotted is to the left of point A.Point D is plotted above this line, in the left center of the quadrant.Point E is plotted below this line, directly beneath point A.
Refer to Figure 13.1.What should the Bank of Canada do if it wants to move from point A to point B in the short-run Phillips curve depicted in the figure above?
A)buy treasury bills
B)sell treasury bills
C)lower the discount rate
D)increase the money supply
E)lower taxes
Alt text for Figure 13.1: In figure 13.1, a short-run Phillips curve.Long description for Figure 13.1: The x-axis is labelled, unemployment rate percent, and the y-axis is labelled, inflation rate percent per year.A straight line labelled, Philips curve, begins at the top left corner and slopes down to the end of the x-axis.Point A is plotted half way along the line.Point B is plotted to the right of point A.Point C is plotted is to the left of point A.Point D is plotted above this line, in the left center of the quadrant.Point E is plotted below this line, directly beneath point A.
Refer to Figure 13.1.What should the Bank of Canada do if it wants to move from point A to point B in the short-run Phillips curve depicted in the figure above?
A)buy treasury bills
B)sell treasury bills
C)lower the discount rate
D)increase the money supply
E)lower taxes
Question
Question
Question
Question
Question
Question
Question
Question
Question
Question
Question
Question
Question
Question
Question
Question
Question
Question
Question
Question
Question
Question
Question
Question
Question
Question
Question
Question
Figure 13.1 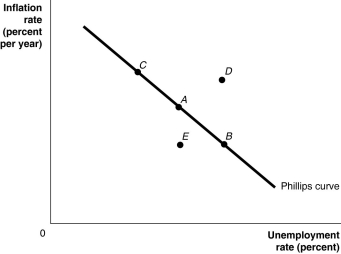 Alt text for Figure 13.1: In figure 13.1, a short-run Phillips curve.
Long description for Figure 13.1: The x-axis is labelled, unemployment rate percent, and the y-axis is labelled, inflation rate percent per year.A straight line labelled, Philips curve, begins at the top left corner and slopes down to the end of the x-axis.Point A is plotted half way along line Philips curve.Point B is plotted to the right of point A and point C is plotted is to the left of point A.Point D is plotted above this line, in the left center of the quadrant.Point E is plotted below this line, directly below point A.
Refer to Figure 13.1. Suppose that the economy is currently at point A.If the Bank of Canada engaged in expansionary monetary policy, where would the economy end up in the short run?
A)It would remain at point A.
B)point B
C)point C
D)point D
E)point E
Alt text for Figure 13.1: In figure 13.1, a short-run Phillips curve.Long description for Figure 13.1: The x-axis is labelled, unemployment rate percent, and the y-axis is labelled, inflation rate percent per year.A straight line labelled, Philips curve, begins at the top left corner and slopes down to the end of the x-axis.Point A is plotted half way along line Philips curve.Point B is plotted to the right of point A and point C is plotted is to the left of point A.Point D is plotted above this line, in the left center of the quadrant.Point E is plotted below this line, directly below point A.
Refer to Figure 13.1. Suppose that the economy is currently at point A.If the Bank of Canada engaged in expansionary monetary policy, where would the economy end up in the short run?
A)It would remain at point A.
B)point B
C)point C
D)point D
E)point E
Question
Figure 13.1 Alt text for Figure 13.1: In figure 13.1, a short-run Phillips curve.
Long description for Figure 13.1: The x-axis is labelled, unemployment rate percent, and the y-axis is labelled, inflation rate percent per year.A straight line labelled, Philips curve, begins at the top left corner and slopes down to the end of the x-axis.Point A is plotted half way along line Philips curve.Point B is plotted to the right of point A and point C is plotted is to the left of point A.Point D is plotted above this line, in the left center of the quadrant.Point E is plotted below this line, directly below point A.
Refer to Figure 13.1.Suppose that the economy is currently at point A on the short-run Phillips curve in the figure above, and the unemployment rate at A is the natural rate.If the economy was to move to point B, which of the following must be true?
A)The economy is producing a level of GDP equal to potential GDP.
B)Aggregate demand must have increased.
C)Equilibrium GDP at point B must be below potential GDP.
D)The Bank of Canada conducted expansionary policy to cause the move.
E)The Bank of Canada purchased government securities to cause the move.
Alt text for Figure 13.1: In figure 13.1, a short-run Phillips curve.Long description for Figure 13.1: The x-axis is labelled, unemployment rate percent, and the y-axis is labelled, inflation rate percent per year.A straight line labelled, Philips curve, begins at the top left corner and slopes down to the end of the x-axis.Point A is plotted half way along line Philips curve.Point B is plotted to the right of point A and point C is plotted is to the left of point A.Point D is plotted above this line, in the left center of the quadrant.Point E is plotted below this line, directly below point A.
Refer to Figure 13.1.Suppose that the economy is currently at point A on the short-run Phillips curve in the figure above, and the unemployment rate at A is the natural rate.If the economy was to move to point B, which of the following must be true?
A)The economy is producing a level of GDP equal to potential GDP.
B)Aggregate demand must have increased.
C)Equilibrium GDP at point B must be below potential GDP.
D)The Bank of Canada conducted expansionary policy to cause the move.
E)The Bank of Canada purchased government securities to cause the move.
Question
Question
Question
Question
Figure 13.1 Alt text for Figure 13.1: In figure 13.1, a short-run Phillips curve.
Long description for Figure 13.1: The x-axis is labelled, unemployment rate percent, and the y-axis is labelled, inflation rate percent per year.A straight line labelled, Philips curve, begins at the top left corner and slopes down to the end of the x-axis.Point A is plotted half way along line Philips curve.Point B is plotted to the right of point A and point C is plotted is to the left of point A.Point D is plotted above this line, in the left center of the quadrant.Point E is plotted below this line, directly below point A.
Refer to Figure 13.1.What should the Bank of Canada do if it wants to move from point A to point C in the short-run Phillips curve depicted in the figure above?
A)buy government securities
B)sell government securities
C)raise the discount rate
D)decrease the money supply
E)raise taxes
Alt text for Figure 13.1: In figure 13.1, a short-run Phillips curve.Long description for Figure 13.1: The x-axis is labelled, unemployment rate percent, and the y-axis is labelled, inflation rate percent per year.A straight line labelled, Philips curve, begins at the top left corner and slopes down to the end of the x-axis.Point A is plotted half way along line Philips curve.Point B is plotted to the right of point A and point C is plotted is to the left of point A.Point D is plotted above this line, in the left center of the quadrant.Point E is plotted below this line, directly below point A.
Refer to Figure 13.1.What should the Bank of Canada do if it wants to move from point A to point C in the short-run Phillips curve depicted in the figure above?
A)buy government securities
B)sell government securities
C)raise the discount rate
D)decrease the money supply
E)raise taxes
Question
Question
Figure 13.1 Alt text for Figure 13.1: In figure 13.1, a short-run Phillips curve.
Long description for Figure 13.1: The x-axis is labelled, unemployment rate percent, and the y-axis is labelled, inflation rate percent per year.A straight line labelled, Philips curve, begins at the top left corner and slopes down to the end of the x-axis.Point A is plotted half way along line Philips curve.Point B is plotted to the right of point A and point C is plotted is to the left of point A.Point D is plotted above this line, in the left center of the quadrant.Point E is plotted below this line, directly below point A.
Refer to Figure 13.1.Suppose that the economy is currently at point A, and the unemployment rate at A is the natural rate.What policy would the Bank of Canada pursue if it wanted the economy to move to point C in the long run?
A)buy government securities
B)sell government securities
C)lower the discount rate
D)increase the money supply
E)No policy will move the economy to point C in the long run.
Alt text for Figure 13.1: In figure 13.1, a short-run Phillips curve.Long description for Figure 13.1: The x-axis is labelled, unemployment rate percent, and the y-axis is labelled, inflation rate percent per year.A straight line labelled, Philips curve, begins at the top left corner and slopes down to the end of the x-axis.Point A is plotted half way along line Philips curve.Point B is plotted to the right of point A and point C is plotted is to the left of point A.Point D is plotted above this line, in the left center of the quadrant.Point E is plotted below this line, directly below point A.
Refer to Figure 13.1.Suppose that the economy is currently at point A, and the unemployment rate at A is the natural rate.What policy would the Bank of Canada pursue if it wanted the economy to move to point C in the long run?
A)buy government securities
B)sell government securities
C)lower the discount rate
D)increase the money supply
E)No policy will move the economy to point C in the long run.
Question
Question
Question
Question
Question
Question
Question
Question
Question
Question
Figure 13.2 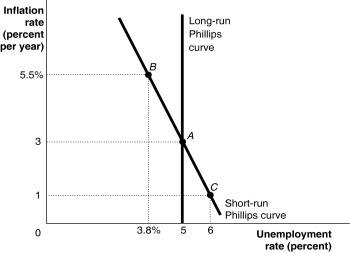 Alt text for Figure 13.2: In figure 13.2, a graph shows the short-run and long-run Phillips curves.
Long description for Figure 13.2: The x-axis is labelled, unemployment rate (percent).The y-axis is labelled, inflation rate (percent per year).3 points; A (5, 3), B (3.8%, 5.5%), C (6, 1)are plotted on the graph.The points are connected to their respective coordinates on the x and y-axes with dotted lines.A straight line labelled, short-run Philips Curve, begins at the top left corner and slopes down to the bottom center, and passes through points A, B, and C.A straight line labelled, long-run Philips Curve, is perpendicular to the x-axis, begins from the x-axis value 5,and intersects the Short-run Philips Curve at point A.
Refer to Figure 13.2.Suppose the economy is at point C.If the Bank of Canada decreases the money supply so that inflation falls, the economy will ________ in the long run, holding all else constant.
A)eventually move to point A
B)eventually move to point B
C)stay at point C
D)move to point A and then back to point B
Alt text for Figure 13.2: In figure 13.2, a graph shows the short-run and long-run Phillips curves.Long description for Figure 13.2: The x-axis is labelled, unemployment rate (percent).The y-axis is labelled, inflation rate (percent per year).3 points; A (5, 3), B (3.8%, 5.5%), C (6, 1)are plotted on the graph.The points are connected to their respective coordinates on the x and y-axes with dotted lines.A straight line labelled, short-run Philips Curve, begins at the top left corner and slopes down to the bottom center, and passes through points A, B, and C.A straight line labelled, long-run Philips Curve, is perpendicular to the x-axis, begins from the x-axis value 5,and intersects the Short-run Philips Curve at point A.
Refer to Figure 13.2.Suppose the economy is at point C.If the Bank of Canada decreases the money supply so that inflation falls, the economy will ________ in the long run, holding all else constant.
A)eventually move to point A
B)eventually move to point B
C)stay at point C
D)move to point A and then back to point B
Question
Figure 13.2 Alt text for Figure 13.2: In figure 13.2, a graph shows the short-run and long-run Phillips curves.
Long description for Figure 13.2: The x-axis is labelled, unemployment rate (percent).The y-axis is labelled, inflation rate (percent per year).3 points; A (5, 3), B (3.8%, 5.5%), C (6, 1)are plotted on the graph.The points are connected to their respective coordinates on the x and y-axes with dotted lines.A straight line labelled, short-run Philips Curve, begins at the top left corner and slopes down to the bottom center, and passes through points A, B, and C.A straight line labelled, long-run Philips Curve, is perpendicular to the x-axis, begins from the x-axis value 5,and intersects the Short-run Philips Curve at point A.
Refer to Figure 13.2.Suppose the economy is at point B.If the Bank of Canada increases the money supply so that inflation increases, the economy will ________ in the short run, holding all else constant.
A)eventually move to point A
B)stay at point B
C)eventually move to point C
D)move to point A and then back to point B
Alt text for Figure 13.2: In figure 13.2, a graph shows the short-run and long-run Phillips curves.Long description for Figure 13.2: The x-axis is labelled, unemployment rate (percent).The y-axis is labelled, inflation rate (percent per year).3 points; A (5, 3), B (3.8%, 5.5%), C (6, 1)are plotted on the graph.The points are connected to their respective coordinates on the x and y-axes with dotted lines.A straight line labelled, short-run Philips Curve, begins at the top left corner and slopes down to the bottom center, and passes through points A, B, and C.A straight line labelled, long-run Philips Curve, is perpendicular to the x-axis, begins from the x-axis value 5,and intersects the Short-run Philips Curve at point A.
Refer to Figure 13.2.Suppose the economy is at point B.If the Bank of Canada increases the money supply so that inflation increases, the economy will ________ in the short run, holding all else constant.
A)eventually move to point A
B)stay at point B
C)eventually move to point C
D)move to point A and then back to point B
Question
Question
Question
Question
Question
Figure 13.2 Alt text for Figure 13.2: In figure 13.2, a graph shows the short-run and long-run Phillips curves.
Long description for Figure 13.2: The x-axis is labelled, unemployment rate (percent).The y-axis is labelled, inflation rate (percent per year).3 points; A (5, 3), B (3.8%, 5.5%), C (6, 1)are plotted on the graph.The points are connected to their respective coordinates on the x and y-axes with dotted lines.A straight line labelled, short-run Philips Curve, begins at the top left corner and slopes down to the bottom center, and passes through points A, B, and C.A straight line labelled, long-run Philips Curve, is perpendicular to the x-axis, begins from the x-axis value 5,and intersects the Short-run Philips Curve at point A.
Refer to Figure 13.2.Suppose the economy is at point A in the figure above.Which of the following is true?
A)The short-run Phillips curve will shift to the right.
B)The short-run Phillips curve will shift to the left.
C)The long-run Phillips curve will shift to the left.
D)Actual inflation and expected inflation are the same.
E)The long-run Phillips curve will shift to the right.
Alt text for Figure 13.2: In figure 13.2, a graph shows the short-run and long-run Phillips curves.Long description for Figure 13.2: The x-axis is labelled, unemployment rate (percent).The y-axis is labelled, inflation rate (percent per year).3 points; A (5, 3), B (3.8%, 5.5%), C (6, 1)are plotted on the graph.The points are connected to their respective coordinates on the x and y-axes with dotted lines.A straight line labelled, short-run Philips Curve, begins at the top left corner and slopes down to the bottom center, and passes through points A, B, and C.A straight line labelled, long-run Philips Curve, is perpendicular to the x-axis, begins from the x-axis value 5,and intersects the Short-run Philips Curve at point A.
Refer to Figure 13.2.Suppose the economy is at point A in the figure above.Which of the following is true?
A)The short-run Phillips curve will shift to the right.
B)The short-run Phillips curve will shift to the left.
C)The long-run Phillips curve will shift to the left.
D)Actual inflation and expected inflation are the same.
E)The long-run Phillips curve will shift to the right.
Question
Question
Figure 13.2 Alt text for Figure 13.2: In figure 13.2, a graph shows the short-run and long-run Phillips curves.
Long description for Figure 13.2: The x-axis is labelled, unemployment rate (percent).The y-axis is labelled, inflation rate (percent per year).3 points; A (5, 3), B (3.8%, 5.5%), C (6, 1)are plotted on the graph.The points are connected to their respective coordinates on the x and y-axes with dotted lines.A straight line labelled, short-run Philips Curve, begins at the top left corner and slopes down to the bottom center, and passes through points A, B, and C.A straight line labelled, long-run Philips Curve, is perpendicular to the x-axis, begins from the x-axis value 5,and intersects the Short-run Philips Curve at point A.
Refer to Figure 13.2.Suppose the economy is at point C in the figure above.If workers adjust their expectations of inflation, which of the following will be true?
A)The short-run Phillips curve will shift to the right.
B)The short-run Phillips curve will shift to the left.
C)The economy will move from C to A.
D)Workers and firms expect inflation to be 1%.
E)The natural rate of unemployment is 6%.
Alt text for Figure 13.2: In figure 13.2, a graph shows the short-run and long-run Phillips curves.Long description for Figure 13.2: The x-axis is labelled, unemployment rate (percent).The y-axis is labelled, inflation rate (percent per year).3 points; A (5, 3), B (3.8%, 5.5%), C (6, 1)are plotted on the graph.The points are connected to their respective coordinates on the x and y-axes with dotted lines.A straight line labelled, short-run Philips Curve, begins at the top left corner and slopes down to the bottom center, and passes through points A, B, and C.A straight line labelled, long-run Philips Curve, is perpendicular to the x-axis, begins from the x-axis value 5,and intersects the Short-run Philips Curve at point A.
Refer to Figure 13.2.Suppose the economy is at point C in the figure above.If workers adjust their expectations of inflation, which of the following will be true?
A)The short-run Phillips curve will shift to the right.
B)The short-run Phillips curve will shift to the left.
C)The economy will move from C to A.
D)Workers and firms expect inflation to be 1%.
E)The natural rate of unemployment is 6%.
Question
Figure 13.2 Alt text for Figure 13.2: In figure 13.2, a graph shows the short-run and long-run Phillips curves.
Long description for Figure 13.2: The x-axis is labelled, unemployment rate (percent).The y-axis is labelled, inflation rate (percent per year).3 points; A (5, 3), B (3.8%, 5.5%), C (6, 1)are plotted on the graph.The points are connected to their respective coordinates on the x and y-axes with dotted lines.A straight line labelled, short-run Philips Curve, begins at the top left corner and slopes down to the bottom center, and passes through points A, B, and C.A straight line labelled, long-run Philips Curve, is perpendicular to the x-axis, begins from the x-axis value 5,and intersects the Short-run Philips Curve at point A.
Refer to Figure 13.2.Suppose the economy is at point A in the figure above.Which of the following is true?
A)The expected rate of inflation is 5.5%.
B)The current unemployment rate is equal to the natural rate of unemployment.
C)The current unemployment rate is 3.8%.
D)Actual inflation is 1%.
E)The economy will move from A to B.
Alt text for Figure 13.2: In figure 13.2, a graph shows the short-run and long-run Phillips curves.Long description for Figure 13.2: The x-axis is labelled, unemployment rate (percent).The y-axis is labelled, inflation rate (percent per year).3 points; A (5, 3), B (3.8%, 5.5%), C (6, 1)are plotted on the graph.The points are connected to their respective coordinates on the x and y-axes with dotted lines.A straight line labelled, short-run Philips Curve, begins at the top left corner and slopes down to the bottom center, and passes through points A, B, and C.A straight line labelled, long-run Philips Curve, is perpendicular to the x-axis, begins from the x-axis value 5,and intersects the Short-run Philips Curve at point A.
Refer to Figure 13.2.Suppose the economy is at point A in the figure above.Which of the following is true?
A)The expected rate of inflation is 5.5%.
B)The current unemployment rate is equal to the natural rate of unemployment.
C)The current unemployment rate is 3.8%.
D)Actual inflation is 1%.
E)The economy will move from A to B.
Question
Figure 13.2 Alt text for Figure 13.2: In figure 13.2, a graph shows the short-run and long-run Phillips curves.
Long description for Figure 13.2: The x-axis is labelled, unemployment rate (percent).The y-axis is labelled, inflation rate (percent per year).3 points; A (5, 3), B (3.8%, 5.5%), C (6, 1)are plotted on the graph.The points are connected to their respective coordinates on the x and y-axes with dotted lines.A straight line labelled, short-run Philips Curve, begins at the top left corner and slopes down to the bottom center, and passes through points A, B, and C.A straight line labelled, long-run Philips Curve, is perpendicular to the x-axis, begins from the x-axis value 5,and intersects the Short-run Philips Curve at point A.
Refer to Figure 13.2.Suppose the economy is at point B in the figure above.Which of the following is true?
A)The expected rate of inflation is 3%.
B)The natural rate of unemployment is 3.8%.
C)The current unemployment rate is 5%.
D)The economy is producing at potential GDP.
E)Expected inflation and actual inflation are the same.
Alt text for Figure 13.2: In figure 13.2, a graph shows the short-run and long-run Phillips curves.Long description for Figure 13.2: The x-axis is labelled, unemployment rate (percent).The y-axis is labelled, inflation rate (percent per year).3 points; A (5, 3), B (3.8%, 5.5%), C (6, 1)are plotted on the graph.The points are connected to their respective coordinates on the x and y-axes with dotted lines.A straight line labelled, short-run Philips Curve, begins at the top left corner and slopes down to the bottom center, and passes through points A, B, and C.A straight line labelled, long-run Philips Curve, is perpendicular to the x-axis, begins from the x-axis value 5,and intersects the Short-run Philips Curve at point A.
Refer to Figure 13.2.Suppose the economy is at point B in the figure above.Which of the following is true?
A)The expected rate of inflation is 3%.
B)The natural rate of unemployment is 3.8%.
C)The current unemployment rate is 5%.
D)The economy is producing at potential GDP.
E)Expected inflation and actual inflation are the same.
Question
Question
Question
Question
Question
Figure 13.2 Alt text for Figure 13.2: In figure 13.2, a graph shows the short-run and long-run Phillips curves.
Long description for Figure 13.2: The x-axis is labelled, unemployment rate (percent).The y-axis is labelled, inflation rate (percent per year).3 points; A (5, 3), B (3.8%, 5.5%), C (6, 1)are plotted on the graph.The points are connected to their respective coordinates on the x and y-axes with dotted lines.A straight line labelled, short-run Philips Curve, begins at the top left corner and slopes down to the bottom center, and passes through points A, B, and C.A straight line labelled, long-run Philips Curve, is perpendicular to the x-axis, begins from the x-axis value 5,and intersects the Short-run Philips Curve at point A.
Refer to Figure 13.2.Suppose the economy is at point A.The Bank of Canada uses expansionary monetary policy to lower the unemployment rate permanently below the level associated with A.Which of the following will occur?
A)Inflation will accelerate in the long run.
B)Inflationary expectations will decline.
C)Unemployment will rise above the natural rate.
D)Unemployment will accelerate in the long run.
E)Inflation will be permanently lower in the long run.
Alt text for Figure 13.2: In figure 13.2, a graph shows the short-run and long-run Phillips curves.Long description for Figure 13.2: The x-axis is labelled, unemployment rate (percent).The y-axis is labelled, inflation rate (percent per year).3 points; A (5, 3), B (3.8%, 5.5%), C (6, 1)are plotted on the graph.The points are connected to their respective coordinates on the x and y-axes with dotted lines.A straight line labelled, short-run Philips Curve, begins at the top left corner and slopes down to the bottom center, and passes through points A, B, and C.A straight line labelled, long-run Philips Curve, is perpendicular to the x-axis, begins from the x-axis value 5,and intersects the Short-run Philips Curve at point A.
Refer to Figure 13.2.Suppose the economy is at point A.The Bank of Canada uses expansionary monetary policy to lower the unemployment rate permanently below the level associated with A.Which of the following will occur?
A)Inflation will accelerate in the long run.
B)Inflationary expectations will decline.
C)Unemployment will rise above the natural rate.
D)Unemployment will accelerate in the long run.
E)Inflation will be permanently lower in the long run.
Question

Unlock Deck
Sign up to unlock the cards in this deck!
Unlock Deck
Unlock Deck
1/265
Play
Full screen (f)
Deck 13: Inflation, Unemployment, and Bank of Canada Policy
1
The curve showing the short-run relationship between the unemployment rate and the inflation rate is called
A)the monetary policy curve.
B)the Phillips curve.
C)the Sargent curve.
D)the unemployment curve.
E)the Keynes' Cross.
A)the monetary policy curve.
B)the Phillips curve.
C)the Sargent curve.
D)the unemployment curve.
E)the Keynes' Cross.
the Phillips curve.
2
Which of the following best explains the negative slope of the short-run Phillips curve?
A)Weak growth in aggregate demand keeps the economy below potential GDP, so unemployment rises but the rate of inflation falls.
B)Aggregate demand grows so quickly that the inflation rate rises as unemployment rises.
C)Long-run aggregate supply increases quickly enough that inflation falls as unemployment also falls.
D)Short-run aggregate supply increases at the same pace as aggregate demand increases so that inflation and unemployment do not change.
E)Strong growth in technology causes the short-run aggregate supply curve to shift rightward faster than aggregate demand, so unemployment falls and the inflation rate falls.
Weak growth in aggregate demand keeps the economy below potential GDP, so unemployment rises but the rate of inflation falls.
3
Gretchen expects the price level to rise from 104 this year to 108 next year, and she is able to incorporate these expectations into her wage contract.If the price level rises to 106 next year instead of 108, which of the following will occur?
A)Gretchen's real wage will be unchanged.
B)Gretchen's real wage will fall.
C)Gretchen's real wage will rise.
D)Gretchen's real wage may rise or fall, depending on the unemployment rate.
E)Gretchen is much less likely to become unemployed.
A)Gretchen's real wage will be unchanged.
B)Gretchen's real wage will fall.
C)Gretchen's real wage will rise.
D)Gretchen's real wage may rise or fall, depending on the unemployment rate.
E)Gretchen is much less likely to become unemployed.
Gretchen's real wage will rise.
4
In the long run, the Phillips curve is a ________ at ________.
A)horizontal line; 0% inflation
B)negatively sloped line; the intersection of aggregate demand and short-run aggregate supply
C)vertical line; the natural rate of unemployment
D)vertical line; the expected rate of inflation
E)positively sloped line; the current rate of GDP growth
A)horizontal line; 0% inflation
B)negatively sloped line; the intersection of aggregate demand and short-run aggregate supply
C)vertical line; the natural rate of unemployment
D)vertical line; the expected rate of inflation
E)positively sloped line; the current rate of GDP growth
Unlock Deck
Unlock for access to all 265 flashcards in this deck.
Unlock Deck
k this deck
5
Employees at the university have negotiated a 5 percent increase in wages for the next year, based on their inflation expectations.If inflation is actually 4 percent over the next year, which of the following will occur?
A)Unemployment of university employees will fall.
B)Real wages for university employees will rise.
C)Inflation will be 5 percent the following year.
D)The decrease in inflation is expected.
E)Employees of the university will be worse off than they expected.
A)Unemployment of university employees will fall.
B)Real wages for university employees will rise.
C)Inflation will be 5 percent the following year.
D)The decrease in inflation is expected.
E)Employees of the university will be worse off than they expected.
Unlock Deck
Unlock for access to all 265 flashcards in this deck.
Unlock Deck
k this deck
6
What is the natural rate of unemployment?
A)the unemployment rate that exists when the economy is at potential GDP
B)the unemployment rate that exists when the economy is at a trough in a business cycle
C)an unemployment rate of 0%
D)any unemployment rate that is above the inflation rate
E)when only cyclical unemployment exists
A)the unemployment rate that exists when the economy is at potential GDP
B)the unemployment rate that exists when the economy is at a trough in a business cycle
C)an unemployment rate of 0%
D)any unemployment rate that is above the inflation rate
E)when only cyclical unemployment exists
Unlock Deck
Unlock for access to all 265 flashcards in this deck.
Unlock Deck
k this deck
7
Based on the current discussions centered on the Bank of Canada's decision to engage in expansionary monetary policy, many economists are concerned that there is a trade-off between
A)monetary policy and unemployment rates.
B)monetary policy and government budget deficits.
C)monetary policy and fiscal policy.
D)monetary policy and household debt.
E)monetary policy and the exchange rate.
A)monetary policy and unemployment rates.
B)monetary policy and government budget deficits.
C)monetary policy and fiscal policy.
D)monetary policy and household debt.
E)monetary policy and the exchange rate.
Unlock Deck
Unlock for access to all 265 flashcards in this deck.
Unlock Deck
k this deck
8
Figure 13.1 Alt text for Figure 13.1: In figure 13.1, a short-run Phillips curve.
Long description for Figure 13.1: The x-axis is labelled, unemployment rate percent, and the y-axis is labelled, inflation rate percent per year.A straight line labelled, Philips curve, begins at the top left corner and slopes down to the end of the x-axis.Point A is plotted half way along the line.Point B is plotted to the right of point A.Point C is plotted is to the left of point A.Point D is plotted above this line, in the left center of the quadrant.Point E is plotted below this line, directly beneath point A.
Refer to Figure 13.1.Suppose that the economy is currently at point A on the short-run Phillips curve in the figure above, and the unemployment rate at A is the natural rate.If the economy was to move to point C, which of the following must be true?
A)The economy is producing a level of GDP equal to potential GDP.
B)Aggregate demand must have decreased.
C)Equilibrium GDP at point C must be above potential GDP.
D)The Bank of Canada conducted contractionary policy to cause the move.
E)The Bank of Canada sold Canada bonds to cause the move.
Alt text for Figure 13.1: In figure 13.1, a short-run Phillips curve.Long description for Figure 13.1: The x-axis is labelled, unemployment rate percent, and the y-axis is labelled, inflation rate percent per year.A straight line labelled, Philips curve, begins at the top left corner and slopes down to the end of the x-axis.Point A is plotted half way along the line.Point B is plotted to the right of point A.Point C is plotted is to the left of point A.Point D is plotted above this line, in the left center of the quadrant.Point E is plotted below this line, directly beneath point A.
Refer to Figure 13.1.Suppose that the economy is currently at point A on the short-run Phillips curve in the figure above, and the unemployment rate at A is the natural rate.If the economy was to move to point C, which of the following must be true?
A)The economy is producing a level of GDP equal to potential GDP.
B)Aggregate demand must have decreased.
C)Equilibrium GDP at point C must be above potential GDP.
D)The Bank of Canada conducted contractionary policy to cause the move.
E)The Bank of Canada sold Canada bonds to cause the move.
Unlock Deck
Unlock for access to all 265 flashcards in this deck.
Unlock Deck
k this deck
9
According to the short-run Phillips curve, which of the following would result in low rates of unemployment?
A)weak increases in aggregate supply
B)a lower inflation rate
C)weak increases in aggregate demand
D)a higher inflation rate
E)strong increases in long-run aggregate supply
A)weak increases in aggregate supply
B)a lower inflation rate
C)weak increases in aggregate demand
D)a higher inflation rate
E)strong increases in long-run aggregate supply
Unlock Deck
Unlock for access to all 265 flashcards in this deck.
Unlock Deck
k this deck
10
Figure 13.1 Alt text for Figure 13.1: In figure 13.1, a short-run Phillips curve.
Long description for Figure 13.1: The x-axis is labelled, unemployment rate percent, and the y-axis is labelled, inflation rate percent per year.A straight line labelled, Philips curve, begins at the top left corner and slopes down to the end of the x-axis.Point A is plotted half way along the line.Point B is plotted to the right of point A.Point C is plotted is to the left of point A.Point D is plotted above this line, in the left center of the quadrant.Point E is plotted below this line, directly beneath point A.
Refer to Figure 13.1.Suppose that the economy is currently at point A, and the unemployment rate at A is the natural rate.What policy would the Bank of Canada pursue if it wanted the economy to move to point B in the long run?
A)Buy Canada bonds.
B)Sell Canada bonds.
C)Raise the discount rate.
D)Decrease the money supply.
E)No policy will move the economy to point B in the long run.
Alt text for Figure 13.1: In figure 13.1, a short-run Phillips curve.Long description for Figure 13.1: The x-axis is labelled, unemployment rate percent, and the y-axis is labelled, inflation rate percent per year.A straight line labelled, Philips curve, begins at the top left corner and slopes down to the end of the x-axis.Point A is plotted half way along the line.Point B is plotted to the right of point A.Point C is plotted is to the left of point A.Point D is plotted above this line, in the left center of the quadrant.Point E is plotted below this line, directly beneath point A.
Refer to Figure 13.1.Suppose that the economy is currently at point A, and the unemployment rate at A is the natural rate.What policy would the Bank of Canada pursue if it wanted the economy to move to point B in the long run?
A)Buy Canada bonds.
B)Sell Canada bonds.
C)Raise the discount rate.
D)Decrease the money supply.
E)No policy will move the economy to point B in the long run.
Unlock Deck
Unlock for access to all 265 flashcards in this deck.
Unlock Deck
k this deck
11
In July 2015, the Bank of Canada reduce its policy rate to 0.5% in an effort to offset the negative effects of oil prices. The major risk associated with this move is
A)an increase in inflation.
B)a drop in the value of the Canadian dollar.
C)household debt will rise to unsustainable levels.
D)firm borrowing will continue to rise.
E)the low interest rates will cause house prices to fall.
A)an increase in inflation.
B)a drop in the value of the Canadian dollar.
C)household debt will rise to unsustainable levels.
D)firm borrowing will continue to rise.
E)the low interest rates will cause house prices to fall.
Unlock Deck
Unlock for access to all 265 flashcards in this deck.
Unlock Deck
k this deck
12
Evidence shows that many people who delay searching for a job for a year or longer after they are laid off
A)find it more difficult to find new employment than if they had searched for a new job soon after they were laid off.
B)find it easier to find new employment than if they had searched for a new job soon after they were laid off.
C)find that they have little to no chance to find new employment after being unemployed for so long.
D)find that the extra unemployment benefits they receive during their extended period of unemployment more than make up for the difficulty in finding a job once they decide to re-enter the workforce.
E)find they are more likely to get a job they like.
Unlock Deck
Unlock for access to all 265 flashcards in this deck.
Unlock Deck
k this deck
13
What is a "structural" relationship?
A)a relationship that depends on the size of firm investments in capital such as buildings and other structures
B)a relationship that depends on the basic behaviour of consumers and firms and remains unchanged over long periods
C)a relationship between any two variables that is temporary
D)any relationship that cannot be anticipated
E)a relationship based on the institutions of the economy
Unlock Deck
Unlock for access to all 265 flashcards in this deck.
Unlock Deck
k this deck
14
If actual inflation is less than expected inflation, which of the following will be true?
A)Real wages will rise.
B)Real wages will fall.
C)The Phillips curve will be a vertical line.
D)The unemployment rate will fall.
E)The aggregate demand curve will become steeper.
A)Real wages will rise.
B)Real wages will fall.
C)The Phillips curve will be a vertical line.
D)The unemployment rate will fall.
E)The aggregate demand curve will become steeper.
Unlock Deck
Unlock for access to all 265 flashcards in this deck.
Unlock Deck
k this deck
15
Figure 13.1 Alt text for Figure 13.1: In figure 13.1, a short-run Phillips curve.
Long description for Figure 13.1: The x-axis is labelled, unemployment rate percent, and the y-axis is labelled, inflation rate percent per year.A straight line labelled, Philips curve, begins at the top left corner and slopes down to the end of the x-axis.Point A is plotted half way along the line.Point B is plotted to the right of point A.Point C is plotted is to the left of point A.Point D is plotted above this line, in the left center of the quadrant.Point E is plotted below this line, directly beneath point A.
Refer to Figure 13.1.Suppose that the economy is currently at point A.If the Bank of Canada engaged in contractionary monetary policy, where would the economy end up in the short run?
A)It would remain at point A.
B)point B
C)point C
D)point D
E)point E
Alt text for Figure 13.1: In figure 13.1, a short-run Phillips curve.Long description for Figure 13.1: The x-axis is labelled, unemployment rate percent, and the y-axis is labelled, inflation rate percent per year.A straight line labelled, Philips curve, begins at the top left corner and slopes down to the end of the x-axis.Point A is plotted half way along the line.Point B is plotted to the right of point A.Point C is plotted is to the left of point A.Point D is plotted above this line, in the left center of the quadrant.Point E is plotted below this line, directly beneath point A.
Refer to Figure 13.1.Suppose that the economy is currently at point A.If the Bank of Canada engaged in contractionary monetary policy, where would the economy end up in the short run?
A)It would remain at point A.
B)point B
C)point C
D)point D
E)point E
Unlock Deck
Unlock for access to all 265 flashcards in this deck.
Unlock Deck
k this deck
16
If the Phillips curve represents a "structural relationship," then
A)the trade-off between unemployment and inflation is permanent.
B)the trade-off between unemployment and inflation holds only for the short run.
C)the trade-off between unemployment and inflation holds in the long run, but not in the short run.
D)the Phillips curve will be vertical in the long run.
E)there will be no trade-off between unemployment and inflation.
Unlock Deck
Unlock for access to all 265 flashcards in this deck.
Unlock Deck
k this deck
17
Employees at the university have negotiated a 5 percent increase in wages for the next year, based on their inflation expectations.If inflation is actually 6 percent over the next year, which of the following will occur?
A)Unemployment of university employees will rise.
B)Real wages for university employees will fall.
C)Inflation will be 5 percent the following year.
D)The increase in inflation is expected.
E)Employees of the university will be better off than they expected.
A)Unemployment of university employees will rise.
B)Real wages for university employees will fall.
C)Inflation will be 5 percent the following year.
D)The increase in inflation is expected.
E)Employees of the university will be better off than they expected.
Unlock Deck
Unlock for access to all 265 flashcards in this deck.
Unlock Deck
k this deck
18
According to the short-run Phillips curve, the unemployment rate and the inflation rate are
A)unrelated.
B)positively related.
C)negatively related.
D)unaffected by monetary policy.
A)unrelated.
B)positively related.
C)negatively related.
D)unaffected by monetary policy.
Unlock Deck
Unlock for access to all 265 flashcards in this deck.
Unlock Deck
k this deck
19
Figure 13.1 Alt text for Figure 13.1: In figure 13.1, a short-run Phillips curve.
Long description for Figure 13.1: The x-axis is labelled, unemployment rate percent, and the y-axis is labelled, inflation rate percent per year.A straight line labelled, Philips curve, begins at the top left corner and slopes down to the end of the x-axis.Point A is plotted half way along the line.Point B is plotted to the right of point A.Point C is plotted is to the left of point A.Point D is plotted above this line, in the left center of the quadrant.Point E is plotted below this line, directly beneath point A.
Refer to Figure 13.1.What should the Bank of Canada do if it wants to move from point A to point B in the short-run Phillips curve depicted in the figure above?
A)buy treasury bills
B)sell treasury bills
C)lower the discount rate
D)increase the money supply
E)lower taxes
Alt text for Figure 13.1: In figure 13.1, a short-run Phillips curve.Long description for Figure 13.1: The x-axis is labelled, unemployment rate percent, and the y-axis is labelled, inflation rate percent per year.A straight line labelled, Philips curve, begins at the top left corner and slopes down to the end of the x-axis.Point A is plotted half way along the line.Point B is plotted to the right of point A.Point C is plotted is to the left of point A.Point D is plotted above this line, in the left center of the quadrant.Point E is plotted below this line, directly beneath point A.
Refer to Figure 13.1.What should the Bank of Canada do if it wants to move from point A to point B in the short-run Phillips curve depicted in the figure above?
A)buy treasury bills
B)sell treasury bills
C)lower the discount rate
D)increase the money supply
E)lower taxes
Unlock Deck
Unlock for access to all 265 flashcards in this deck.
Unlock Deck
k this deck
20
According to the short-run Phillips curve, if unemployment is 3.2% and inflation is 1.3%, an increase in the inflation rate might result in which of the following?
A)an increase in the unemployment rate to 3.4%
B)a decrease in the unemployment rate to 3.0%
C)a decrease in the demand for labour in the economy
D)a return to the original inflation rate of 1.3%
E)permanently higher inflation and an unemployment rate of 3.2%
A)an increase in the unemployment rate to 3.4%
B)a decrease in the unemployment rate to 3.0%
C)a decrease in the demand for labour in the economy
D)a return to the original inflation rate of 1.3%
E)permanently higher inflation and an unemployment rate of 3.2%
Unlock Deck
Unlock for access to all 265 flashcards in this deck.
Unlock Deck
k this deck
21
Matt's real wage in 2017 is $26.80.If the price level is 104, what is Matt's nominal wage?
A)$30.80
B)$27.87
C)$26.80
D)$25.77
A)$30.80
B)$27.87
C)$26.80
D)$25.77
Unlock Deck
Unlock for access to all 265 flashcards in this deck.
Unlock Deck
k this deck
22
In 2017 the small country of Notrealia had a price level of 149.35. In 2016 the price level was 145. If the average Notrealian earns a wage of $29 an hour in 2017. What is their real wage?
A)$25.04
B)$29.87
C)$43.31
D)$20.00
E)$28.13
A)$25.04
B)$29.87
C)$43.31
D)$20.00
E)$28.13
Unlock Deck
Unlock for access to all 265 flashcards in this deck.
Unlock Deck
k this deck
23
An increase in the inflation rate increases employment only if the increase in inflation is unexpected.
Unlock Deck
Unlock for access to all 265 flashcards in this deck.
Unlock Deck
k this deck
24
Ceteris paribus, in the short run following a decrease in the rate of growth in Aggregate Demand, we would expect to see an increase in the rate of unemployment and a decrease in the rate of inflation.
Unlock Deck
Unlock for access to all 265 flashcards in this deck.
Unlock Deck
k this deck
25
The natural rate of unemployment is the rate that exists when the economy is producing at potential GDP.
Unlock Deck
Unlock for access to all 265 flashcards in this deck.
Unlock Deck
k this deck
26
When will an increase in aggregate demand not result in lower unemployment rates in the short run?
Unlock Deck
Unlock for access to all 265 flashcards in this deck.
Unlock Deck
k this deck
27
A higher inflation rate can lead to lower unemployment if ________ mistakenly expect the inflation rate to be lower than it turns out to be.
A)workers, but not employers
B)employers, but not workers
C)both workers and employers
D)neither workers nor employers
E)government, but not banks
A)workers, but not employers
B)employers, but not workers
C)both workers and employers
D)neither workers nor employers
E)government, but not banks
Unlock Deck
Unlock for access to all 265 flashcards in this deck.
Unlock Deck
k this deck
28
If actual inflation is less than expected inflation, actual real wages will be ________ expected real wages and unemployment will ________.
A)greater than; rise
B)greater than; fall
C)less than; rise
D)less than; fall
E)equal to; remain constant
A)greater than; rise
B)greater than; fall
C)less than; rise
D)less than; fall
E)equal to; remain constant
Unlock Deck
Unlock for access to all 265 flashcards in this deck.
Unlock Deck
k this deck
29
The price level in the economy between 2017 and 2018 rose from 130 to 135.Between 2018 and 2019, the price level rose from 135 to 140.19.How does the short-run Phillips curve predict the unemployment rate will change as a result?
A)The unemployment rate will decrease since inflation decreased.
B)The unemployment rate will decrease since inflation increased.
C)The unemployment rate will increase since inflation increased.
D)The unemployment rate would not change since there is no change in the rate of inflation.
E)The unemployment rate would increase since inflation decreased.
Unlock Deck
Unlock for access to all 265 flashcards in this deck.
Unlock Deck
k this deck
30
Workers at a local mining company are paid $25.60 per hour, and they have incorporated a 3 percent annual raise in their contracts to account for expected inflation.Explain how unexpected inflation of 5 percent will affect the real wage and the unemployment rate.
Unlock Deck
Unlock for access to all 265 flashcards in this deck.
Unlock Deck
k this deck
31
Evidence shows that for many people, delaying searching for a job for a year or longer after they are laid off will contribute to a deterioration of their job skills, making it harder for them to find employment.This deterioration in job skills and the subsequent retraining that is necessary to obtain employment relates to which type of unemployment?
A)cyclical
B)frictional
C)seasonal
D)structural
E)natural
A)cyclical
B)frictional
C)seasonal
D)structural
E)natural
Unlock Deck
Unlock for access to all 265 flashcards in this deck.
Unlock Deck
k this deck
32
If the rate of inflation in the economy is steady at 5 percent per year, how does the short-run Phillips curve predict that the unemployment rate will be changing, if at all? Does your answer change if inflation in the economy is 0 percent? Illustrate your answer with a Phillips curve.
Unlock Deck
Unlock for access to all 265 flashcards in this deck.
Unlock Deck
k this deck
33
The key to understanding the short-run trade-off behind the Phillips curve is that an increase in inflation will decrease unemployment if the inflation is ________ by both workers and firms.
A)unexpected
B)expected
C)perfectly predicted
D)ignored
E)undetected
A)unexpected
B)expected
C)perfectly predicted
D)ignored
E)undetected
Unlock Deck
Unlock for access to all 265 flashcards in this deck.
Unlock Deck
k this deck
34
Does the short-run Phillips curve have a positive or negative slope? Explain how this slope is derived.
Unlock Deck
Unlock for access to all 265 flashcards in this deck.
Unlock Deck
k this deck
35
If workers accurately predict the rate of inflation, is there a short-run trade-off between inflation and unemployment, as predicted by the Phillips curve? Why or why not?
Unlock Deck
Unlock for access to all 265 flashcards in this deck.
Unlock Deck
k this deck
36
A study conducted by Robert Shiller, a Yale Economist, found that a large majority of the public thinks that increases in inflation will not quickly lead to an increase in wages.
Unlock Deck
Unlock for access to all 265 flashcards in this deck.
Unlock Deck
k this deck
37
In the ________, A.W.Phillips plotted data for Great Britain that revealed a relationship between rates of change in wages versus unemployment rates.Economists later discovered other "Phillips curve" relationships between rates of inflation versus unemployment rates.
A)1880s
B)1930s
C)1940s
D)1950s
E)1960s
A)1880s
B)1930s
C)1940s
D)1950s
E)1960s
Unlock Deck
Unlock for access to all 265 flashcards in this deck.
Unlock Deck
k this deck
38
If workers and firms expect that inflation will be 3 percent next year, and real wages are not changing over time, by how much will nominal wages increase?
A)3 percent
B)more than 3 percent
C)less than 3 percent
D)the real wage rate divided by the expected inflation rate
E)depends on actual inflation for next year
A)3 percent
B)more than 3 percent
C)less than 3 percent
D)the real wage rate divided by the expected inflation rate
E)depends on actual inflation for next year
Unlock Deck
Unlock for access to all 265 flashcards in this deck.
Unlock Deck
k this deck
39
Canadians have loaded up on debt to historic levels; per capita debt is over 165 percent of disposable income, mirroring that of the United States prior to the subprime financial crisis.The primary cause for this is
A)the historically low interest rates the Bank of Canada has maintained to speed up recovery following the "Great Recession."
B)the reduced regulations around borrowing in Canada.
C)all-time high levels of disposable income.
D)the availability of government securities, like Canada Savings Bonds.
E)falling incomes of the middle class.
Unlock Deck
Unlock for access to all 265 flashcards in this deck.
Unlock Deck
k this deck
40
If the long-run aggregate supply curve is vertical,
A)the economy stays at the natural rate of inflation in the long run.
B)the short-run Phillips curve must be vertical.
C)unemployment and inflation are positively related in the long run.
D)the trade-off between unemployment and inflation cannot be permanent.
E)any changes in the unemployment rate will be permanent.
Unlock Deck
Unlock for access to all 265 flashcards in this deck.
Unlock Deck
k this deck
41
The curve showing the short-run relationship between ________ and the ________ is called the Phillips curve.
A)nominal interest rate; real interest rate
B)the unemployment rate; the inflation rate
C)price level; real GDP
D)exchange rate; real interest rate
E)the interest rate; government budget deficits
A)nominal interest rate; real interest rate
B)the unemployment rate; the inflation rate
C)price level; real GDP
D)exchange rate; real interest rate
E)the interest rate; government budget deficits
Unlock Deck
Unlock for access to all 265 flashcards in this deck.
Unlock Deck
k this deck
42
If actual inflation is greater than expected inflation,
A)real wages rise.
B)real wages fall.
C)the Phillips curve is a vertical line.
D)the unemployment rate rises.
E)there is a transfer from borrowers to lenders.
A)real wages rise.
B)real wages fall.
C)the Phillips curve is a vertical line.
D)the unemployment rate rises.
E)there is a transfer from borrowers to lenders.
Unlock Deck
Unlock for access to all 265 flashcards in this deck.
Unlock Deck
k this deck
43
All other factors held constant, increased growth in aggregate demand will
A)increase inflation.
B)reduce unemployment.
C)move the economy to a higher point on the short-run Phillips curve.
D)All of the above are correct.
A)increase inflation.
B)reduce unemployment.
C)move the economy to a higher point on the short-run Phillips curve.
D)All of the above are correct.
Unlock Deck
Unlock for access to all 265 flashcards in this deck.
Unlock Deck
k this deck
44
The price level in the economy between 2010 and 2011 rose from 100 to 110.Between 2011 and 2012, the price level rose from 110 to 121.How would the short-run Phillips curve predict the unemployment rate would change as a result?
A)The unemployment rate would decrease since inflation decreased.
B)The unemployment rate would decrease since inflation increased.
C)The unemployment rate would increase since inflation increased.
D)The unemployment rate will initially rise and then fall as inflation rises and falls.
E)The unemployment rate would not change since there is no change in the rate of inflation.
Unlock Deck
Unlock for access to all 265 flashcards in this deck.
Unlock Deck
k this deck
45
In a graph of unemployment rates (on the horizontal axis)versus inflation rates (on the vertical axis), the short-run Phillips Curve is
A)downward sloping.
B)horizontal.
C)vertical.
D)upward sloping.
A)downward sloping.
B)horizontal.
C)vertical.
D)upward sloping.
Unlock Deck
Unlock for access to all 265 flashcards in this deck.
Unlock Deck
k this deck
46
Employees at the hospital have negotiated a 3 percent increase in wages for the next year, based on their inflation expectations.If inflation is actually 5 percent over the next year, which of the following will occur?
A)Unemployment of hospital employees will rise.
B)Real wages for hospital employees will fall.
C)Inflation will be 3 percent the following year.
D)The increase in inflation is expected.
E)Employees will be better off than they expected.
A)Unemployment of hospital employees will rise.
B)Real wages for hospital employees will fall.
C)Inflation will be 3 percent the following year.
D)The increase in inflation is expected.
E)Employees will be better off than they expected.
Unlock Deck
Unlock for access to all 265 flashcards in this deck.
Unlock Deck
k this deck
47
Figure 13.1 Alt text for Figure 13.1: In figure 13.1, a short-run Phillips curve.
Long description for Figure 13.1: The x-axis is labelled, unemployment rate percent, and the y-axis is labelled, inflation rate percent per year.A straight line labelled, Philips curve, begins at the top left corner and slopes down to the end of the x-axis.Point A is plotted half way along line Philips curve.Point B is plotted to the right of point A and point C is plotted is to the left of point A.Point D is plotted above this line, in the left center of the quadrant.Point E is plotted below this line, directly below point A.
Refer to Figure 13.1. Suppose that the economy is currently at point A.If the Bank of Canada engaged in expansionary monetary policy, where would the economy end up in the short run?
A)It would remain at point A.
B)point B
C)point C
D)point D
E)point E
Alt text for Figure 13.1: In figure 13.1, a short-run Phillips curve.Long description for Figure 13.1: The x-axis is labelled, unemployment rate percent, and the y-axis is labelled, inflation rate percent per year.A straight line labelled, Philips curve, begins at the top left corner and slopes down to the end of the x-axis.Point A is plotted half way along line Philips curve.Point B is plotted to the right of point A and point C is plotted is to the left of point A.Point D is plotted above this line, in the left center of the quadrant.Point E is plotted below this line, directly below point A.
Refer to Figure 13.1. Suppose that the economy is currently at point A.If the Bank of Canada engaged in expansionary monetary policy, where would the economy end up in the short run?
A)It would remain at point A.
B)point B
C)point C
D)point D
E)point E
Unlock Deck
Unlock for access to all 265 flashcards in this deck.
Unlock Deck
k this deck
48
Figure 13.1 Alt text for Figure 13.1: In figure 13.1, a short-run Phillips curve.
Long description for Figure 13.1: The x-axis is labelled, unemployment rate percent, and the y-axis is labelled, inflation rate percent per year.A straight line labelled, Philips curve, begins at the top left corner and slopes down to the end of the x-axis.Point A is plotted half way along line Philips curve.Point B is plotted to the right of point A and point C is plotted is to the left of point A.Point D is plotted above this line, in the left center of the quadrant.Point E is plotted below this line, directly below point A.
Refer to Figure 13.1.Suppose that the economy is currently at point A on the short-run Phillips curve in the figure above, and the unemployment rate at A is the natural rate.If the economy was to move to point B, which of the following must be true?
A)The economy is producing a level of GDP equal to potential GDP.
B)Aggregate demand must have increased.
C)Equilibrium GDP at point B must be below potential GDP.
D)The Bank of Canada conducted expansionary policy to cause the move.
E)The Bank of Canada purchased government securities to cause the move.
Alt text for Figure 13.1: In figure 13.1, a short-run Phillips curve.Long description for Figure 13.1: The x-axis is labelled, unemployment rate percent, and the y-axis is labelled, inflation rate percent per year.A straight line labelled, Philips curve, begins at the top left corner and slopes down to the end of the x-axis.Point A is plotted half way along line Philips curve.Point B is plotted to the right of point A and point C is plotted is to the left of point A.Point D is plotted above this line, in the left center of the quadrant.Point E is plotted below this line, directly below point A.
Refer to Figure 13.1.Suppose that the economy is currently at point A on the short-run Phillips curve in the figure above, and the unemployment rate at A is the natural rate.If the economy was to move to point B, which of the following must be true?
A)The economy is producing a level of GDP equal to potential GDP.
B)Aggregate demand must have increased.
C)Equilibrium GDP at point B must be below potential GDP.
D)The Bank of Canada conducted expansionary policy to cause the move.
E)The Bank of Canada purchased government securities to cause the move.
Unlock Deck
Unlock for access to all 265 flashcards in this deck.
Unlock Deck
k this deck
49
Assume weak growth in aggregate demand keeps the economy below potential GDP, so unemployment rises but inflation falls.This explains the ________ slope of the short-run Phillips curve.
A)positive
B)negative
C)zero
D)infinite
A)positive
B)negative
C)zero
D)infinite
Unlock Deck
Unlock for access to all 265 flashcards in this deck.
Unlock Deck
k this deck
50
According to the ________ Phillips curve(s), the unemployment rate and the inflation rate are negatively related.
A)long-run
B)short-run
C)long-run and short-run
D)rational expectations
E)aggregate
A)long-run
B)short-run
C)long-run and short-run
D)rational expectations
E)aggregate
Unlock Deck
Unlock for access to all 265 flashcards in this deck.
Unlock Deck
k this deck
51
Shondra's real wage in 2012 is $18.50.If the price level is 106, what is Shondra's nominal wage?
A)$19.61
B)$18.61
C)$18.50
D)$17.44
E)$16.50
A)$19.61
B)$18.61
C)$18.50
D)$17.44
E)$16.50
Unlock Deck
Unlock for access to all 265 flashcards in this deck.
Unlock Deck
k this deck
52
Figure 13.1 Alt text for Figure 13.1: In figure 13.1, a short-run Phillips curve.
Long description for Figure 13.1: The x-axis is labelled, unemployment rate percent, and the y-axis is labelled, inflation rate percent per year.A straight line labelled, Philips curve, begins at the top left corner and slopes down to the end of the x-axis.Point A is plotted half way along line Philips curve.Point B is plotted to the right of point A and point C is plotted is to the left of point A.Point D is plotted above this line, in the left center of the quadrant.Point E is plotted below this line, directly below point A.
Refer to Figure 13.1.What should the Bank of Canada do if it wants to move from point A to point C in the short-run Phillips curve depicted in the figure above?
A)buy government securities
B)sell government securities
C)raise the discount rate
D)decrease the money supply
E)raise taxes
Alt text for Figure 13.1: In figure 13.1, a short-run Phillips curve.Long description for Figure 13.1: The x-axis is labelled, unemployment rate percent, and the y-axis is labelled, inflation rate percent per year.A straight line labelled, Philips curve, begins at the top left corner and slopes down to the end of the x-axis.Point A is plotted half way along line Philips curve.Point B is plotted to the right of point A and point C is plotted is to the left of point A.Point D is plotted above this line, in the left center of the quadrant.Point E is plotted below this line, directly below point A.
Refer to Figure 13.1.What should the Bank of Canada do if it wants to move from point A to point C in the short-run Phillips curve depicted in the figure above?
A)buy government securities
B)sell government securities
C)raise the discount rate
D)decrease the money supply
E)raise taxes
Unlock Deck
Unlock for access to all 265 flashcards in this deck.
Unlock Deck
k this deck
53
According to the short-run Phillips curve, which of the following would result in high rates of unemployment?
A)strong increases in short-run aggregate supply
B)a lower inflation rate
C)strong increases in aggregate demand
D)a higher inflation rate
E)strong increases in long-run aggregate supply
A)strong increases in short-run aggregate supply
B)a lower inflation rate
C)strong increases in aggregate demand
D)a higher inflation rate
E)strong increases in long-run aggregate supply
Unlock Deck
Unlock for access to all 265 flashcards in this deck.
Unlock Deck
k this deck
54
Figure 13.1 Alt text for Figure 13.1: In figure 13.1, a short-run Phillips curve.
Long description for Figure 13.1: The x-axis is labelled, unemployment rate percent, and the y-axis is labelled, inflation rate percent per year.A straight line labelled, Philips curve, begins at the top left corner and slopes down to the end of the x-axis.Point A is plotted half way along line Philips curve.Point B is plotted to the right of point A and point C is plotted is to the left of point A.Point D is plotted above this line, in the left center of the quadrant.Point E is plotted below this line, directly below point A.
Refer to Figure 13.1.Suppose that the economy is currently at point A, and the unemployment rate at A is the natural rate.What policy would the Bank of Canada pursue if it wanted the economy to move to point C in the long run?
A)buy government securities
B)sell government securities
C)lower the discount rate
D)increase the money supply
E)No policy will move the economy to point C in the long run.
Alt text for Figure 13.1: In figure 13.1, a short-run Phillips curve.Long description for Figure 13.1: The x-axis is labelled, unemployment rate percent, and the y-axis is labelled, inflation rate percent per year.A straight line labelled, Philips curve, begins at the top left corner and slopes down to the end of the x-axis.Point A is plotted half way along line Philips curve.Point B is plotted to the right of point A and point C is plotted is to the left of point A.Point D is plotted above this line, in the left center of the quadrant.Point E is plotted below this line, directly below point A.
Refer to Figure 13.1.Suppose that the economy is currently at point A, and the unemployment rate at A is the natural rate.What policy would the Bank of Canada pursue if it wanted the economy to move to point C in the long run?
A)buy government securities
B)sell government securities
C)lower the discount rate
D)increase the money supply
E)No policy will move the economy to point C in the long run.
Unlock Deck
Unlock for access to all 265 flashcards in this deck.
Unlock Deck
k this deck
55
What is the natural rate of unemployment?
A)the unemployment rate that exists when the economy is at potential GDP
B)the unemployment rate that exists when the economy is at a trough in a business cycle
C)an unemployment rate of 0%
D)any unemployment rate that is above the inflation rate
E)the unemployment rate that occurs when frictional unemployment is 0%
Unlock Deck
Unlock for access to all 265 flashcards in this deck.
Unlock Deck
k this deck
56
If workers and firms expect that inflation will be 5 percent next year, and real wages are not changing over time, by how much will nominal wages increase?
A)5 percent
B)more than 5 percent
C)less than 5 percent
D)depends on actual inflation for next year
A)5 percent
B)more than 5 percent
C)less than 5 percent
D)depends on actual inflation for next year
Unlock Deck
Unlock for access to all 265 flashcards in this deck.
Unlock Deck
k this deck
57
A relationship that depends on the basic behaviour of consumers and firms and remains unchanged over long periods is called a ________ relationship.
A)frictional
B)structural
C)cyclical
D)dynamic
E)transitory
A)frictional
B)structural
C)cyclical
D)dynamic
E)transitory
Unlock Deck
Unlock for access to all 265 flashcards in this deck.
Unlock Deck
k this deck
58
According to the short-run Phillips curve, if unemployment is 2.4% and inflation is 3.7%, a decrease in the inflation rate might result in which of the following?
A)an increase in the unemployment rate to 3.4%
B)a decrease in the unemployment rate to 3.0%
C)a decrease in the demand for labour in the economy
D)an increase in inflation to 3.9%
E)Both A and C are correct answers.
A)an increase in the unemployment rate to 3.4%
B)a decrease in the unemployment rate to 3.0%
C)a decrease in the demand for labour in the economy
D)an increase in inflation to 3.9%
E)Both A and C are correct answers.
Unlock Deck
Unlock for access to all 265 flashcards in this deck.
Unlock Deck
k this deck
59
Alejandro expects the price level to rise from 105 this year to 108 next year.If the price level rises to 110 next year instead of 108, which of the following will occur?
A)Alejandro's real wage will remain unchanged.
B)Alejandro's real wage will fall.
C)Alejandro's real wage will rise.
D)Alejandro's real wage may rise or fall, depending on the unemployment rate.
A)Alejandro's real wage will remain unchanged.
B)Alejandro's real wage will fall.
C)Alejandro's real wage will rise.
D)Alejandro's real wage may rise or fall, depending on the unemployment rate.
Unlock Deck
Unlock for access to all 265 flashcards in this deck.
Unlock Deck
k this deck
60
If the Phillips curve represents a "________ relationship," then the trade-off between unemployment and inflation is permanent.
A)structural
B)frictional
C)cyclical
D)dynamic
E)stochastic
A)structural
B)frictional
C)cyclical
D)dynamic
E)stochastic
Unlock Deck
Unlock for access to all 265 flashcards in this deck.
Unlock Deck
k this deck
61
Ceteris paribus, in the short run following an increase in the rate of growth in aggregate demand, we would expect to see an increase in the rate of inflation and an increase in the rate of unemployment.
Unlock Deck
Unlock for access to all 265 flashcards in this deck.
Unlock Deck
k this deck
62
Workers at a local construction company are paid $32.50 per hour, and they have incorporated a 4 percent annual raise in their contracts to account for expected inflation.Explain how unexpected inflation of 2 percent will affect the real wages earned by these workers and the unemployment rate of these workers.
Unlock Deck
Unlock for access to all 265 flashcards in this deck.
Unlock Deck
k this deck
63
The expansionary monetary and fiscal policies of the 1960s resulted in
A)high inflation rates and high rates of unemployment.
B)low inflation rates and low rates of unemployment.
C)low inflation rates and high rates of unemployment.
D)high inflation rates and low rates of unemployment.
A)high inflation rates and high rates of unemployment.
B)low inflation rates and low rates of unemployment.
C)low inflation rates and high rates of unemployment.
D)high inflation rates and low rates of unemployment.
Unlock Deck
Unlock for access to all 265 flashcards in this deck.
Unlock Deck
k this deck
64
Figure 13.2 Alt text for Figure 13.2: In figure 13.2, a graph shows the short-run and long-run Phillips curves.
Long description for Figure 13.2: The x-axis is labelled, unemployment rate (percent).The y-axis is labelled, inflation rate (percent per year).3 points; A (5, 3), B (3.8%, 5.5%), C (6, 1)are plotted on the graph.The points are connected to their respective coordinates on the x and y-axes with dotted lines.A straight line labelled, short-run Philips Curve, begins at the top left corner and slopes down to the bottom center, and passes through points A, B, and C.A straight line labelled, long-run Philips Curve, is perpendicular to the x-axis, begins from the x-axis value 5,and intersects the Short-run Philips Curve at point A.
Refer to Figure 13.2.Suppose the economy is at point C.If the Bank of Canada decreases the money supply so that inflation falls, the economy will ________ in the long run, holding all else constant.
A)eventually move to point A
B)eventually move to point B
C)stay at point C
D)move to point A and then back to point B
Alt text for Figure 13.2: In figure 13.2, a graph shows the short-run and long-run Phillips curves.Long description for Figure 13.2: The x-axis is labelled, unemployment rate (percent).The y-axis is labelled, inflation rate (percent per year).3 points; A (5, 3), B (3.8%, 5.5%), C (6, 1)are plotted on the graph.The points are connected to their respective coordinates on the x and y-axes with dotted lines.A straight line labelled, short-run Philips Curve, begins at the top left corner and slopes down to the bottom center, and passes through points A, B, and C.A straight line labelled, long-run Philips Curve, is perpendicular to the x-axis, begins from the x-axis value 5,and intersects the Short-run Philips Curve at point A.
Refer to Figure 13.2.Suppose the economy is at point C.If the Bank of Canada decreases the money supply so that inflation falls, the economy will ________ in the long run, holding all else constant.
A)eventually move to point A
B)eventually move to point B
C)stay at point C
D)move to point A and then back to point B
Unlock Deck
Unlock for access to all 265 flashcards in this deck.
Unlock Deck
k this deck
65
Figure 13.2 Alt text for Figure 13.2: In figure 13.2, a graph shows the short-run and long-run Phillips curves.
Long description for Figure 13.2: The x-axis is labelled, unemployment rate (percent).The y-axis is labelled, inflation rate (percent per year).3 points; A (5, 3), B (3.8%, 5.5%), C (6, 1)are plotted on the graph.The points are connected to their respective coordinates on the x and y-axes with dotted lines.A straight line labelled, short-run Philips Curve, begins at the top left corner and slopes down to the bottom center, and passes through points A, B, and C.A straight line labelled, long-run Philips Curve, is perpendicular to the x-axis, begins from the x-axis value 5,and intersects the Short-run Philips Curve at point A.
Refer to Figure 13.2.Suppose the economy is at point B.If the Bank of Canada increases the money supply so that inflation increases, the economy will ________ in the short run, holding all else constant.
A)eventually move to point A
B)stay at point B
C)eventually move to point C
D)move to point A and then back to point B
Alt text for Figure 13.2: In figure 13.2, a graph shows the short-run and long-run Phillips curves.Long description for Figure 13.2: The x-axis is labelled, unemployment rate (percent).The y-axis is labelled, inflation rate (percent per year).3 points; A (5, 3), B (3.8%, 5.5%), C (6, 1)are plotted on the graph.The points are connected to their respective coordinates on the x and y-axes with dotted lines.A straight line labelled, short-run Philips Curve, begins at the top left corner and slopes down to the bottom center, and passes through points A, B, and C.A straight line labelled, long-run Philips Curve, is perpendicular to the x-axis, begins from the x-axis value 5,and intersects the Short-run Philips Curve at point A.
Refer to Figure 13.2.Suppose the economy is at point B.If the Bank of Canada increases the money supply so that inflation increases, the economy will ________ in the short run, holding all else constant.
A)eventually move to point A
B)stay at point B
C)eventually move to point C
D)move to point A and then back to point B
Unlock Deck
Unlock for access to all 265 flashcards in this deck.
Unlock Deck
k this deck
66
If changes in inflation are higher than expected,
A)the short-run Phillips curve will be positively sloped, but not vertical.
B)the short-run Phillips curve will be negatively sloped.
C)the short-run Phillips curve will be vertical.
D)the long-run Phillips curve will be negative sloped.
E)the short-run Phillips curve will be horizontal.
A)the short-run Phillips curve will be positively sloped, but not vertical.
B)the short-run Phillips curve will be negatively sloped.
C)the short-run Phillips curve will be vertical.
D)the long-run Phillips curve will be negative sloped.
E)the short-run Phillips curve will be horizontal.
Unlock Deck
Unlock for access to all 265 flashcards in this deck.
Unlock Deck
k this deck
67
In the 1960s, many economists and policymakers believed the trade-off between inflation and unemployment was permanent.
Unlock Deck
Unlock for access to all 265 flashcards in this deck.
Unlock Deck
k this deck
68
What action should the Bank of Canada take if it wants to move from a point on the short-run Phillips curve representing low unemployment and high inflation to a point representing higher unemployment and lower inflation?
Unlock Deck
Unlock for access to all 265 flashcards in this deck.
Unlock Deck
k this deck
69
Robert Shiller posed the following question to workers: "Imagine that next year the inflation rate unexpectedly doubles.How long would it probably take, in these times, before your income is increased enough so that you can afford the same things as you do today?" Shiller found that ________ percent of the workers he interviewed reported that it would take several years to restore the purchasing power of their wages or that this power would never be restored.
A)25
B)42
C)64
D)81
E)95
A)25
B)42
C)64
D)81
E)95
Unlock Deck
Unlock for access to all 265 flashcards in this deck.
Unlock Deck
k this deck
70
Figure 13.2 Alt text for Figure 13.2: In figure 13.2, a graph shows the short-run and long-run Phillips curves.
Long description for Figure 13.2: The x-axis is labelled, unemployment rate (percent).The y-axis is labelled, inflation rate (percent per year).3 points; A (5, 3), B (3.8%, 5.5%), C (6, 1)are plotted on the graph.The points are connected to their respective coordinates on the x and y-axes with dotted lines.A straight line labelled, short-run Philips Curve, begins at the top left corner and slopes down to the bottom center, and passes through points A, B, and C.A straight line labelled, long-run Philips Curve, is perpendicular to the x-axis, begins from the x-axis value 5,and intersects the Short-run Philips Curve at point A.
Refer to Figure 13.2.Suppose the economy is at point A in the figure above.Which of the following is true?
A)The short-run Phillips curve will shift to the right.
B)The short-run Phillips curve will shift to the left.
C)The long-run Phillips curve will shift to the left.
D)Actual inflation and expected inflation are the same.
E)The long-run Phillips curve will shift to the right.
Alt text for Figure 13.2: In figure 13.2, a graph shows the short-run and long-run Phillips curves.Long description for Figure 13.2: The x-axis is labelled, unemployment rate (percent).The y-axis is labelled, inflation rate (percent per year).3 points; A (5, 3), B (3.8%, 5.5%), C (6, 1)are plotted on the graph.The points are connected to their respective coordinates on the x and y-axes with dotted lines.A straight line labelled, short-run Philips Curve, begins at the top left corner and slopes down to the bottom center, and passes through points A, B, and C.A straight line labelled, long-run Philips Curve, is perpendicular to the x-axis, begins from the x-axis value 5,and intersects the Short-run Philips Curve at point A.
Refer to Figure 13.2.Suppose the economy is at point A in the figure above.Which of the following is true?
A)The short-run Phillips curve will shift to the right.
B)The short-run Phillips curve will shift to the left.
C)The long-run Phillips curve will shift to the left.
D)Actual inflation and expected inflation are the same.
E)The long-run Phillips curve will shift to the right.
Unlock Deck
Unlock for access to all 265 flashcards in this deck.
Unlock Deck
k this deck
71
If actual inflation is greater than expected inflation, what is the relationship between the actual real wage and the expected real wage?
A)The actual real wage will be lower than the expected real wage.
B)The actual real wage will be higher than the expected real wage.
C)The actual real wage will be equal to the expected real wage.
D)The relationship between the actual real wage and the expected real wage cannot be predicted.
A)The actual real wage will be lower than the expected real wage.
B)The actual real wage will be higher than the expected real wage.
C)The actual real wage will be equal to the expected real wage.
D)The relationship between the actual real wage and the expected real wage cannot be predicted.
Unlock Deck
Unlock for access to all 265 flashcards in this deck.
Unlock Deck
k this deck
72
Figure 13.2 Alt text for Figure 13.2: In figure 13.2, a graph shows the short-run and long-run Phillips curves.
Long description for Figure 13.2: The x-axis is labelled, unemployment rate (percent).The y-axis is labelled, inflation rate (percent per year).3 points; A (5, 3), B (3.8%, 5.5%), C (6, 1)are plotted on the graph.The points are connected to their respective coordinates on the x and y-axes with dotted lines.A straight line labelled, short-run Philips Curve, begins at the top left corner and slopes down to the bottom center, and passes through points A, B, and C.A straight line labelled, long-run Philips Curve, is perpendicular to the x-axis, begins from the x-axis value 5,and intersects the Short-run Philips Curve at point A.
Refer to Figure 13.2.Suppose the economy is at point C in the figure above.If workers adjust their expectations of inflation, which of the following will be true?
A)The short-run Phillips curve will shift to the right.
B)The short-run Phillips curve will shift to the left.
C)The economy will move from C to A.
D)Workers and firms expect inflation to be 1%.
E)The natural rate of unemployment is 6%.
Alt text for Figure 13.2: In figure 13.2, a graph shows the short-run and long-run Phillips curves.Long description for Figure 13.2: The x-axis is labelled, unemployment rate (percent).The y-axis is labelled, inflation rate (percent per year).3 points; A (5, 3), B (3.8%, 5.5%), C (6, 1)are plotted on the graph.The points are connected to their respective coordinates on the x and y-axes with dotted lines.A straight line labelled, short-run Philips Curve, begins at the top left corner and slopes down to the bottom center, and passes through points A, B, and C.A straight line labelled, long-run Philips Curve, is perpendicular to the x-axis, begins from the x-axis value 5,and intersects the Short-run Philips Curve at point A.
Refer to Figure 13.2.Suppose the economy is at point C in the figure above.If workers adjust their expectations of inflation, which of the following will be true?
A)The short-run Phillips curve will shift to the right.
B)The short-run Phillips curve will shift to the left.
C)The economy will move from C to A.
D)Workers and firms expect inflation to be 1%.
E)The natural rate of unemployment is 6%.
Unlock Deck
Unlock for access to all 265 flashcards in this deck.
Unlock Deck
k this deck
73
Figure 13.2 Alt text for Figure 13.2: In figure 13.2, a graph shows the short-run and long-run Phillips curves.
Long description for Figure 13.2: The x-axis is labelled, unemployment rate (percent).The y-axis is labelled, inflation rate (percent per year).3 points; A (5, 3), B (3.8%, 5.5%), C (6, 1)are plotted on the graph.The points are connected to their respective coordinates on the x and y-axes with dotted lines.A straight line labelled, short-run Philips Curve, begins at the top left corner and slopes down to the bottom center, and passes through points A, B, and C.A straight line labelled, long-run Philips Curve, is perpendicular to the x-axis, begins from the x-axis value 5,and intersects the Short-run Philips Curve at point A.
Refer to Figure 13.2.Suppose the economy is at point A in the figure above.Which of the following is true?
A)The expected rate of inflation is 5.5%.
B)The current unemployment rate is equal to the natural rate of unemployment.
C)The current unemployment rate is 3.8%.
D)Actual inflation is 1%.
E)The economy will move from A to B.
Alt text for Figure 13.2: In figure 13.2, a graph shows the short-run and long-run Phillips curves.Long description for Figure 13.2: The x-axis is labelled, unemployment rate (percent).The y-axis is labelled, inflation rate (percent per year).3 points; A (5, 3), B (3.8%, 5.5%), C (6, 1)are plotted on the graph.The points are connected to their respective coordinates on the x and y-axes with dotted lines.A straight line labelled, short-run Philips Curve, begins at the top left corner and slopes down to the bottom center, and passes through points A, B, and C.A straight line labelled, long-run Philips Curve, is perpendicular to the x-axis, begins from the x-axis value 5,and intersects the Short-run Philips Curve at point A.
Refer to Figure 13.2.Suppose the economy is at point A in the figure above.Which of the following is true?
A)The expected rate of inflation is 5.5%.
B)The current unemployment rate is equal to the natural rate of unemployment.
C)The current unemployment rate is 3.8%.
D)Actual inflation is 1%.
E)The economy will move from A to B.
Unlock Deck
Unlock for access to all 265 flashcards in this deck.
Unlock Deck
k this deck
74
Figure 13.2 Alt text for Figure 13.2: In figure 13.2, a graph shows the short-run and long-run Phillips curves.
Long description for Figure 13.2: The x-axis is labelled, unemployment rate (percent).The y-axis is labelled, inflation rate (percent per year).3 points; A (5, 3), B (3.8%, 5.5%), C (6, 1)are plotted on the graph.The points are connected to their respective coordinates on the x and y-axes with dotted lines.A straight line labelled, short-run Philips Curve, begins at the top left corner and slopes down to the bottom center, and passes through points A, B, and C.A straight line labelled, long-run Philips Curve, is perpendicular to the x-axis, begins from the x-axis value 5,and intersects the Short-run Philips Curve at point A.
Refer to Figure 13.2.Suppose the economy is at point B in the figure above.Which of the following is true?
A)The expected rate of inflation is 3%.
B)The natural rate of unemployment is 3.8%.
C)The current unemployment rate is 5%.
D)The economy is producing at potential GDP.
E)Expected inflation and actual inflation are the same.
Alt text for Figure 13.2: In figure 13.2, a graph shows the short-run and long-run Phillips curves.Long description for Figure 13.2: The x-axis is labelled, unemployment rate (percent).The y-axis is labelled, inflation rate (percent per year).3 points; A (5, 3), B (3.8%, 5.5%), C (6, 1)are plotted on the graph.The points are connected to their respective coordinates on the x and y-axes with dotted lines.A straight line labelled, short-run Philips Curve, begins at the top left corner and slopes down to the bottom center, and passes through points A, B, and C.A straight line labelled, long-run Philips Curve, is perpendicular to the x-axis, begins from the x-axis value 5,and intersects the Short-run Philips Curve at point A.
Refer to Figure 13.2.Suppose the economy is at point B in the figure above.Which of the following is true?
A)The expected rate of inflation is 3%.
B)The natural rate of unemployment is 3.8%.
C)The current unemployment rate is 5%.
D)The economy is producing at potential GDP.
E)Expected inflation and actual inflation are the same.
Unlock Deck
Unlock for access to all 265 flashcards in this deck.
Unlock Deck
k this deck
75
When will a decrease in aggregate demand not result in a lower inflation rate in the short run?
Unlock Deck
Unlock for access to all 265 flashcards in this deck.
Unlock Deck
k this deck
76
If the unemployment rate in the economy is steady at 4 percent per year, how does the short-run Phillips curve predict that the inflation rate will be changing, if at all? What will happen if the unemployment rate now rises to 7 percent per year? Assume there are no changes to inflation expectations.Provide an appropriate graph to support your discussion.
Unlock Deck
Unlock for access to all 265 flashcards in this deck.
Unlock Deck
k this deck
77
In an effort to discover whether or not workers understand inflation, economist Robert Shiller conducted a survey.When asked about the effect of general inflation on their wages or salary, the most popular response coming from workers was:
A)"My wages usually catch up to rising prices within a year."
B)"The price increase will create extra profit for my employer....There will be no affect on my pay."
C)"My wages have always increased by more than the rate of inflation."
D)"The price increase will force my employer to reduce my pay."
E)None of the above is correct.
Unlock Deck
Unlock for access to all 265 flashcards in this deck.
Unlock Deck
k this deck
78
In a survey, Robert Shiller found that most workers believe that an increase in inflation will lead quickly to an increase in wages.
Unlock Deck
Unlock for access to all 265 flashcards in this deck.
Unlock Deck
k this deck
79
Figure 13.2 Alt text for Figure 13.2: In figure 13.2, a graph shows the short-run and long-run Phillips curves.
Long description for Figure 13.2: The x-axis is labelled, unemployment rate (percent).The y-axis is labelled, inflation rate (percent per year).3 points; A (5, 3), B (3.8%, 5.5%), C (6, 1)are plotted on the graph.The points are connected to their respective coordinates on the x and y-axes with dotted lines.A straight line labelled, short-run Philips Curve, begins at the top left corner and slopes down to the bottom center, and passes through points A, B, and C.A straight line labelled, long-run Philips Curve, is perpendicular to the x-axis, begins from the x-axis value 5,and intersects the Short-run Philips Curve at point A.
Refer to Figure 13.2.Suppose the economy is at point A.The Bank of Canada uses expansionary monetary policy to lower the unemployment rate permanently below the level associated with A.Which of the following will occur?
A)Inflation will accelerate in the long run.
B)Inflationary expectations will decline.
C)Unemployment will rise above the natural rate.
D)Unemployment will accelerate in the long run.
E)Inflation will be permanently lower in the long run.
Alt text for Figure 13.2: In figure 13.2, a graph shows the short-run and long-run Phillips curves.Long description for Figure 13.2: The x-axis is labelled, unemployment rate (percent).The y-axis is labelled, inflation rate (percent per year).3 points; A (5, 3), B (3.8%, 5.5%), C (6, 1)are plotted on the graph.The points are connected to their respective coordinates on the x and y-axes with dotted lines.A straight line labelled, short-run Philips Curve, begins at the top left corner and slopes down to the bottom center, and passes through points A, B, and C.A straight line labelled, long-run Philips Curve, is perpendicular to the x-axis, begins from the x-axis value 5,and intersects the Short-run Philips Curve at point A.
Refer to Figure 13.2.Suppose the economy is at point A.The Bank of Canada uses expansionary monetary policy to lower the unemployment rate permanently below the level associated with A.Which of the following will occur?
A)Inflation will accelerate in the long run.
B)Inflationary expectations will decline.
C)Unemployment will rise above the natural rate.
D)Unemployment will accelerate in the long run.
E)Inflation will be permanently lower in the long run.
Unlock Deck
Unlock for access to all 265 flashcards in this deck.
Unlock Deck
k this deck
80
If the actual rate of inflation exceeds the expected rate of inflation, the actual real wage is greater than the expected real wage and unemployment falls.
Unlock Deck
Unlock for access to all 265 flashcards in this deck.
Unlock Deck
k this deck
Unlock Deck
Unlock for access to all 265 flashcards in this deck.


