Deck 18: A: Waiting-Line Analysis
Full screen (f)
Question
Question
Question
Question
Question
Question
Question
Question
Question
Question
Question
Question
Question
Question
Question
Question
Question
Question
Question
Question
Question
Question
Question
Question
Question
Question
Question
Question
Question
Question
Question
Question
Question
Question
Question
Question
Question
Question
Question
Question
Question
Question
Question
Question
Question
Question
Question
Question
Question
Question
Question
Question
Question
Question
Question
Question
Question
Question
Question
Question
Question
Question
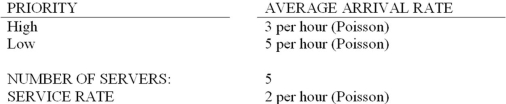
The following questions refer to this data for a multiple server, priority service queuing model:
What is the overall average arrival rate?
What is the overall average arrival rate?
Question
The following questions refer to this data for a multiple server, priority service queuing model:
What is the average number of high priority items waiting in line for service?
What is the average number of high priority items waiting in line for service?
Question
Question
Question
Question
The following questions refer to this data for a multiple server, priority service queuing model:
What is server utilization?
What is server utilization?
Question
The following questions refer to this data for a multiple server, priority service queuing model:
What is the average number of low priority items waiting in line for service?
What is the average number of low priority items waiting in line for service?
Question
Question
The following questions refer to this data for a multiple server, priority service queuing model:
What is average time in line for a low priority item?
What is average time in line for a low priority item?
Question
The following questions refer to this data for a multiple server, priority service queuing model:
What is the average number of all items waiting in line for service?
What is the average number of all items waiting in line for service?
Question
The following questions refer to this data for a multiple server, priority service queuing model:
What is average time in line for a high priority item?
What is average time in line for a high priority item?
Question
The following questions refer to this data for a multiple server, priority service queuing model:
What is average time in the system for a high priority item?
What is average time in the system for a high priority item?
Question
The following questions refer to this data for a multiple server, priority service queuing model:
What is average time in the system for a low priority item?
What is average time in the system for a low priority item?
Question
Question

Unlock Deck
Sign up to unlock the cards in this deck!
Unlock Deck
Unlock Deck
1/76
Play
Full screen (f)
Deck 18: A: Waiting-Line Analysis
1
For a server that already has a high utilization ratio,decreasing service capacity will only have a negligible effect on customer waiting time.
False
2
Total queuing system costs are always minimized at the point where the costs of customers waiting are equal to the service capacity costs.
False
3
Having separate lines for customers that are heterogeneous (different needs)can reduce the variability of service times.
True
4
The cost of having customers wait has to be balanced with the cost of providing service capacity.
Unlock Deck
Unlock for access to all 76 flashcards in this deck.
Unlock Deck
k this deck
5
In waiting-line analysis,queue discipline refers to the willingness of customers to wait in line for service.
Unlock Deck
Unlock for access to all 76 flashcards in this deck.
Unlock Deck
k this deck
6
In a single-server system,the utilization is equal to the average arrival rate divided by the average service rate.
Unlock Deck
Unlock for access to all 76 flashcards in this deck.
Unlock Deck
k this deck
7
Average service rate is the reciprocal of the average service time.
Unlock Deck
Unlock for access to all 76 flashcards in this deck.
Unlock Deck
k this deck
8
A multiple server system assumes that each server will have its own waiting line.
Unlock Deck
Unlock for access to all 76 flashcards in this deck.
Unlock Deck
k this deck
9
The goal of queuing analysis is to minimize the cost of customers having to wait.
Unlock Deck
Unlock for access to all 76 flashcards in this deck.
Unlock Deck
k this deck
10
In an infinite source model,the average number being served is equal to the ratio of the average arrival rate to the average service rate.
Unlock Deck
Unlock for access to all 76 flashcards in this deck.
Unlock Deck
k this deck
11
A system has one service facility that on an average can service 10 customers per hour.The customers arrive at a variable rate,which averages 6 per hour.In this circumstance,no waiting lines will form.
Unlock Deck
Unlock for access to all 76 flashcards in this deck.
Unlock Deck
k this deck
12
The cost of customers waiting is always greater than the cost of increasing service capacity.
Unlock Deck
Unlock for access to all 76 flashcards in this deck.
Unlock Deck
k this deck
13
Waiting lines occur even in underloaded systems because of variability in service rates and/or arrival rates.
Unlock Deck
Unlock for access to all 76 flashcards in this deck.
Unlock Deck
k this deck
14
The most commonly used queuing models assume an arrival rate can be described by a Poisson distribution.
Unlock Deck
Unlock for access to all 76 flashcards in this deck.
Unlock Deck
k this deck
15
Queuing models discussed in the text pertain only to stable conditions.Stable conditions exist only when customers arrive at a constant rate; that is,without any variability.
Unlock Deck
Unlock for access to all 76 flashcards in this deck.
Unlock Deck
k this deck
16
The goal of queuing analysis is to minimize the length of customer waiting lines.
Unlock Deck
Unlock for access to all 76 flashcards in this deck.
Unlock Deck
k this deck
17
In an infinite source model,the server utilization is the ratio of the average arrival rate to the service capacity.
Unlock Deck
Unlock for access to all 76 flashcards in this deck.
Unlock Deck
k this deck
18
The most commonly used queuing models assume a service rate that follows an exponential distribution.
Unlock Deck
Unlock for access to all 76 flashcards in this deck.
Unlock Deck
k this deck
19
Typically customers will perceive waiting times to be less if the line continues to move.
Unlock Deck
Unlock for access to all 76 flashcards in this deck.
Unlock Deck
k this deck
20
If customers are homogeneous (similar needs),then separate waiting lines for each server are preferable.
Unlock Deck
Unlock for access to all 76 flashcards in this deck.
Unlock Deck
k this deck
21
Infinite-source queuing models assume average arrival and service rates are stable.
Unlock Deck
Unlock for access to all 76 flashcards in this deck.
Unlock Deck
k this deck
22
A queuing system has four work stations with three workers to staff each station.To analyze this system,the number of "servers" is:
A) 3
B) 4
C) 7
D) 12
E) 1
A) 3
B) 4
C) 7
D) 12
E) 1
Unlock Deck
Unlock for access to all 76 flashcards in this deck.
Unlock Deck
k this deck
23
Infinite source queuing models basically apply only to underloaded systems in which waiting lines can form.
Unlock Deck
Unlock for access to all 76 flashcards in this deck.
Unlock Deck
k this deck
24
A basic difference between infinite source and finite source queuing models is:
A) the number of servers.
B) the average waiting time.
C) the average arrival rate.
D) the potential number of customers.
E) the processing rate.
A) the number of servers.
B) the average waiting time.
C) the average arrival rate.
D) the potential number of customers.
E) the processing rate.
Unlock Deck
Unlock for access to all 76 flashcards in this deck.
Unlock Deck
k this deck
25
All infinite source queuing models require the server utilization to be less than 1.0.
Unlock Deck
Unlock for access to all 76 flashcards in this deck.
Unlock Deck
k this deck
26
If a manager increases server utilization (assuming no change in the customer arrival rate)what happens to the customer waiting time?
A) It increases exponentially.
B) It increases proportionally.
C) It decreases proportionally.
D) It decreases exponentially.
E) There is no change in the time.
A) It increases exponentially.
B) It increases proportionally.
C) It decreases proportionally.
D) It decreases exponentially.
E) There is no change in the time.
Unlock Deck
Unlock for access to all 76 flashcards in this deck.
Unlock Deck
k this deck
27
The reciprocal of the average rate of arrivals is the average interarrival time.
Unlock Deck
Unlock for access to all 76 flashcards in this deck.
Unlock Deck
k this deck
28
The finite-source queuing model is appropriate when the potential calling population is relatively small.
Unlock Deck
Unlock for access to all 76 flashcards in this deck.
Unlock Deck
k this deck
29
The multiple server queuing table cannot be applied to single server systems.
Unlock Deck
Unlock for access to all 76 flashcards in this deck.
Unlock Deck
k this deck
30
A single phase queuing system is one which has a single:
A) type of customer (homogeneous).
B) server.
C) customer being served.
D) operational step.
E) time all customers wait.
A) type of customer (homogeneous).
B) server.
C) customer being served.
D) operational step.
E) time all customers wait.
Unlock Deck
Unlock for access to all 76 flashcards in this deck.
Unlock Deck
k this deck
31
All of the following are characteristics of the waiting line system that affect the choice of the queuing model EXCEPT:
A) potential number of customers.
B) order of service (queue discipline).
C) cost of service.
D) arrival and service patterns.
E) number of servers.
A) potential number of customers.
B) order of service (queue discipline).
C) cost of service.
D) arrival and service patterns.
E) number of servers.
Unlock Deck
Unlock for access to all 76 flashcards in this deck.
Unlock Deck
k this deck
32
Compared to a single server system with exponential service time,a single server system with a constant service time causes a reduction of 50 percent in the average number waiting in line.
Unlock Deck
Unlock for access to all 76 flashcards in this deck.
Unlock Deck
k this deck
33
Compared to a single server system with exponential service time,the same system with a constant service time will have an average of one-half the number of customers waiting in the system.
Unlock Deck
Unlock for access to all 76 flashcards in this deck.
Unlock Deck
k this deck
34
Which of the following is not a disadvantage of a single line for a multiple server queuing system?
A) It might appear too long for customers.
B) It increases average wait time for customers.
C) It may take up too much space.
D) Customers can't choose their favourite server.
E) Servers may not work as fast as if they were responsible for their own line.
A) It might appear too long for customers.
B) It increases average wait time for customers.
C) It may take up too much space.
D) Customers can't choose their favourite server.
E) Servers may not work as fast as if they were responsible for their own line.
Unlock Deck
Unlock for access to all 76 flashcards in this deck.
Unlock Deck
k this deck
35
The term "queue discipline" refers to:
A) the willingness of customers to wait in line for service.
B) having multiple waiting lines without customers switching from line to line.
C) the order in which customers are served.
D) the reason waiting occurs in underutilized systems.
E) none of these.
A) the willingness of customers to wait in line for service.
B) having multiple waiting lines without customers switching from line to line.
C) the order in which customers are served.
D) the reason waiting occurs in underutilized systems.
E) none of these.
Unlock Deck
Unlock for access to all 76 flashcards in this deck.
Unlock Deck
k this deck
36
The goal of queuing analysis is to minimize:
A) the sum of customer waiting costs and costs of providing capacity.
B) the sum of customer waiting time and service time.
C) costs of providing capacity.
D) customer waiting time.
E) none of the choices.
A) the sum of customer waiting costs and costs of providing capacity.
B) the sum of customer waiting time and service time.
C) costs of providing capacity.
D) customer waiting time.
E) none of the choices.
Unlock Deck
Unlock for access to all 76 flashcards in this deck.
Unlock Deck
k this deck
37
Why is there waiting in a queue even if the service capacity exceeds the average demand on the system ?
A) Poor scheduling
B) Slow service
C) Low utilization
D) Variability in arrival and service rates
E) Multiple phase processing
A) Poor scheduling
B) Slow service
C) Low utilization
D) Variability in arrival and service rates
E) Multiple phase processing
Unlock Deck
Unlock for access to all 76 flashcards in this deck.
Unlock Deck
k this deck
38
In an infinite source model,the average time in line is equal to the average number of customers in line divided by the average arrival rate.
Unlock Deck
Unlock for access to all 76 flashcards in this deck.
Unlock Deck
k this deck
39
A single server queuing system has an average service time of eight minutes and an average time between arrivals of 10 minutes.The average arrival rate is:
A) 6 per hour.
B) 7.5 per hour.
C) 8 per hour.
D) 10 per hour.
E) 12.5 per hour.
A) 6 per hour.
B) 7.5 per hour.
C) 8 per hour.
D) 10 per hour.
E) 12.5 per hour.
Unlock Deck
Unlock for access to all 76 flashcards in this deck.
Unlock Deck
k this deck
40
A major difference between the finite and infinite source queuing models is that the customer arrival rate in a finite situation is dependent on the length of the waiting line.
Unlock Deck
Unlock for access to all 76 flashcards in this deck.
Unlock Deck
k this deck
41
A multiple server queuing system with a Poisson arrival rate and exponential service time has an average arrival rate of 4 customers per hour and an average service time of 18 minutes per customer.The minimum number of servers required to avoid an overloaded system is:
A) 1
B) 2
C) 3
D) 4
E) 5
A) 1
B) 2
C) 3
D) 4
E) 5
Unlock Deck
Unlock for access to all 76 flashcards in this deck.
Unlock Deck
k this deck
42
By how much would the average time in the system increase if only two tellers were on duty?
A) approx. 4 minutes
B) approx. 10 minutes
C) approx. 6 minutes
D) The lines would become infinitely long.
E) It is impossible to say without more information.
A) approx. 4 minutes
B) approx. 10 minutes
C) approx. 6 minutes
D) The lines would become infinitely long.
E) It is impossible to say without more information.
Unlock Deck
Unlock for access to all 76 flashcards in this deck.
Unlock Deck
k this deck
43
Which one of the following measures of system performance is a key measure?
A) The average number of customers waiting in line.
B) The average time customers wait in line.
C) The average time customers are in the system.
D) The average number of customers in the system.
E) The probability that an arrival will have to wait for service.
A) The average number of customers waiting in line.
B) The average time customers wait in line.
C) The average time customers are in the system.
D) The average number of customers in the system.
E) The probability that an arrival will have to wait for service.
Unlock Deck
Unlock for access to all 76 flashcards in this deck.
Unlock Deck
k this deck
44
What is the expected average number of cars in the system?
A) approx. 2.6
B) approx. 5.0
C) approx. 2.3
D) approx. 1.8
E) approx. 4.2
A) approx. 2.6
B) approx. 5.0
C) approx. 2.3
D) approx. 1.8
E) approx. 4.2
Unlock Deck
Unlock for access to all 76 flashcards in this deck.
Unlock Deck
k this deck
45
A multiple server system has customers arriving at an average rate of five per hour and an average service time of forty minutes.The minimum number of servers for this system to be underloaded is:
A) 2
B) 3
C) 4
D) 5
E) none of these
A) 2
B) 3
C) 4
D) 5
E) none of these
Unlock Deck
Unlock for access to all 76 flashcards in this deck.
Unlock Deck
k this deck
46
Which of the following is not an assumption of an infinite source,multiple servers with priority queuing model?
A) Poisson arrival rates
B) Poisson service rates
C) Customers are processed in order of arrival.
D) Customers wait in a single line.
E) A unit with a low priority could conceivably wait a rather long time for processing.
A) Poisson arrival rates
B) Poisson service rates
C) Customers are processed in order of arrival.
D) Customers wait in a single line.
E) A unit with a low priority could conceivably wait a rather long time for processing.
Unlock Deck
Unlock for access to all 76 flashcards in this deck.
Unlock Deck
k this deck
47
For infinite source models,which of the following will equal the average time a customer is in the system?
I)Average number in the system divided by the arrival rate
II)Average number in the system multiplied by the arrival rate
III)Average time in line plus average service time
A) I only
B) II only
C) I and III
D) II and III
E) III only
I)Average number in the system divided by the arrival rate
II)Average number in the system multiplied by the arrival rate
III)Average time in line plus average service time
A) I only
B) II only
C) I and III
D) II and III
E) III only
Unlock Deck
Unlock for access to all 76 flashcards in this deck.
Unlock Deck
k this deck
48
The basic multiple-server-with-priority queuing model assumes that:
A) arrival rates are exponentially distributed.
B) service times are Poisson distributed.
C) items are serviced in order of arrival.
D) items are serviced in order of priority class.
E) service activities are pre-emptive.
A) arrival rates are exponentially distributed.
B) service times are Poisson distributed.
C) items are serviced in order of arrival.
D) items are serviced in order of priority class.
E) service activities are pre-emptive.
Unlock Deck
Unlock for access to all 76 flashcards in this deck.
Unlock Deck
k this deck
49
What is the average machine downtime with two operators?
A) 1.71 minutes
B) 3.46 minutes
C) 6.25 minutes
D) 7.71 minutes
E) 9.46 minutes
A) 1.71 minutes
B) 3.46 minutes
C) 6.25 minutes
D) 7.71 minutes
E) 9.46 minutes
Unlock Deck
Unlock for access to all 76 flashcards in this deck.
Unlock Deck
k this deck
50
Which of these would increase server utilization?
A) An increase in the average service rate.
B) An increase in average arrival rate.
C) An increase in the number of servers.
D) A decrease in service time.
E) All will increase the system utilization.
A) An increase in the average service rate.
B) An increase in average arrival rate.
C) An increase in the number of servers.
D) A decrease in service time.
E) All will increase the system utilization.
Unlock Deck
Unlock for access to all 76 flashcards in this deck.
Unlock Deck
k this deck
51
What is the probability that a machine will have to wait for service with two operators?
A) .654
B) .090
C) .346
D) .910
E) .016
A) .654
B) .090
C) .346
D) .910
E) .016
Unlock Deck
Unlock for access to all 76 flashcards in this deck.
Unlock Deck
k this deck
52
What is the average time that a customer would have to wait in line before being served?
A) 4.3 minutes
B) 8.3 minutes
C) 2.7 minutes
D) 6.7 minutes
E) None, the customer would be served immediately.
A) 4.3 minutes
B) 8.3 minutes
C) 2.7 minutes
D) 6.7 minutes
E) None, the customer would be served immediately.
Unlock Deck
Unlock for access to all 76 flashcards in this deck.
Unlock Deck
k this deck
53
Which of the following is not generally considered as a measure of system performance in queuing analysis?
A) The average number waiting in line
B) The average number in the system
C) Server utilization
D) The probability that an arriving customer will have to wait for service
E) The average service time
A) The average number waiting in line
B) The average number in the system
C) Server utilization
D) The probability that an arriving customer will have to wait for service
E) The average service time
Unlock Deck
Unlock for access to all 76 flashcards in this deck.
Unlock Deck
k this deck
54
A single server queuing system has an average service time of 16 minutes per customer,which is exponentially distributed.The manager is thinking of converting to a system with a constant service time of 16 minutes.The average arrival rate will remain the same.The effect will be to:
A) increase utilization.
B) decrease utilization.
C) increase the average waiting time.
D) decrease the average waiting time.
E) not have any effect since the service time is unchanged.
A) increase utilization.
B) decrease utilization.
C) increase the average waiting time.
D) decrease the average waiting time.
E) not have any effect since the service time is unchanged.
Unlock Deck
Unlock for access to all 76 flashcards in this deck.
Unlock Deck
k this deck
55
How many spaces should be provided to have a 96% probability of accommodating all of the waiting cars?
A) 10
B) 12
C) 14
D) 16
E) 18
A) 10
B) 12
C) 14
D) 16
E) 18
Unlock Deck
Unlock for access to all 76 flashcards in this deck.
Unlock Deck
k this deck
56
As the ratio of arrival rate to service rate is increased,which of the following is likely?
A) Customers move through the system in less time because utilization is increased.
B) Customers move through the system more slowly because utilization is increased.
C) Utilization is decreased because of the added strain on the system.
D) The average number in the system decreases.
E) None of these will occur.
Unlock Deck
Unlock for access to all 76 flashcards in this deck.
Unlock Deck
k this deck
57
What is the average number of machines down with one operator?
A) 1.49
B) 3.35
C) 4.40
D) 6.65
E) 8.51
A) 1.49
B) 3.35
C) 4.40
D) 6.65
E) 8.51
Unlock Deck
Unlock for access to all 76 flashcards in this deck.
Unlock Deck
k this deck
58
When the cost incurred by all customers is not the same,an appropriate queuing model is:
A) single server, single phase.
B) single server, two phases.
C) multiple server, single priority.
D) multiple server, multiple phase.
E) multiple server, with priority.
A) single server, single phase.
B) single server, two phases.
C) multiple server, single priority.
D) multiple server, multiple phase.
E) multiple server, with priority.
Unlock Deck
Unlock for access to all 76 flashcards in this deck.
Unlock Deck
k this deck
59
If operators cost $15 per hour in wages and fringe benefits and machine downtime costs $75 per hour in lost production,what is the optimal number of operators for this bank of machines?
A) 1
B) 2
C) 3
D) 4
E) 5
A) 1
B) 2
C) 3
D) 4
E) 5
Unlock Deck
Unlock for access to all 76 flashcards in this deck.
Unlock Deck
k this deck
60
A single bay car wash with a Poisson arrival rate and an exponential service time has cars arriving an average of 10 minutes apart,and an average service time of four minutes.The server utilization is:
A) .24
B) .40
C) .67
D) 2.50
E) none of these
A) .24
B) .40
C) .67
D) 2.50
E) none of these
Unlock Deck
Unlock for access to all 76 flashcards in this deck.
Unlock Deck
k this deck
61
Customers filter into a record shop at an average of 1 per minute (Poisson)where the service rate is 15 per hour (Poisson).
Determine the following:
(i)the average number of customers in the system with 8 servers
(ii)the minimum number of servers needed to keep the average time in the system to less than 6 minutes
Determine the following:
(i)the average number of customers in the system with 8 servers
(ii)the minimum number of servers needed to keep the average time in the system to less than 6 minutes
Unlock Deck
Unlock for access to all 76 flashcards in this deck.
Unlock Deck
k this deck
62
The following questions refer to this data for a multiple server, priority service queuing model:
What is the overall average arrival rate?
What is the overall average arrival rate?
Unlock Deck
Unlock for access to all 76 flashcards in this deck.
Unlock Deck
k this deck
63
The following questions refer to this data for a multiple server, priority service queuing model:
What is the average number of high priority items waiting in line for service?
What is the average number of high priority items waiting in line for service?
Unlock Deck
Unlock for access to all 76 flashcards in this deck.
Unlock Deck
k this deck
64
Two trouble-shooters handle service calls for 10 machines.The average time between service requirements is 18 days,and service time averages 2 days.Assume exponential distributions.While running,each machine can produce 1,500 pieces per day.Determine:
(i)the percentage of time trouble-shooters are idle
(ii)each machine's net productivity
(iii)If trouble-shooters represent a cost of $150 per day,and machine downtime cost is $600 per day,would another trouble-shooter be justified?
Explain.
(i)the percentage of time trouble-shooters are idle
(ii)each machine's net productivity
(iii)If trouble-shooters represent a cost of $150 per day,and machine downtime cost is $600 per day,would another trouble-shooter be justified?
Explain.
Unlock Deck
Unlock for access to all 76 flashcards in this deck.
Unlock Deck
k this deck
65
Customers arrive at a video rental desk at the rate of one per minute (Poisson).Each server can handle .40 customers per minute (Poisson).
(i)If there are four servers,determine:
1)The average time it takes to rent a video tape
2)The probability of three or fewer customers in the system
(ii)What is the minimum number of servers needed to achieve an average time in the system of less than three minutes?
(i)If there are four servers,determine:
1)The average time it takes to rent a video tape
2)The probability of three or fewer customers in the system
(ii)What is the minimum number of servers needed to achieve an average time in the system of less than three minutes?
Unlock Deck
Unlock for access to all 76 flashcards in this deck.
Unlock Deck
k this deck
66
A department has 5 machines that each run for an average of 8.4 hours (exponential)before service is required.Service time average is 1.6 hours (exponential).
(i)While running,each machine can produce 120 pieces per hour.With one server,what is the average hourly output actually achieved?
(ii)With 2 servers,what is the probability that a machine would be served immediately when it requires service?
(iii)If machine downtime cost is $100 per hour per machine,and server time costs $30 per hour,how many servers would be optimal?
Unlock Deck
Unlock for access to all 76 flashcards in this deck.
Unlock Deck
k this deck
67
The following questions refer to this data for a multiple server, priority service queuing model:
What is server utilization?
What is server utilization?
Unlock Deck
Unlock for access to all 76 flashcards in this deck.
Unlock Deck
k this deck
68
The following questions refer to this data for a multiple server, priority service queuing model:
What is the average number of low priority items waiting in line for service?
What is the average number of low priority items waiting in line for service?
Unlock Deck
Unlock for access to all 76 flashcards in this deck.
Unlock Deck
k this deck
69
For how many tellers should the system be designed if the managers want the average time a customer spends in the drive up system to be no more than 5 minutes?
A) at least 3
B) at least 4
C) at least 5
D) at least 6
E) It is impossible to say without more information.
A) at least 3
B) at least 4
C) at least 5
D) at least 6
E) It is impossible to say without more information.
Unlock Deck
Unlock for access to all 76 flashcards in this deck.
Unlock Deck
k this deck
70
The following questions refer to this data for a multiple server, priority service queuing model:
What is average time in line for a low priority item?
What is average time in line for a low priority item?
Unlock Deck
Unlock for access to all 76 flashcards in this deck.
Unlock Deck
k this deck
71
The following questions refer to this data for a multiple server, priority service queuing model:
What is the average number of all items waiting in line for service?
What is the average number of all items waiting in line for service?
Unlock Deck
Unlock for access to all 76 flashcards in this deck.
Unlock Deck
k this deck
72
The following questions refer to this data for a multiple server, priority service queuing model:
What is average time in line for a high priority item?
What is average time in line for a high priority item?
Unlock Deck
Unlock for access to all 76 flashcards in this deck.
Unlock Deck
k this deck
73
The following questions refer to this data for a multiple server, priority service queuing model:
What is average time in the system for a high priority item?
What is average time in the system for a high priority item?
Unlock Deck
Unlock for access to all 76 flashcards in this deck.
Unlock Deck
k this deck
74
The following questions refer to this data for a multiple server, priority service queuing model:
What is average time in the system for a low priority item?
What is average time in the system for a low priority item?
Unlock Deck
Unlock for access to all 76 flashcards in this deck.
Unlock Deck
k this deck
75
A manager assembled the following information about an infinite source waiting line system:
5 servers,an arrival rate of 6 per hour,and a service time of 20 minutes.The manager has determined that the average number of customers waiting for service is .04.Determine each of the following:
(i)the server utilization
(ii)the average waiting time in line in minutes
(iii)the average time in the system
(iv)the average number in the system
Unlock Deck
Unlock for access to all 76 flashcards in this deck.
Unlock Deck
k this deck
76
A department has 5 semiautomatic pieces of equipment which operate for an average of 79 minutes before they must be reloaded.The reloading operation takes an average of 21 minutes per machine.Assume exponential distributions.
(i)What is the minimum number of servers needed to keep the average downtime per cycle to less than 25 minutes?
(ii)If 1 server is used,what percentage of time will the machine be down?
(i)What is the minimum number of servers needed to keep the average downtime per cycle to less than 25 minutes?
(ii)If 1 server is used,what percentage of time will the machine be down?
Unlock Deck
Unlock for access to all 76 flashcards in this deck.
Unlock Deck
k this deck
Unlock Deck
Unlock for access to all 76 flashcards in this deck.


