Deck 5: Statistics
Full screen (f)
Question
Question
Question
Question
Question
Question
Question
To determine if two methods result in statistically different results for calcium,a technician analyzes a calcium sample five times with each method.If the F test determines the standard deviations are significantly different,which set of equations must the technician use to calculate t.
A)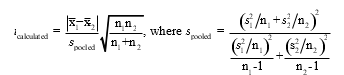
B)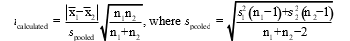
C)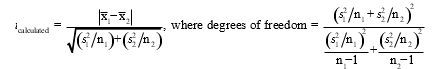
D)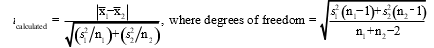
E)None of these
A)
B)
C)
D)
E)None of these
Question
Question
Question
Question
Question
Question
Question
The absorbance for a dye sample of unknown concentration is measured and the corrected absorbance is 0.5482.Calculate the concentration of the dye sample. 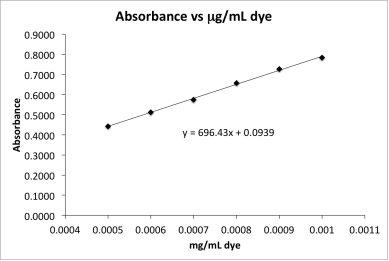
A)0)00065 g/mL
B)0)00052 g/mL
C)0)00092 g/mL
D)0)0011 g/mL
E)0)00079 g/mL
A)0)00065 g/mL
B)0)00052 g/mL
C)0)00092 g/mL
D)0)0011 g/mL
E)0)00079 g/mL
Question
Doubling the number of calibration curve data points decreases the standard uncertainty in the slope and y-intercept by a factor of:
A)2
B)
C)4
D)
E)
A)2
B)
C)4
D)
E)
Question
Question
Question
Question
Question
Question
The concentration and absorbance data below was collected for compound X.The least squares line for concentration versus absorbance is y = 6.83x + 0.0881.If a sample of compound X of unknown concentration has a corrected average absorbance of 0.6521 (three replicate measurements)calculate the concentration compound X and the uncertainty in the concentration.
 Concentration (mg/mL)
Absorbance
0.050
0.4426
0.075
0.5744
0.100
0.7841
Concentration (mg/mL)Absorbance
0.050
0.4426
0.075
0.5744
0.100
0.7841
Question

Unlock Deck
Sign up to unlock the cards in this deck!
Unlock Deck
Unlock Deck
1/22
Play
Full screen (f)
Deck 5: Statistics
1
A technician determines the concentration of calcium in milk using two instrumental methods.If Fcalculated > Ftable for the two sets of calcium data,what conclusion(s)can the technician make?
I The difference in standard deviations for the two instrumental methods is significant.
II The difference in standard deviations for the two instrumental methods is not significant.
III The data comes from populations with the same standard deviation.
IV The data does not come from populations with the same standard deviation.
A)I and III
B)I and IV
C)II and III
D)II and IV
E)Only II
I and IV
2
The Gaussian distribution is characterized by the____________________ and the____________________.
A)mean;precision
B)accuracy;standard deviation
C)mean;standard deviation
D)accuracy;precision
E)precision;standard deviation
A)mean;precision
B)accuracy;standard deviation
C)mean;standard deviation
D)accuracy;precision
E)precision;standard deviation
mean;standard deviation
3
A biosensor was developed to measure aqueous arsenic concentration.To determine the accuracy of the sensor,the sensor was tested against a standard reference sample.The biosensor results agree with the standard reference sample when:
A)the accepted value falls outside the 95% confidence interval for biosensor results.
B)the accepted value falls within the 95% confidence interval for biosensor results.
C)the standard deviations for the biosensor and accepted value are not significantly different.
D)the standard deviations for the biosensor and accepted value are not significantly different and tcalculated < ttable.
E)the standard deviations for the biosensor and accepted value are significantly different and tcalculated < ttable.
the accepted value falls within the 95% confidence interval for biosensor results.
4
A data point may be excluded when:
I Gcalculated is greater than Gtable.
II Gcalculated is less than Gtable.
III your TA or supervisor says to disregard the datum.
IV the datum is the result of a faulty procedure.
A)II and IV
B)I,III,and IV
C)I and IV
D)II,III,and IV
E)I,II,III,and IV
I Gcalculated is greater than Gtable.
II Gcalculated is less than Gtable.
III your TA or supervisor says to disregard the datum.
IV the datum is the result of a faulty procedure.
A)II and IV
B)I,III,and IV
C)I and IV
D)II,III,and IV
E)I,II,III,and IV
Unlock Deck
Unlock for access to all 22 flashcards in this deck.
Unlock Deck
k this deck
5
The null hypothesis for the comparison of two means using the t test is:
A)the two sets of measurements come from populations with the same standard deviations.
B)the two sets of measurements come from populations with different population means.
C)the two sets of measurements come from populations with the same population mean and different population standard deviations.
D)the two sets of measurements come from populations with different standard deviations.
E)the two sets of measurements come from populations with the same population mean.
Unlock Deck
Unlock for access to all 22 flashcards in this deck.
Unlock Deck
k this deck
6
Which of the statements below are TRUE regarding the mean and standard deviation?
I As the number of measurements increases,approaches if there is no random error.
II The square of the standard deviation is the average deviation.
III The mean is the center of the Gaussian distribution.
IV The standard deviation measures the width of the Gaussian distribution.
A)II,III,and IV
B)I,III,and IV
C)I and II
D)I,II,and IV
E)III and IV
Unlock Deck
Unlock for access to all 22 flashcards in this deck.
Unlock Deck
k this deck
7
To determine if two methods result in statistically different results for calcium,a technician analyzes a calcium sample five times with each method.If the F test determines the standard deviations are significantly different,which set of equations must the technician use to calculate t.
A)
B)
C)
D)
E)None of these
A)
B)
C)
D)
E)None of these
Unlock Deck
Unlock for access to all 22 flashcards in this deck.
Unlock Deck
k this deck
8
Which term is INCORRECTLY defined?
A)linear range: the range over which the response of an analytical method is proportional to analyte concentration
B)corrected absorbance: the average absorbance of the blanks is subtracted from each measured absorbance
C)blank solution: solution containing all reagents and solvents used in the analysis to which no analyte is deliberately added
D)standard solutions: solutions for which the standard deviation is known
E)dynamic range: concentration range over which there is a measurable response to analyte,though the response is not linear
Unlock Deck
Unlock for access to all 22 flashcards in this deck.
Unlock Deck
k this deck
9
A pair of students standard a sodium hydroxide solution using KHP and obtain the following concentrations: 0.1028 M,0.1031 M,0.1200 M,0.1030 M and 0.1026 M.The students suspect that 0.1200 M is an outlier.Is 0.1200 M an outlier and what is the average concentration of the sodium hydroxide solution?
A)0)1200 M is an outlier;= 0.1029 M
B)0)1200 M is not an outlier;= 0.1063 M
C)0)1200 M is not an outlier;= 0.1029 M
D)0)1200 M is an outlier;= 0.1063 M
E)Tha answer is impossible to calculate.
A)0)1200 M is an outlier;= 0.1029 M
B)0)1200 M is not an outlier;= 0.1063 M
C)0)1200 M is not an outlier;= 0.1029 M
D)0)1200 M is an outlier;= 0.1063 M
E)Tha answer is impossible to calculate.
Unlock Deck
Unlock for access to all 22 flashcards in this deck.
Unlock Deck
k this deck
10
A technician determines the concentration of calcium in milk using two instrumental methods.If Fcalculated < Ftable for the two sets of calcium data,what conclusion(s)can the technician make?
I The difference in standard deviations for the two instrumental methods is significant.
II The difference in standard deviations for the two instrumental methods is not significant.
III The data comes from populations with the same standard deviation.
IV The data does not come from populations with the same standard deviation.
A)I and III
B)I and IV
C)II and III
D)II and IV
E)Only II
Unlock Deck
Unlock for access to all 22 flashcards in this deck.
Unlock Deck
k this deck
11
The density of a solution is measured six times with the results of 1.098,1.100,1.089,1.095,1.097 and 1.101 g/mL.Calculate the 95% confidence interval for the density.
A)1)0967 0.0043 g/mL
B)1)0967 0.0038 g/mL
C)1)0967 0.0041 g/mL
D)1)0967 0.0045 g/mL
E)1)0967 0.0039 g/mL
A)1)0967 0.0043 g/mL
B)1)0967 0.0038 g/mL
C)1)0967 0.0041 g/mL
D)1)0967 0.0045 g/mL
E)1)0967 0.0039 g/mL
Unlock Deck
Unlock for access to all 22 flashcards in this deck.
Unlock Deck
k this deck
12
A technician determines the concentration of calcium in milk using two instrumental methods.For method A,= 95.03 ppm,s = 0.40 (n = 8)and for method B,= 94.96 ppm,s = 0.72 (n = 6).Is the difference in standard deviation significant at the 95% confidence level? Show all work.
Unlock Deck
Unlock for access to all 22 flashcards in this deck.
Unlock Deck
k this deck
13
Calculate the mean and standard deviation for the results below for the concentration of lead in a soil sample. 23.2 ppm,20.1 ppm,24.7 ppm,19.9 ppm,21.8 ppm
A)21.9 3.4 (n = 5)ppm
B)21.9 2.0 (n =5)ppm
C)27.4 2.0 (n = 5)ppm
D)22.0 1.8 (n = 5)ppm
E)27.4 4.2 (n = 5)ppm
A)21.9 3.4 (n = 5)ppm
B)21.9 2.0 (n =5)ppm
C)27.4 2.0 (n = 5)ppm
D)22.0 1.8 (n = 5)ppm
E)27.4 4.2 (n = 5)ppm
Unlock Deck
Unlock for access to all 22 flashcards in this deck.
Unlock Deck
k this deck
14
The absorbance for a dye sample of unknown concentration is measured and the corrected absorbance is 0.5482.Calculate the concentration of the dye sample.
A)0)00065 g/mL
B)0)00052 g/mL
C)0)00092 g/mL
D)0)0011 g/mL
E)0)00079 g/mL
A)0)00065 g/mL
B)0)00052 g/mL
C)0)00092 g/mL
D)0)0011 g/mL
E)0)00079 g/mL
Unlock Deck
Unlock for access to all 22 flashcards in this deck.
Unlock Deck
k this deck
15
Doubling the number of calibration curve data points decreases the standard uncertainty in the slope and y-intercept by a factor of:
A)2
B)
C)4
D)
E)
A)2
B)
C)4
D)
E)
Unlock Deck
Unlock for access to all 22 flashcards in this deck.
Unlock Deck
k this deck
16
The average percent purity for a batch of acetic acid manufactured by Acetic Acid Corp is 97.5% with a standard deviation of 0.2%.The minimum percent purity a buyer requires is 97.0%.What percentage of batches will have a percent purity unacceptable to the customer?
Unlock Deck
Unlock for access to all 22 flashcards in this deck.
Unlock Deck
k this deck
17
Which of the following are true for the method of least squares?
I The method of least squares draws the "best" straight line through experimental data points.
II The equation for a straight line is y = bx + m.
III Deviations in y are minimized because the uncertainty in y is assumed to be greater than the uncertainty in x.
IV The slope and y-intercept are calculated using determinants.
A)I,II,and III
B)I,III,and IV
C)I,II,and IV
D)II,III,and IV
E)III and IV
Unlock Deck
Unlock for access to all 22 flashcards in this deck.
Unlock Deck
k this deck
18
The molarity of a sodium hydroxide solution was determined by titration against KHP to be 0.1025 M,0.1087 M,0.1100 M,0.0951 M,and 0.0997 M.Calculate the 95% confidence level for the molarity sodium hydroxide.
Unlock Deck
Unlock for access to all 22 flashcards in this deck.
Unlock Deck
k this deck
19
A researcher has developed a new analytical method to determine the percent by mass iron in solids.To test the new method,the researcher purchases a standard reference material sample that is 2.85% iron by mass.Analysis of the iron standard returns values of 2.75%,2.89%,2.77%,2.81%,and 2.87%.Are the results of the new method significantly different from the standard reference sample?
Unlock Deck
Unlock for access to all 22 flashcards in this deck.
Unlock Deck
k this deck
20
For the statements below,which is(are)TRUE for confidence intervals?
I As the percentage confidence increases,the confidence interval range decreases.
II Confidence intervals are calculated using the calculated mean and standard deviation of a set of n measurements;and the results of the F test.
III The 95% confidence interval will include the true population mean for 95% of the sets of n measurements.
A)I only
B)II only
C)I and III
D)I and II
E)III only
Unlock Deck
Unlock for access to all 22 flashcards in this deck.
Unlock Deck
k this deck
21
The concentration and absorbance data below was collected for compound X.The least squares line for concentration versus absorbance is y = 6.83x + 0.0881.If a sample of compound X of unknown concentration has a corrected average absorbance of 0.6521 (three replicate measurements)calculate the concentration compound X and the uncertainty in the concentration.
Concentration (mg/mL)
Absorbance
0.050
0.4426
0.075
0.5744
0.100
0.7841
Concentration (mg/mL)Absorbance
0.050
0.4426
0.075
0.5744
0.100
0.7841
Unlock Deck
Unlock for access to all 22 flashcards in this deck.
Unlock Deck
k this deck
22
The molarity of a sodium hydroxide solution was determined by titration against KHP to be 0.1025 M,0.1087 M,0.1100 M,0.1052 M,and 0.0997 M for pooled class data.The TA suspects that 0.0997 M is an outlier.Can the TA throw out the data point? Show all work.
Unlock Deck
Unlock for access to all 22 flashcards in this deck.
Unlock Deck
k this deck
Unlock Deck
Unlock for access to all 22 flashcards in this deck.


