Deck 20: Applications of Spectrophotometry
Full screen (f)
Question
Question
The method of continuous variation was applied to the complex formed between P and X.A plot of mole fraction X versus PaXb absorbance is plotted.What is the stoichiometry for the complex? 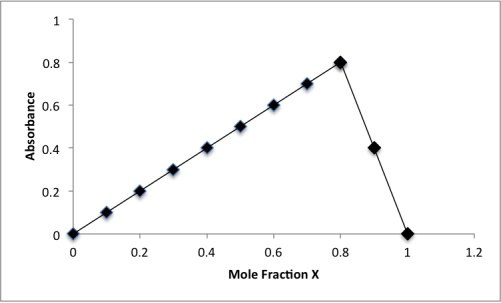
A)P2X3
B)PX4
C)PX5
D)P3X2
E)P4X
A)P2X3
B)PX4
C)PX5
D)P3X2
E)P4X
Question
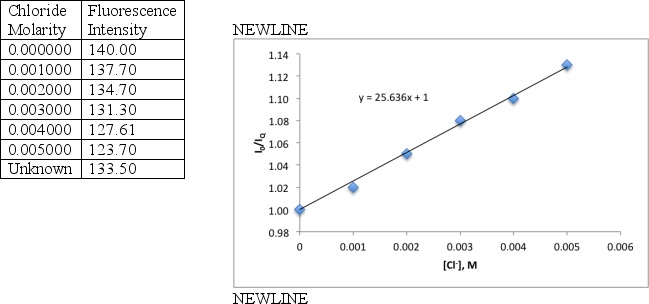
A student determines the concentration chloride in an unknown sample by pipetting 10 mL of the sample and 10 mL of 1.000 × 10⁻⁵ M quinine solution to a 100 mL flask and diluting to volume with 1 M H2SO4.A series of six chloride standards were prepared using a 0.0100 M standard chloride solution,adding an increasing volume of chloride to 100 mL volumetric flasks,in addition to 10 mL of 1.000 × 10⁻⁵ M quinine.Each solution was diluted to volume with 1 M H2SO4.Calculate the chloride concentration for the unknown using the collected fluorescence data and the Stern-Volmer graph below for the data.
Question
Question
Question
Question
Question
For the acid-base indicator bromothymol blue,the protonated form,HBB,is yellow and the deprotonated form,BB−,is blue.When both forms are present the indicator has a green color,the shade of green depends on the ratio of HBB:BB−.Use the information below to calculate the concentration of HBB and BB− for a green solution of bromothymol blue.

Question
Which is NOT true for a Scatchard plot?
A)A Scatchard plot is a graph of [PX]/[X] versus [PX].
B)
![<strong>Which is NOT true for a Scatchard plot?</strong> A)A Scatchard plot is a graph of [PX]/[X] versus [PX]. B) C)The binding constant,K,is the absolute value for the reciprocal of the slope. D) E) <div style=padding-top: 35px>](https://storage.examlex.com/TB4000/11ea6952_25b2_53c1_a4b1_1bc69f8df204_TB4000_11.jpg)
C)The binding constant,K,is the absolute value for the reciprocal of the slope.
D)
![<strong>Which is NOT true for a Scatchard plot?</strong> A)A Scatchard plot is a graph of [PX]/[X] versus [PX]. B) C)The binding constant,K,is the absolute value for the reciprocal of the slope. D) E) <div style=padding-top: 35px>](https://storage.examlex.com/TB4000/11ea6952_25b2_53c2_a4b1_eb26e8693418_TB4000_11.jpg)
E)
![<strong>Which is NOT true for a Scatchard plot?</strong> A)A Scatchard plot is a graph of [PX]/[X] versus [PX]. B) C)The binding constant,K,is the absolute value for the reciprocal of the slope. D) E) <div style=padding-top: 35px>](https://storage.examlex.com/TB4000/11ea6952_25b2_53c3_a4b1_89c47fca790c_TB4000_11.jpg)
A)A Scatchard plot is a graph of [PX]/[X] versus [PX].
B)
C)The binding constant,K,is the absolute value for the reciprocal of the slope.
D)
E)
Question
The stoichiometry for the complex MXn is investigated using the method of continuous variation.A series of 11 solutions are prepared using 0.0100 molar M and 0.0100 molar X with the volumes in the table below.Use the standard solution composition and corrected absorbance data to determine the stoichiometry for the complex.Assume that the absorbance is due only to the complex.Include a rough graph to support your answer.

Question
The Stern-Volmer equation relates quencher concentration to the ratio 0/Q.Which of the following is NOT true for the Stern-Volmer equation?
A)The y-intercept for the Stern-Volmer equation is always 1.
B)The x-intercept for the Stern-Volmer equation is always 1.
C)The slope for the graph of quencher concentration versus I0/IQ is m =

)
D)I0/IQ is proportional to 0/Q.
E)(0/Q is greater than 1 for any concentration Q.)
A)The y-intercept for the Stern-Volmer equation is always 1.
B)The x-intercept for the Stern-Volmer equation is always 1.
C)The slope for the graph of quencher concentration versus I0/IQ is m =
)
D)I0/IQ is proportional to 0/Q.
E)(0/Q is greater than 1 for any concentration Q.)
Question
Question
Question
Question
For the plot of absorbance versus wavelength for two compounds,which two wavelengths are most suited for mixture analysis? 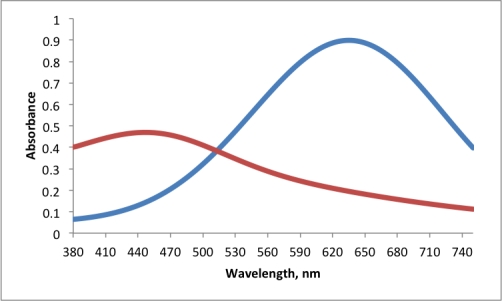
A)515 nm,515 nm
B)445 nm,635 nm
C)380 nm,750 nm
D)515 nm,635 nm
E)445 nm,515 nm
A)515 nm,515 nm
B)445 nm,635 nm
C)380 nm,750 nm
D)515 nm,635 nm
E)445 nm,515 nm
Question
Question
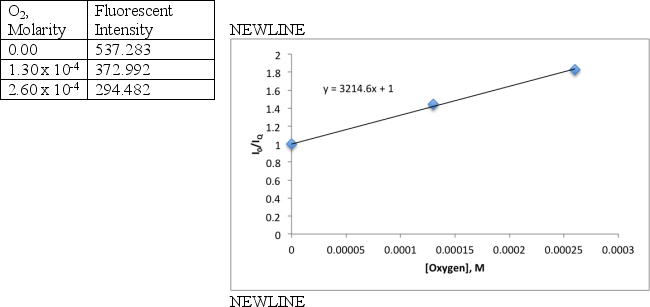
An oxygen sensor is constructed from a fluorescent dye that is easily quenched by oxygen.The sensor is calibrated with a deoxygenated water sample and an oxygen saturated water sample,2.6 x 10−4 M.The sensor is deployed to a waste treatment plant to monitor dissolved oxygen in effluent.If the sensor records a fluorescent intensity of 322.928,what is the oxygen concentration?
Question
Question
The Scatchard plot for the reaction P + X ⇋ PX is below.What is the equilibrium constant for the reaction? 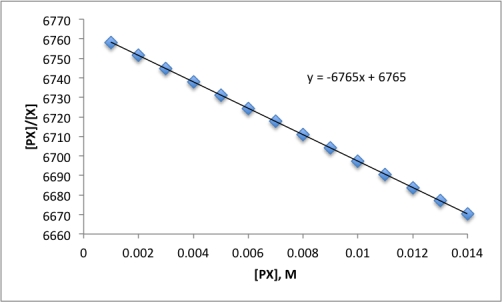
A)3)830 M−1
B)1)478 × 10−4 M−1
C)0)2611 M−1
D)6765 M−1
E)0)5832 M−1
A)3)830 M−1
B)1)478 × 10−4 M−1
C)0)2611 M−1
D)6765 M−1
E)0)5832 M−1
Question
For the UV-Vis absorption data below,calculate the concentration for the metals M2+ and N2+ in a river sample if the unknown solution was prepared by diluting 10.00 mL of river water with 10.00 mL of ligand solution and diluted to a final volume of 100.00 mL.Assume the absorbance was measured in a 1.00-cm cell.


Unlock Deck
Sign up to unlock the cards in this deck!
Unlock Deck
Unlock Deck
1/20
Play
Full screen (f)
Deck 20: Applications of Spectrophotometry
1
Sequential injection differs from flow injection by:
A)flow programming.
B)flow reversal.
C)reagent mixing.
D)flow reversal and reagent mixing.
E)flow programming and flow reversal.
A)flow programming.
B)flow reversal.
C)reagent mixing.
D)flow reversal and reagent mixing.
E)flow programming and flow reversal.
flow programming and flow reversal.
2
The method of continuous variation was applied to the complex formed between P and X.A plot of mole fraction X versus PaXb absorbance is plotted.What is the stoichiometry for the complex?
A)P2X3
B)PX4
C)PX5
D)P3X2
E)P4X
A)P2X3
B)PX4
C)PX5
D)P3X2
E)P4X
PX4
3
A student determines the concentration chloride in an unknown sample by pipetting 10 mL of the sample and 10 mL of 1.000 × 10⁻⁵ M quinine solution to a 100 mL flask and diluting to volume with 1 M H2SO4.A series of six chloride standards were prepared using a 0.0100 M standard chloride solution,adding an increasing volume of chloride to 100 mL volumetric flasks,in addition to 10 mL of 1.000 × 10⁻⁵ M quinine.Each solution was diluted to volume with 1 M H2SO4.Calculate the chloride concentration for the unknown using the collected fluorescence data and the Stern-Volmer graph below for the data.
0.01886 M Cl−
4
Which is true for the relationship between quencher concentration and fluorescent intensity?
A)As quencher concentration increases,fluorescent intensity increases.
B)As quencher concentration decreases,fluorescent intensity decreases.
C)As quencher concentration increases,fluorescent intensity decreases.
D)As quencher concentration increases,fluorescent intensity remains constant.
E)As quencher concentration decreases,fluorescent concentration remains constant.
Unlock Deck
Unlock for access to all 20 flashcards in this deck.
Unlock Deck
k this deck
5
The advantages of flow injection analysis include which of the following?
I the speed in sample analysis
II automation of solution handling
III reproducibility
IV low cost of analysis
A)II and III
B)I,II,III,and IV
C)I,III,and IV
D)II,III,and IV
E)I,II,and III
I the speed in sample analysis
II automation of solution handling
III reproducibility
IV low cost of analysis
A)II and III
B)I,II,III,and IV
C)I,III,and IV
D)II,III,and IV
E)I,II,and III
Unlock Deck
Unlock for access to all 20 flashcards in this deck.
Unlock Deck
k this deck
6
For the method of continuous variation,which is NOT true?
A)The method of continuous variation allows for the determination of stoichiometry of a complex.
B)Corrected absorbance is the measured absorbance for the complex less the absorbance for unreacted ligand and central metal.
C)Maximum absorbance is reached at the composition corresponding to the stoichiometry of the predominant complex.
D)The total concentration for various ratios of P and X must be constant.
E)Maximum absorbance when the mole fraction X equals 0.75 is indicative of a complex with the chemical formula of PX3.
Unlock Deck
Unlock for access to all 20 flashcards in this deck.
Unlock Deck
k this deck
7
________________________________________enhances the fluorescence of immunoassays by a factor of 100 by measuring the fluorescence of Eu3+ 200 s after excitation with a laser pulse.
A)Time-resolved fluorescence immunoassays
B)Time-dependent fluorescence immunoassays
C)Immunoassay fluorescence over time immunoassays
D)Weakly bound time fluorescence immunoassays
E)Europium-bound fluorescence immunoassays
A)Time-resolved fluorescence immunoassays
B)Time-dependent fluorescence immunoassays
C)Immunoassay fluorescence over time immunoassays
D)Weakly bound time fluorescence immunoassays
E)Europium-bound fluorescence immunoassays
Unlock Deck
Unlock for access to all 20 flashcards in this deck.
Unlock Deck
k this deck
8
For the acid-base indicator bromothymol blue,the protonated form,HBB,is yellow and the deprotonated form,BB−,is blue.When both forms are present the indicator has a green color,the shade of green depends on the ratio of HBB:BB−.Use the information below to calculate the concentration of HBB and BB− for a green solution of bromothymol blue.
Unlock Deck
Unlock for access to all 20 flashcards in this deck.
Unlock Deck
k this deck
9
Which is NOT true for a Scatchard plot?
A)A Scatchard plot is a graph of [PX]/[X] versus [PX].
B)
C)The binding constant,K,is the absolute value for the reciprocal of the slope.
D)
E)
A)A Scatchard plot is a graph of [PX]/[X] versus [PX].
B)
C)The binding constant,K,is the absolute value for the reciprocal of the slope.
D)
E)
Unlock Deck
Unlock for access to all 20 flashcards in this deck.
Unlock Deck
k this deck
10
The stoichiometry for the complex MXn is investigated using the method of continuous variation.A series of 11 solutions are prepared using 0.0100 molar M and 0.0100 molar X with the volumes in the table below.Use the standard solution composition and corrected absorbance data to determine the stoichiometry for the complex.Assume that the absorbance is due only to the complex.Include a rough graph to support your answer.
Unlock Deck
Unlock for access to all 20 flashcards in this deck.
Unlock Deck
k this deck
11
The Stern-Volmer equation relates quencher concentration to the ratio 0/Q.Which of the following is NOT true for the Stern-Volmer equation?
A)The y-intercept for the Stern-Volmer equation is always 1.
B)The x-intercept for the Stern-Volmer equation is always 1.
C)The slope for the graph of quencher concentration versus I0/IQ is m =
)
D)I0/IQ is proportional to 0/Q.
E)(0/Q is greater than 1 for any concentration Q.)
A)The y-intercept for the Stern-Volmer equation is always 1.
B)The x-intercept for the Stern-Volmer equation is always 1.
C)The slope for the graph of quencher concentration versus I0/IQ is m =
)
D)I0/IQ is proportional to 0/Q.
E)(0/Q is greater than 1 for any concentration Q.)
Unlock Deck
Unlock for access to all 20 flashcards in this deck.
Unlock Deck
k this deck
12
Which is true for spectroscopy of a mixture?
A)The absorbance for a mixture at a particular wavelength is the sum of the absorbances for the components that absorb at the particular wavelength.
B)Spectrophotometers can differentiate between mixture components that absorb at the same wavelength.
C)Each component in a mixture has the same molar absorptivity at the same wavelength.
D)The concentration for each component in the mixture is easily calculated with a set of simultaneous equations if there is significant overlap of individual spectra.
E)The concentration for each component in a mixture is easily calculated by least squares for guesses of each component when the individual spectra are well resolved.
Unlock Deck
Unlock for access to all 20 flashcards in this deck.
Unlock Deck
k this deck
13
The technique in which a liquid sample is injected into a continuously flowing liquid carrier containing a reagent that reacts with the sample is called:
A)flow analysis.
B)sequential flow analysis.
C)sequential analysis.
D)sequential injection analysis.
E)flow injection analysis.
A)flow analysis.
B)sequential flow analysis.
C)sequential analysis.
D)sequential injection analysis.
E)flow injection analysis.
Unlock Deck
Unlock for access to all 20 flashcards in this deck.
Unlock Deck
k this deck
14
When a molecule absorbs a photon,the molecule is promoted to an excited state,M*.The rate at which M* is created is proportional to the concentration of M.There are three pathways that M* may take to return to the ground state.Which statement below is INCORRECT for these three pathways.
A)The rate at which the excited state returns to the ground state is independent of the pathway to the ground state and the concentration of excited state molecules.
B)The three possible pathways to return to the ground state are emission,deactivation,and quenching.
C)Quenching occurs when a second molecule,the quencher Q,collides with M* to return M* to the ground state.M* + Q → M + Q*
D)Deactivation returns M* to the ground state by colliding with other molecules and releasing energy in the form of heat.M* → M + heat
E)Emission returns M* to the ground state by emitting a photon.M* → M + hv.
Unlock Deck
Unlock for access to all 20 flashcards in this deck.
Unlock Deck
k this deck
15
For the plot of absorbance versus wavelength for two compounds,which two wavelengths are most suited for mixture analysis?
A)515 nm,515 nm
B)445 nm,635 nm
C)380 nm,750 nm
D)515 nm,635 nm
E)445 nm,515 nm
A)515 nm,515 nm
B)445 nm,635 nm
C)380 nm,750 nm
D)515 nm,635 nm
E)445 nm,515 nm
Unlock Deck
Unlock for access to all 20 flashcards in this deck.
Unlock Deck
k this deck
16
The advantages of sequential injection over flow injection analysis include all of the following,except:
I less waste generated.
II smaller volumes of expensive reagents are consumed.
III ability to handle large number of samples.
IV larger reaction volumes.
A)I and II
B)III and IV
C)II and IV
D)I,II,III,and IV
E)I,II,and IV
I less waste generated.
II smaller volumes of expensive reagents are consumed.
III ability to handle large number of samples.
IV larger reaction volumes.
A)I and II
B)III and IV
C)II and IV
D)I,II,III,and IV
E)I,II,and IV
Unlock Deck
Unlock for access to all 20 flashcards in this deck.
Unlock Deck
k this deck
17
An oxygen sensor is constructed from a fluorescent dye that is easily quenched by oxygen.The sensor is calibrated with a deoxygenated water sample and an oxygen saturated water sample,2.6 x 10−4 M.The sensor is deployed to a waste treatment plant to monitor dissolved oxygen in effluent.If the sensor records a fluorescent intensity of 322.928,what is the oxygen concentration?
Unlock Deck
Unlock for access to all 20 flashcards in this deck.
Unlock Deck
k this deck
18
Which of the following is true for ELISA?
I An antibody,antibody 1,specific to the analyte of interest is dissolved in aqueous solution.
II Analyte is incubated with antibody 1,binding to form a complex.The fraction of antibody 1 sites bound to analyte is proportional to the concentration.
III Unbound substances are flushed from the ELISA surface and a second antibody,antibody 2,which binds to a different region of the analyte,is applied to the antibody 1-analyte complexes.
IV Antibody 2 is chemically modified to include an enzyme that converts a colorless reagent to a colored reagent.The more bound analyte,the more intense the color generated.
A)I,II,III,and IV
B)II and IV
C)I,III,and IV
D)II,III,and IV
E)I,II,and IV
Unlock Deck
Unlock for access to all 20 flashcards in this deck.
Unlock Deck
k this deck
19
The Scatchard plot for the reaction P + X ⇋ PX is below.What is the equilibrium constant for the reaction?
A)3)830 M−1
B)1)478 × 10−4 M−1
C)0)2611 M−1
D)6765 M−1
E)0)5832 M−1
A)3)830 M−1
B)1)478 × 10−4 M−1
C)0)2611 M−1
D)6765 M−1
E)0)5832 M−1
Unlock Deck
Unlock for access to all 20 flashcards in this deck.
Unlock Deck
k this deck
20
For the UV-Vis absorption data below,calculate the concentration for the metals M2+ and N2+ in a river sample if the unknown solution was prepared by diluting 10.00 mL of river water with 10.00 mL of ligand solution and diluted to a final volume of 100.00 mL.Assume the absorbance was measured in a 1.00-cm cell.
Unlock Deck
Unlock for access to all 20 flashcards in this deck.
Unlock Deck
k this deck
Unlock Deck
Unlock for access to all 20 flashcards in this deck.


