Deck 17: International Trade
Full screen (f)
Question
Question
Question
Question
Question
Question
Question
Question
Question
Question
Question
Question
Question
Question
Question
Question
Question
Question
Question
Question
Question
Question
Use the following to answer questions : 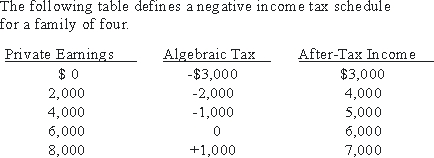
The negative income tax schedule recorded in the table above:
A)removes all incentive to work.
B)gets around the disincentive drawback in redistributing.
C)is "regressive" until we include the $10,000 and $12,000 income brackets, and balance with +$3,000 the -$3,000 of the table.
D)reduces but does not banish disincentive effects.
E)is properly described by none of the above.
Question
Question
Question
Question
Question
Use the following to answer questions :
The marginal tax rate displayed by the tax schedule recorded in the table above is:
A)0 percent
B)33 1/3 percent
C)50 percent
D)100 percent
E)none of the above
The marginal tax rate displayed by the tax schedule recorded in the table above is:
A)0 percent
B)33 1/3 percent
C)50 percent
D)100 percent
E)none of the above
Question
Use the following to answer questions :
Figure 17-1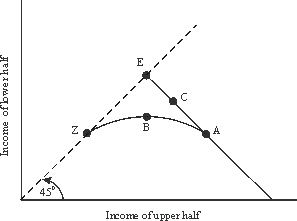
The point in Figure 17-1 that would be chosen as the social optimum by someone most concerned about efficiency is:
A)Z.
B)E.
C)C.
D)A.
E)B.
Figure 17-1
The point in Figure 17-1 that would be chosen as the social optimum by someone most concerned about efficiency is:
A)Z.
B)E.
C)C.
D)A.
E)B.
Question
Question
Question
Use the following to answer questions :
Figure 17-3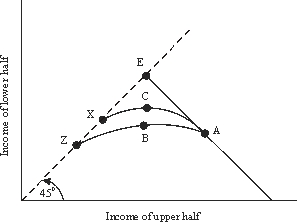
The substitution of the negative income tax for current income redistribution programs would (in terms of Figure 17-3)cause a:
A)move from A to E.
B)move from A to Z.
C)shift in the curve of effective transfer from ABZ to ACX.
D)shift in the curve of effective transfer from ACX to ABZ.
E)shift in the curve of effective transfer from AE to ABZ.
Question
Question
Question
Use the following to answer questions :
Figure 17-2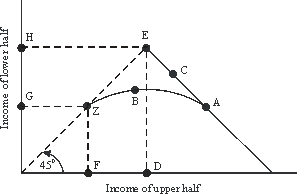
Given the social constraint drawn in Figure 17-2, the cost of redistribution, measured in terms of income, of achieving perfect equality in the income distribution would be:
A)length FD.
B)length FD plus length GH.
C)length EZ.
D)two times length EZ.
E)none of the above.
Figure 17-2
Given the social constraint drawn in Figure 17-2, the cost of redistribution, measured in terms of income, of achieving perfect equality in the income distribution would be:
A)length FD.
B)length FD plus length GH.
C)length EZ.
D)two times length EZ.
E)none of the above.
Question
Question
Question
Use the following to answer questions :
Figure 17-1
In Figure 17-1, cost of redistribution is best represented by:
A)shortfall of A below E.
B)shortfall of ABZ below AE.
C)a regression from E back to A.
D)any and all of the above.
E)none of the above.
Figure 17-1
In Figure 17-1, cost of redistribution is best represented by:
A)shortfall of A below E.
B)shortfall of ABZ below AE.
C)a regression from E back to A.
D)any and all of the above.
E)none of the above.
Question
Question
Use the following to answer questions :
Figure 17-2
Given the social constraint drawn in Figure 17-2, a policy maker interested in maximizing a total income would strive to achieve:
A)point A.
B)point B.
C)point C.
D)point E.
E)point Z.
Figure 17-2
Given the social constraint drawn in Figure 17-2, a policy maker interested in maximizing a total income would strive to achieve:
A)point A.
B)point B.
C)point C.
D)point E.
E)point Z.
Question
Use the following to answer questions :
Figure 17-3
Relative to line ACX in Figure 17-3, the point that would be chosen as an objective by someone interested exclusively in equalizing incomes would be;
A)A.
B)E.
C)C.
D)Z.
E)X.
Figure 17-3
Relative to line ACX in Figure 17-3, the point that would be chosen as an objective by someone interested exclusively in equalizing incomes would be;
A)A.
B)E.
C)C.
D)Z.
E)X.
Question
Question
Question
Question
Question
Question
Question
Question
Question
Question
Question
Question
Question
Question
Question
Question
Question
Question
Question
Question
Question
Question
Question
Question
Question
Question
Question
Use the following to answer questions :
Figure 17-4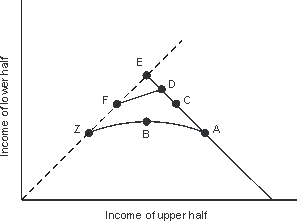
Given the social constraint illustrated in Figure 17-4, the redistribution cost associated with perfect equality would, in dollar terms, equal two times the length of AC.
Figure 17-4
Given the social constraint illustrated in Figure 17-4, the redistribution cost associated with perfect equality would, in dollar terms, equal two times the length of AC.
Question
Question
Question
Question
Question
Question
Question
Use the following to answer questions :
Figure 17-4
Given the social constraint illustrated in Figure 17-4, the redistribution cost captured along locus ABZ as compared with locus ACE is caused entirely by the cost of administering an income redistribution program.
Figure 17-4
Given the social constraint illustrated in Figure 17-4, the redistribution cost captured along locus ABZ as compared with locus ACE is caused entirely by the cost of administering an income redistribution program.

Unlock Deck
Sign up to unlock the cards in this deck!
Unlock Deck
Unlock Deck
1/74
Play
Full screen (f)
Deck 17: International Trade
1
The percentage of the population below the poverty line:
A)started to climb in 1981 after falling for two decades.
B)fell to 11 percent by 1981, where it remains today.
C)was not affected by the Reagan budget cuts of 1981 and 1982.
D)fell dramatically starting in 1981.
E)none of the above.
A)started to climb in 1981 after falling for two decades.
B)fell to 11 percent by 1981, where it remains today.
C)was not affected by the Reagan budget cuts of 1981 and 1982.
D)fell dramatically starting in 1981.
E)none of the above.
started to climb in 1981 after falling for two decades.
2
The top 5 percent of the income class receive how much of the total income in the U.S.?
A)5%.
B)10%.
C)15%.
D)21%.
E)none of the above.
A)5%.
B)10%.
C)15%.
D)21%.
E)none of the above.
21%.
3
Disposable personal income is:
A)the total receipts or cash earned by a person or household during a given time period.
B)the personal income you have after taxes.
C)the total of all your assets for a given year.
D)the money you have before all your deductions.
E)none of the above.
A)the total receipts or cash earned by a person or household during a given time period.
B)the personal income you have after taxes.
C)the total of all your assets for a given year.
D)the money you have before all your deductions.
E)none of the above.
the personal income you have after taxes.
4
Which of the following is a source of income inequality?
A)Different occupations.
B)Different inheritances.
C)Differences in ability.
D)Differences in the willingness to work hard.
E)All of the above.
A)Different occupations.
B)Different inheritances.
C)Differences in ability.
D)Differences in the willingness to work hard.
E)All of the above.
Unlock Deck
Unlock for access to all 74 flashcards in this deck.
Unlock Deck
k this deck
5
Poverty was officially defined in the 1960's in the United States as:
A)an income insufficient to buy basic food, clothing, shelter, and other necessities.
B)an income below $40,000.
C)an income insufficient to buy a house or car.
D)the same for the rest of the world.
E)none of the above.
A)an income insufficient to buy basic food, clothing, shelter, and other necessities.
B)an income below $40,000.
C)an income insufficient to buy a house or car.
D)the same for the rest of the world.
E)none of the above.
Unlock Deck
Unlock for access to all 74 flashcards in this deck.
Unlock Deck
k this deck
6
Personal income is:
A)the total receipts or cash earned by a person or household during a given time period.
B)the money you have after taxes.
C)the total of all your assets for a given year.
D)the money you have after all your deductions.
E)none of the above.
A)the total receipts or cash earned by a person or household during a given time period.
B)the money you have after taxes.
C)the total of all your assets for a given year.
D)the money you have after all your deductions.
E)none of the above.
Unlock Deck
Unlock for access to all 74 flashcards in this deck.
Unlock Deck
k this deck
7
In the United States in 2001, the:
A)lowest 20 percent of the families received more than 12 percent of the income.
B)highest 20 percent of the families received 24 percent of the income.
C)highest 5 percent of the families received 10 percent of the income.
D)lowest 20 percent of the families received less than 5 percent of the income.
E)statements above are all incorrect.
Unlock Deck
Unlock for access to all 74 flashcards in this deck.
Unlock Deck
k this deck
8
In the U.S., roughly 40% of all assets are owned by:
A)1% of the population.
B)4% of the population.
C)6% of the population.
D)10% of the population.
E)15% of the population.
A)1% of the population.
B)4% of the population.
C)6% of the population.
D)10% of the population.
E)15% of the population.
Unlock Deck
Unlock for access to all 74 flashcards in this deck.
Unlock Deck
k this deck
9
Income differentials within a country can be decreased by:
A)trade barriers between areas.
B)uniform growth in population.
C)technological change in an import competing industry.
D)labor and capital mobility.
E)none of the above.
A)trade barriers between areas.
B)uniform growth in population.
C)technological change in an import competing industry.
D)labor and capital mobility.
E)none of the above.
Unlock Deck
Unlock for access to all 74 flashcards in this deck.
Unlock Deck
k this deck
10
Which one of the following professions is most likely to have the smallest degree of income inequality?
A)Lawyers.
B)Army officers.
C)Baseball players.
D)Physicians.
E)Movie stars.
A)Lawyers.
B)Army officers.
C)Baseball players.
D)Physicians.
E)Movie stars.
Unlock Deck
Unlock for access to all 74 flashcards in this deck.
Unlock Deck
k this deck
11
Compared to the distribution of income, the distribution of wealth is:
A)fixed.
B)more equal.
C)less equal.
D)very similar.
E)extremely volatile.
A)fixed.
B)more equal.
C)less equal.
D)very similar.
E)extremely volatile.
Unlock Deck
Unlock for access to all 74 flashcards in this deck.
Unlock Deck
k this deck
12
Which of the following is not a major source of inequality in incomes over the long term?
A)Differences in educations.
B)Differences in occupations.
C)Differences in time spent working.
D)Cyclical fluctuations in per capita GDP.
E)All are potential sources, though answer D is the least important.
A)Differences in educations.
B)Differences in occupations.
C)Differences in time spent working.
D)Cyclical fluctuations in per capita GDP.
E)All are potential sources, though answer D is the least important.
Unlock Deck
Unlock for access to all 74 flashcards in this deck.
Unlock Deck
k this deck
13
The Lorenz curve is used to:
A)show the curve of diminishing returns.
B)represent consumption patterns.
C)represent the production possibilities of an economy.
D)illustrate the distribution of income and/or wealth.
E)none of the above.
A)show the curve of diminishing returns.
B)represent consumption patterns.
C)represent the production possibilities of an economy.
D)illustrate the distribution of income and/or wealth.
E)none of the above.
Unlock Deck
Unlock for access to all 74 flashcards in this deck.
Unlock Deck
k this deck
14
Which of the following is true?
A)Abilities and incomes are both normally distributed.
B)The distribution of abilities is more skewed than that of incomes.
C)The distribution of incomes is more skewed than that of abilities.
D)Abilities and incomes are both skewed in distribution.
E)Ability is not a significant factor in determining income.
Unlock Deck
Unlock for access to all 74 flashcards in this deck.
Unlock Deck
k this deck
15
The Lorenz curve plots the percentage of:
A)income against the percentage of people.
B)individuals against the percentage of families.
C)income against the percentage of spending.
D)income against the number of years of education.
E)spending against the percentage of people.
A)income against the percentage of people.
B)individuals against the percentage of families.
C)income against the percentage of spending.
D)income against the number of years of education.
E)spending against the percentage of people.
Unlock Deck
Unlock for access to all 74 flashcards in this deck.
Unlock Deck
k this deck
16
When the Lorenz curve more closely approximates the 45 degree line, income is being:
A)distributed more equally.
B)distributed more unequally.
C)enlarged for nearly every economic class.
D)taxed more heavily to pay international debts.
E)none of the above.
A)distributed more equally.
B)distributed more unequally.
C)enlarged for nearly every economic class.
D)taxed more heavily to pay international debts.
E)none of the above.
Unlock Deck
Unlock for access to all 74 flashcards in this deck.
Unlock Deck
k this deck
17
Select the correct statement.
A)Income per capita in the United States has been about the same in every state for the past 8 years.
B)In the United States, income per capita is distributed pretty much according to the distribution of abilities.
C)In the United States the poor are becoming richer and the rich poorer.
D)The chances of becoming a successful business executive in the United States do not seem to have much to do with the occupation of one's parents.
E)Income inequality in the United States diminished between 1930 and 1975.
Unlock Deck
Unlock for access to all 74 flashcards in this deck.
Unlock Deck
k this deck
18
Which of the following does not help account for the extremely skewed distribution of wealth in the U.S.?
A)The returns to entrepreneurship.
B)Inheritances.
C)Loopholes in current income tax laws.
D)The returns to successful financial investment.
E)None of the above.
A)The returns to entrepreneurship.
B)Inheritances.
C)Loopholes in current income tax laws.
D)The returns to successful financial investment.
E)None of the above.
Unlock Deck
Unlock for access to all 74 flashcards in this deck.
Unlock Deck
k this deck
19
Which countries have the least inequality?
A)Japan and Sweden.
B)Canada and Italy.
C)France and Spain.
D)U.S and Brazil.
E)all are about the same inequality.
A)Japan and Sweden.
B)Canada and Italy.
C)France and Spain.
D)U.S and Brazil.
E)all are about the same inequality.
Unlock Deck
Unlock for access to all 74 flashcards in this deck.
Unlock Deck
k this deck
20
According to the standard definition, the subsistence cost of living for a family of four in 2008 was:
A)$15,000.
B)$17,500.
C)$21,200.
D)$32,000.
E)none of the above.
A)$15,000.
B)$17,500.
C)$21,200.
D)$32,000.
E)none of the above.
Unlock Deck
Unlock for access to all 74 flashcards in this deck.
Unlock Deck
k this deck
21
Which of the following is a serious problem with the current welfare state of the United States?
A)There are no poor people so the programs are not necessary.
B)The marginal tax rates on low-income families are very high when loss of benefits is considered.
C)Eligibility is easy to check, so the roles of people employed by the welfare program are too large.
D)Poverty is a northeastern problem, so federal support is unnecessary.
E)All of the above.
Unlock Deck
Unlock for access to all 74 flashcards in this deck.
Unlock Deck
k this deck
22
Use the following to answer questions :
The negative income tax schedule recorded in the table above:
A)removes all incentive to work.
B)gets around the disincentive drawback in redistributing.
C)is "regressive" until we include the $10,000 and $12,000 income brackets, and balance with +$3,000 the -$3,000 of the table.
D)reduces but does not banish disincentive effects.
E)is properly described by none of the above.
Unlock Deck
Unlock for access to all 74 flashcards in this deck.
Unlock Deck
k this deck
23
Which of the following was a serious problem associated with the welfare state of the United States in the 1990s that helped lead to welfare reform?
A)People migrate to the state with the best benefits.
B)It is difficult to determine eligibility.
C)Eligibility rules based on income generate enormous effective tax rates for the poor.
D)It is difficult to get some of the truly needy to apply for benefits.
E)All of the above.
A)People migrate to the state with the best benefits.
B)It is difficult to determine eligibility.
C)Eligibility rules based on income generate enormous effective tax rates for the poor.
D)It is difficult to get some of the truly needy to apply for benefits.
E)All of the above.
Unlock Deck
Unlock for access to all 74 flashcards in this deck.
Unlock Deck
k this deck
24
In the past 200 years, the greatest force reducing income inequality has probably been:
A)religion.
B)private charity.
C)education.
D)unionization.
E)welfare legislation.
A)religion.
B)private charity.
C)education.
D)unionization.
E)welfare legislation.
Unlock Deck
Unlock for access to all 74 flashcards in this deck.
Unlock Deck
k this deck
25
The philosophy of the Earned-Income Tax Credit in essence is:
A)Those who do not work shall not get government dollars.
B)Those who work shall not get government dollars.
C)Those who do not work shall be rewarded with more government dollars.
D)Those who work do not need government dollars.
E)none of the above.
A)Those who do not work shall not get government dollars.
B)Those who work shall not get government dollars.
C)Those who do not work shall be rewarded with more government dollars.
D)Those who work do not need government dollars.
E)none of the above.
Unlock Deck
Unlock for access to all 74 flashcards in this deck.
Unlock Deck
k this deck
26
Today, expenditures by the federal government targeted directly at helping the poor amounted to:
A)10% of the total federal budget.
B)13% of the total federal budget.
C)20% of the total federal budget.
D)25% of the total federal budget.
E)30% of the total federal budget.
A)10% of the total federal budget.
B)13% of the total federal budget.
C)20% of the total federal budget.
D)25% of the total federal budget.
E)30% of the total federal budget.
Unlock Deck
Unlock for access to all 74 flashcards in this deck.
Unlock Deck
k this deck
27
Use the following to answer questions :
The marginal tax rate displayed by the tax schedule recorded in the table above is:
A)0 percent
B)33 1/3 percent
C)50 percent
D)100 percent
E)none of the above
The marginal tax rate displayed by the tax schedule recorded in the table above is:
A)0 percent
B)33 1/3 percent
C)50 percent
D)100 percent
E)none of the above
Unlock Deck
Unlock for access to all 74 flashcards in this deck.
Unlock Deck
k this deck
28
Use the following to answer questions :
Figure 17-1
The point in Figure 17-1 that would be chosen as the social optimum by someone most concerned about efficiency is:
A)Z.
B)E.
C)C.
D)A.
E)B.
Figure 17-1
The point in Figure 17-1 that would be chosen as the social optimum by someone most concerned about efficiency is:
A)Z.
B)E.
C)C.
D)A.
E)B.
Unlock Deck
Unlock for access to all 74 flashcards in this deck.
Unlock Deck
k this deck
29
In 2006, the percentage of children living below the poverty line was roughly:
A)5 percent.
B)10 percent.
C)17 percent.
D)21 percent.
E)28 percent.
A)5 percent.
B)10 percent.
C)17 percent.
D)21 percent.
E)28 percent.
Unlock Deck
Unlock for access to all 74 flashcards in this deck.
Unlock Deck
k this deck
30
Which of the following in not an example of assistance in kind?
A)Food stamps.
B)Medicare and Medicaid.
C)Negative income tax.
D)Soup kitchens.
E)All of the above are examples of transfers in kind.
A)Food stamps.
B)Medicare and Medicaid.
C)Negative income tax.
D)Soup kitchens.
E)All of the above are examples of transfers in kind.
Unlock Deck
Unlock for access to all 74 flashcards in this deck.
Unlock Deck
k this deck
31
Use the following to answer questions :
Figure 17-3
The substitution of the negative income tax for current income redistribution programs would (in terms of Figure 17-3)cause a:
A)move from A to E.
B)move from A to Z.
C)shift in the curve of effective transfer from ABZ to ACX.
D)shift in the curve of effective transfer from ACX to ABZ.
E)shift in the curve of effective transfer from AE to ABZ.
Unlock Deck
Unlock for access to all 74 flashcards in this deck.
Unlock Deck
k this deck
32
In calculating Lorenz curves, economists have found that:
A)income inequality in America has greatly accelerated since 1945.
B)the concentration of wealth in England is less than in America.
C)the concentration of income in the United States is slightly greater than that in England.
D)income and wealth inequalities are generally smaller in underdeveloped than in developed countries.
E)the incomes of Sweden and Israel are distributed nearly equally, but wealth holdings in both countries are highly concentrated.
Unlock Deck
Unlock for access to all 74 flashcards in this deck.
Unlock Deck
k this deck
33
The computation of the poverty line:
A)is based on the observation that lower-income families spend about one-third of their incomes on food.
B)is based on the cost of a subsistence bundle of goods devised by social workers.
C)has reflected the effects of inflation over the past two decades.
D)is an absolute measure rather than a relative measure.
E)includes all of the above.
Unlock Deck
Unlock for access to all 74 flashcards in this deck.
Unlock Deck
k this deck
34
Use the following to answer questions :
Figure 17-2
Given the social constraint drawn in Figure 17-2, the cost of redistribution, measured in terms of income, of achieving perfect equality in the income distribution would be:
A)length FD.
B)length FD plus length GH.
C)length EZ.
D)two times length EZ.
E)none of the above.
Figure 17-2
Given the social constraint drawn in Figure 17-2, the cost of redistribution, measured in terms of income, of achieving perfect equality in the income distribution would be:
A)length FD.
B)length FD plus length GH.
C)length EZ.
D)two times length EZ.
E)none of the above.
Unlock Deck
Unlock for access to all 74 flashcards in this deck.
Unlock Deck
k this deck
35
Poverty in contemporary America can be explained in part by
A)differences in training across individuals.
B)growth of technology and the increasing importance of education.
C)differences in economic environment.
D)differences in ability across individuals.
E)all of the above.
A)differences in training across individuals.
B)growth of technology and the increasing importance of education.
C)differences in economic environment.
D)differences in ability across individuals.
E)all of the above.
Unlock Deck
Unlock for access to all 74 flashcards in this deck.
Unlock Deck
k this deck
36
Among the leaks that Okun noted is:
A)the administrative cost of running revenue collection and welfare programs.
B)labor disincentives of the progressive income tax.
C)investment and saving disincentives of the progressive income tax.
D)cheating on progressive income taxes.
E)all of the above.
A)the administrative cost of running revenue collection and welfare programs.
B)labor disincentives of the progressive income tax.
C)investment and saving disincentives of the progressive income tax.
D)cheating on progressive income taxes.
E)all of the above.
Unlock Deck
Unlock for access to all 74 flashcards in this deck.
Unlock Deck
k this deck
37
Use the following to answer questions :
Figure 17-1
In Figure 17-1, cost of redistribution is best represented by:
A)shortfall of A below E.
B)shortfall of ABZ below AE.
C)a regression from E back to A.
D)any and all of the above.
E)none of the above.
Figure 17-1
In Figure 17-1, cost of redistribution is best represented by:
A)shortfall of A below E.
B)shortfall of ABZ below AE.
C)a regression from E back to A.
D)any and all of the above.
E)none of the above.
Unlock Deck
Unlock for access to all 74 flashcards in this deck.
Unlock Deck
k this deck
38
The percentage of total income earned by the lowest 20 percent of the population:
A)has fallen in the last ten years.
B)has climbed steadily to 15 percent since 1929.
C)fell to 6 percent during the Johnson Administration.
D)has grown faster than GDP since 1929.
E)none of the above.
A)has fallen in the last ten years.
B)has climbed steadily to 15 percent since 1929.
C)fell to 6 percent during the Johnson Administration.
D)has grown faster than GDP since 1929.
E)none of the above.
Unlock Deck
Unlock for access to all 74 flashcards in this deck.
Unlock Deck
k this deck
39
Use the following to answer questions :
Figure 17-2
Given the social constraint drawn in Figure 17-2, a policy maker interested in maximizing a total income would strive to achieve:
A)point A.
B)point B.
C)point C.
D)point E.
E)point Z.
Figure 17-2
Given the social constraint drawn in Figure 17-2, a policy maker interested in maximizing a total income would strive to achieve:
A)point A.
B)point B.
C)point C.
D)point E.
E)point Z.
Unlock Deck
Unlock for access to all 74 flashcards in this deck.
Unlock Deck
k this deck
40
Use the following to answer questions :
Figure 17-3
Relative to line ACX in Figure 17-3, the point that would be chosen as an objective by someone interested exclusively in equalizing incomes would be;
A)A.
B)E.
C)C.
D)Z.
E)X.
Figure 17-3
Relative to line ACX in Figure 17-3, the point that would be chosen as an objective by someone interested exclusively in equalizing incomes would be;
A)A.
B)E.
C)C.
D)Z.
E)X.
Unlock Deck
Unlock for access to all 74 flashcards in this deck.
Unlock Deck
k this deck
41
Lorenz curves drawn closer to the 45 degree line show distributions of income that are more equal.
Unlock Deck
Unlock for access to all 74 flashcards in this deck.
Unlock Deck
k this deck
42
Statistics show that in 2006 the median income of American families was $48,200.
Unlock Deck
Unlock for access to all 74 flashcards in this deck.
Unlock Deck
k this deck
43
The inequality of income in the United States was greater in 1929 than in 1949 and greater in 1929 than it is today.
Unlock Deck
Unlock for access to all 74 flashcards in this deck.
Unlock Deck
k this deck
44
The richest 5% of the population receive a larger share of total income than the bottom 40%.
Unlock Deck
Unlock for access to all 74 flashcards in this deck.
Unlock Deck
k this deck
45
Disposable personal income consists of personal income before taxes.
Unlock Deck
Unlock for access to all 74 flashcards in this deck.
Unlock Deck
k this deck
46
The traditional system of welfare payments involves massive hidden costs in terms of disincentive effects.
Unlock Deck
Unlock for access to all 74 flashcards in this deck.
Unlock Deck
k this deck
47
An efficient market economy can support an equitable distribution of income if resources are equitably distributed.
Unlock Deck
Unlock for access to all 74 flashcards in this deck.
Unlock Deck
k this deck
48
Lorenz curves can be used to illustrate the changes in income distribution over time.
Unlock Deck
Unlock for access to all 74 flashcards in this deck.
Unlock Deck
k this deck
49
Empirical studies indicate that both income and ability are distributed with no skewness to mention.
Unlock Deck
Unlock for access to all 74 flashcards in this deck.
Unlock Deck
k this deck
50
Economic growth by itself usually produces an eventual reduction in the inequality of a nation's distribution of income.
Unlock Deck
Unlock for access to all 74 flashcards in this deck.
Unlock Deck
k this deck
51
Blacks would not have low per-capita incomes if they were not the last to be hired and the first to be fired.
Unlock Deck
Unlock for access to all 74 flashcards in this deck.
Unlock Deck
k this deck
52
An efficient market economy will automatically produce a relatively equitable distribution of income.
Unlock Deck
Unlock for access to all 74 flashcards in this deck.
Unlock Deck
k this deck
53
In the United States, the top 10 percent of households in 2004 owned 70 percent of wealth, and the top 1 percent of the households owned around 35 percent of all wealth.
Unlock Deck
Unlock for access to all 74 flashcards in this deck.
Unlock Deck
k this deck
54
By 2006, the poverty rate of families headed by women raising children alone was 30 percent.
Unlock Deck
Unlock for access to all 74 flashcards in this deck.
Unlock Deck
k this deck
55
The mean income exceeds the median income in the United States today.
Unlock Deck
Unlock for access to all 74 flashcards in this deck.
Unlock Deck
k this deck
56
Differences in abilities account for most income differentials.
Unlock Deck
Unlock for access to all 74 flashcards in this deck.
Unlock Deck
k this deck
57
Wealth consists of the dollar value of financial and tangible assets minus the amount of money owed to banks and creditors.
Unlock Deck
Unlock for access to all 74 flashcards in this deck.
Unlock Deck
k this deck
58
Labor mobility can work to make the distribution of income more equal.
Unlock Deck
Unlock for access to all 74 flashcards in this deck.
Unlock Deck
k this deck
59
The top 1 percent of the U.S.population owns 35 percent of the wealth.
Unlock Deck
Unlock for access to all 74 flashcards in this deck.
Unlock Deck
k this deck
60
If all investors faced the same interest rate, the distribution of income would be determined by the distribution of wealth.
Unlock Deck
Unlock for access to all 74 flashcards in this deck.
Unlock Deck
k this deck
61
The negative income tax has never been seriously proposed in the political arena of the United States.
Unlock Deck
Unlock for access to all 74 flashcards in this deck.
Unlock Deck
k this deck
62
One of the major obstacles faced by poor families is that the rules in most welfare programs severely reduce the incentives of low-income adults to seek work.
Unlock Deck
Unlock for access to all 74 flashcards in this deck.
Unlock Deck
k this deck
63
President William Clinton ran on the platform of "reforming welfare as we know it".
Unlock Deck
Unlock for access to all 74 flashcards in this deck.
Unlock Deck
k this deck
64
Most income-security programs are targeted at the elderly rather than the poor.
Unlock Deck
Unlock for access to all 74 flashcards in this deck.
Unlock Deck
k this deck
65
Proponents of strong government action see poverty as the result of social and economic conditions over which the poor have little control.
Unlock Deck
Unlock for access to all 74 flashcards in this deck.
Unlock Deck
k this deck
66
The largest federal program targeted directly at the poor is Medicaid.
Unlock Deck
Unlock for access to all 74 flashcards in this deck.
Unlock Deck
k this deck
67
Use the following to answer questions :
Figure 17-4
Given the social constraint illustrated in Figure 17-4, the redistribution cost associated with perfect equality would, in dollar terms, equal two times the length of AC.
Figure 17-4
Given the social constraint illustrated in Figure 17-4, the redistribution cost associated with perfect equality would, in dollar terms, equal two times the length of AC.
Unlock Deck
Unlock for access to all 74 flashcards in this deck.
Unlock Deck
k this deck
68
The percentage of GDP earned by the lowest 20 percent of the population of the United States has risen steadily over the past half-century to its current level of 10%.
Unlock Deck
Unlock for access to all 74 flashcards in this deck.
Unlock Deck
k this deck
69
Now that technology has brought us to within sight of the end of scarcity, we no longer need the efficiency of our large corporations.
Unlock Deck
Unlock for access to all 74 flashcards in this deck.
Unlock Deck
k this deck
70
Discrimination has no role in explaining the incidence of poverty in the United States in the 1990s.
Unlock Deck
Unlock for access to all 74 flashcards in this deck.
Unlock Deck
k this deck
71
One advantage of a negative income tax system is the possibility of creating a minimum income below which no citizen need live.
Unlock Deck
Unlock for access to all 74 flashcards in this deck.
Unlock Deck
k this deck
72
The negative income tax would be an example of a transfer in kind because it would transfer dollars for dollars.
Unlock Deck
Unlock for access to all 74 flashcards in this deck.
Unlock Deck
k this deck
73
Medicaid was the single largest item in the 2006 federal budget of the U.S.directed primarily at the poor.
Unlock Deck
Unlock for access to all 74 flashcards in this deck.
Unlock Deck
k this deck
74
Use the following to answer questions :
Figure 17-4
Given the social constraint illustrated in Figure 17-4, the redistribution cost captured along locus ABZ as compared with locus ACE is caused entirely by the cost of administering an income redistribution program.
Figure 17-4
Given the social constraint illustrated in Figure 17-4, the redistribution cost captured along locus ABZ as compared with locus ACE is caused entirely by the cost of administering an income redistribution program.
Unlock Deck
Unlock for access to all 74 flashcards in this deck.
Unlock Deck
k this deck
Unlock Deck
Unlock for access to all 74 flashcards in this deck.


