Deck 2: Supply and Demand
Full screen (f)
Question
Question
Refer to Figure 2.1.A movement from point a to point c is most likely caused by: 
A) a decrease in the price of the good.
B) an increase in consumers' incomes, assuming the good is normal.
C) a decrease in the price of a complementary good.
D) an increase in the price of the good.
A) a decrease in the price of the good.
B) an increase in consumers' incomes, assuming the good is normal.
C) a decrease in the price of a complementary good.
D) an increase in the price of the good.
Question
Question
Question
Question
Refer to Figure 2.1.A movement from point a to point b is most likely caused by: 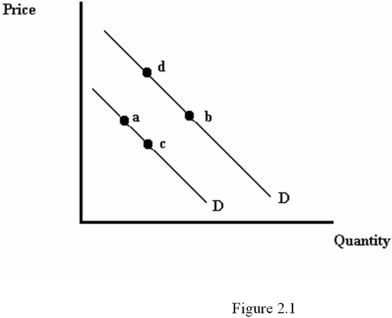
A) a decrease in the price of the good.
B) an increase in consumers' incomes, assuming the good is normal.
C) an increase in the price of a complementary good.
D) a decrease in consumers' incomes, assuming the good is normal.
A) a decrease in the price of the good.
B) an increase in consumers' incomes, assuming the good is normal.
C) an increase in the price of a complementary good.
D) a decrease in consumers' incomes, assuming the good is normal.
Question
Question
Question
Question
Question
Question
Question
Question
Question
Question
Question
Question
Question
Question
Question
Refer to Figure 2.3.At a price of $13 per CD,there would be: 
A) excess supply of 30 thousand CDs.
B) excess demand of 10 thousand CDs.
C) excess supply of 60 thousand CDs.
D) excess demand of 60 thousand CDs.
A) excess supply of 30 thousand CDs.
B) excess demand of 10 thousand CDs.
C) excess supply of 60 thousand CDs.
D) excess demand of 60 thousand CDs.
Question
Question
Question
Question
Question
Question
Question
Question
Question
Question
Question
Question
Question
Question
Refer to Figure 2.2.Which diagram represents the effect of a lower gasoline price on the supply of gasoline? 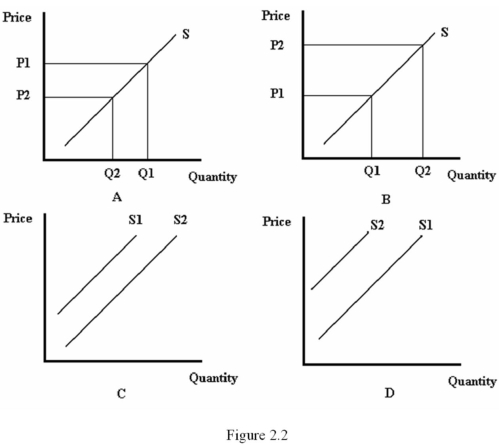
A) A
B) B
C) C
D) D
A) A
B) B
C) C
D) D
Question
Question
Question
Question
Refer to Figure 2.2.Which diagram best represents the effect of lower fertilizer prices on the market for corn? 
A) A
B) B
C) C
D) D
A) A
B) B
C) C
D) D
Question
Refer to Figure 2.3.At a price of $10 per CD,there would be: 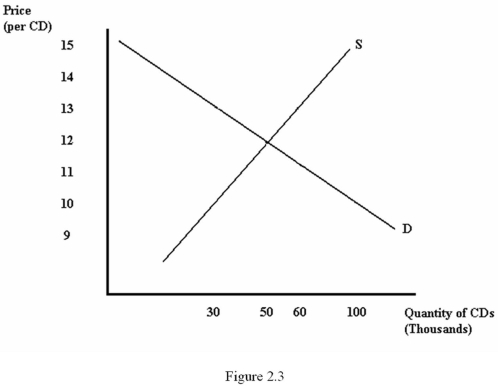
A) excess supply of 70 thousand CDs.
B) excess demand of 50 thousand CDs.
C) excess supply of 50 thousand CDs.
D) excess demand of 70 thousand CDs.
A) excess supply of 70 thousand CDs.
B) excess demand of 50 thousand CDs.
C) excess supply of 50 thousand CDs.
D) excess demand of 70 thousand CDs.
Question
Refer to Figure 2.4.The elasticity of demand at point a is given by: 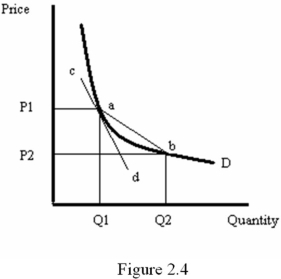
A) the slope of line cd times (P1/Q1).
B) the slope of line ab times (Q1/P1).
C) the inverse of the slope of line cd times (P1/Q1).
D) the inverse of the slope of line ab times (Q1/P1).
A) the slope of line cd times (P1/Q1).
B) the slope of line ab times (Q1/P1).
C) the inverse of the slope of line cd times (P1/Q1).
D) the inverse of the slope of line ab times (Q1/P1).
Question
Question
Question
Question
Question
Question
Question
According to Table 2.1,which presents hypothetical data on price elasticity of demand,which of the following is true about lamb? 
A) Each 2.7% change in the price of lamb causes a 1% change in the quantity demanded of lamb.
B) The demand for lamb is inelastic.
C) Each 1% change in the price of lamb causes a 2.7% change in the quantity demanded of lamb.
D) Lamb is a normal good.
A) Each 2.7% change in the price of lamb causes a 1% change in the quantity demanded of lamb.
B) The demand for lamb is inelastic.
C) Each 1% change in the price of lamb causes a 2.7% change in the quantity demanded of lamb.
D) Lamb is a normal good.
Question
Question
Question
Question
Question
Question
According to Table 2.1,which presents hypothetical data on price elasticity of demand,which good's demand is most sensitive to changes in price? 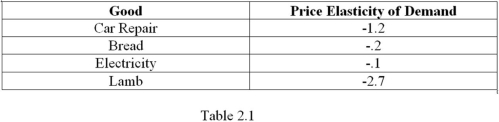
A) Car Repair
B) Bread
C) Electricity
D) Lamb
A) Car Repair
B) Bread
C) Electricity
D) Lamb
Question
Question
Question
Question
Question
Question
According to Table 2.1,which presents hypothetical data on price elasticity of demand,which of the following would be true if the price of all four goods were to increase by 3%? 
A) The quantity of car repairs demanded would decrease by a smaller percentage than would the quantity of bread demanded.
B) The quantity of car repairs demanded would increase by a smaller percentage than would the quantity of lamb demanded.
C) The quantity of electricity demanded would decrease by a smaller percentage than would the quantity of lamb demanded.
D) The quantity of electricity demanded would increase by a smaller percentage than would the quantity of bread demanded.
Question
Question
Question
Question
Question
Question
Refer to Table 2.2,which presents hypothetical data on cross-price elasticity of demand estimates.Which goods are the best substitutes? 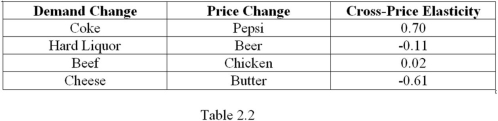
A) Coke and Pepsi
B) Hard Liquor and Beer
C) Beef and Chicken
D) Cheese and Butter
A) Coke and Pepsi
B) Hard Liquor and Beer
C) Beef and Chicken
D) Cheese and Butter
Question
Question
Question
Question
Question
Question
Question
Question
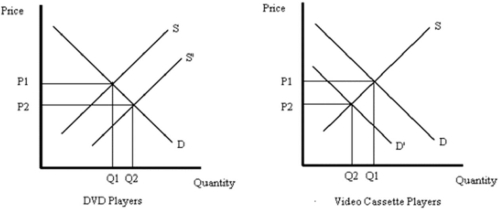
Using a graph,explain how an increase in technology will affect the equilibrium price and quantity of DVD players.Again using a graph,explain what happens in the market for video cassette recorders.
Question
Question
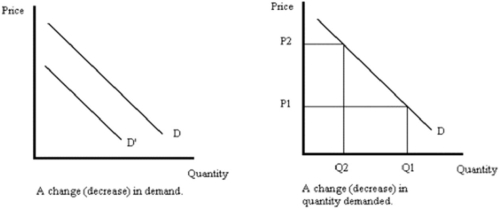
What is the difference between a change in demand and a change in the quantity demanded of a good? Illustrate you answer using carefully labeled graphs.
Question

Unlock Deck
Sign up to unlock the cards in this deck!
Unlock Deck
Unlock Deck
1/77
Play
Full screen (f)
Deck 2: Supply and Demand
1
Suppose the demand function for cable TV service is given by QCTV = 15 - 0.25 × PCTV + 0.0005 × M + 0.3 × PSTV,QCTV is the quantity of cable TV demanded (thousands of households),PCTV is the price of cable TV,M is income and PSTV is the price of satellite TV service.Suppose consumers' income is $50,000 and the price of satellite TV service is $90.How many households would demand cable TV if it were free?
A) No households
B) 15,000 households
C) 67,000 households
D) Every household would demand cable TV if it were free.
A) No households
B) 15,000 households
C) 67,000 households
D) Every household would demand cable TV if it were free.
67,000 households
2
Refer to Figure 2.1.A movement from point a to point c is most likely caused by:
A) a decrease in the price of the good.
B) an increase in consumers' incomes, assuming the good is normal.
C) a decrease in the price of a complementary good.
D) an increase in the price of the good.
A) a decrease in the price of the good.
B) an increase in consumers' incomes, assuming the good is normal.
C) a decrease in the price of a complementary good.
D) an increase in the price of the good.
a decrease in the price of the good.
3
Suppose the demand function for cable TV service is given by QCTV = 15 - 0.25 × PCTV + 0.0005 × M + 0.3 × PSTV,where QCTV is the quantity of cable TV demanded (thousands of households),PCTV is the price of cable TV,M is income and PSTV is the price of satellite TV service.We can see that:
A) cable TV service is an inferior good.
B) cable TV service is a normal good.
C) cable TV service and satellite TV service are complements.
D) cable TV service and satellite TV service are unrelated to one another.
A) cable TV service is an inferior good.
B) cable TV service is a normal good.
C) cable TV service and satellite TV service are complements.
D) cable TV service and satellite TV service are unrelated to one another.
cable TV service is a normal good.
4
Suppose the demand function for cable TV service is given by QCTV = 15 - 0.25 × PCTV + 0.0005 × M + 0.3 × PSTV,where QCTV is the quantity of cable TV demanded (thousands of households),PCTV is the price of cable TV,M is income and PSTV is the price of satellite TV service.If consumers' income is $50,000 and the price of satellite TV service is $90,then which of the following gives the demand curve for cable TV?
A) QCTV = 17 - 0.25 × PCTV
B) QCTV = 67 - 0.25 × PCTV
C) QCTV = 15 - 0.25 × PCTV + 0.0005 × M + 0.3 × PSTV
D) QCTV = 13 - 0.25 × PCTV
A) QCTV = 17 - 0.25 × PCTV
B) QCTV = 67 - 0.25 × PCTV
C) QCTV = 15 - 0.25 × PCTV + 0.0005 × M + 0.3 × PSTV
D) QCTV = 13 - 0.25 × PCTV
Unlock Deck
Unlock for access to all 77 flashcards in this deck.
Unlock Deck
k this deck
5
The effect of an increase in the price of gasoline on the demand for sport utility vehicles would be shown by a:
A) rightward shift of the demand curve for sport utility vehicles.
B) leftward shift of the demand curve for sport utility vehicles.
C) movement up and to the left along the demand curve for sport utility vehicles.
D) movement down and to the right along the demand curve for sport utility vehicles.
A) rightward shift of the demand curve for sport utility vehicles.
B) leftward shift of the demand curve for sport utility vehicles.
C) movement up and to the left along the demand curve for sport utility vehicles.
D) movement down and to the right along the demand curve for sport utility vehicles.
Unlock Deck
Unlock for access to all 77 flashcards in this deck.
Unlock Deck
k this deck
6
Refer to Figure 2.1.A movement from point a to point b is most likely caused by:
A) a decrease in the price of the good.
B) an increase in consumers' incomes, assuming the good is normal.
C) an increase in the price of a complementary good.
D) a decrease in consumers' incomes, assuming the good is normal.
A) a decrease in the price of the good.
B) an increase in consumers' incomes, assuming the good is normal.
C) an increase in the price of a complementary good.
D) a decrease in consumers' incomes, assuming the good is normal.
Unlock Deck
Unlock for access to all 77 flashcards in this deck.
Unlock Deck
k this deck
7
Suppose the demand function for cable TV service is given by QCTV = 15 - 0.25 × PCTV + 0.0005 × M + 0.3 × PSTV,QCTV is the quantity of cable TV demanded (thousands of households),PCTV is the price of cable TV,M is income and PSTV is the price of satellite TV service.Suppose consumers' income is $50,000 and the price of satellite TV service is $90.At what price would the demand for cable TV services be equal to 55,000 households?
A) $67
B) $48
C) $12
D) There is not enough information to answer the question.
A) $67
B) $48
C) $12
D) There is not enough information to answer the question.
Unlock Deck
Unlock for access to all 77 flashcards in this deck.
Unlock Deck
k this deck
8
Suppose the demand function for cable TV service is given by QCTV = 15 - 0.25 × PCTV + 0.0005 × M + 0.3 × PSTV,QCTV is the quantity of cable TV demanded (thousands of households),PCTV is the price of cable TV,M is income and PSTV is the price of satellite TV service.All else equal,a $10 increase in the price of satellite TV will cause the quantity of cable TV demanded to:
A) decrease by 3,000 households.
B) increase by 3,000 households.
C) decrease by 5,000 households.
D) increase by 5,000 households.
A) decrease by 3,000 households.
B) increase by 3,000 households.
C) decrease by 5,000 households.
D) increase by 5,000 households.
Unlock Deck
Unlock for access to all 77 flashcards in this deck.
Unlock Deck
k this deck
9
A product's ________ shows how much sellers of a product want to sell at each possible price,holding all other factors fixed.
A) supply function
B) supply curve
C) production function
D) total product curve
A) supply function
B) supply curve
C) production function
D) total product curve
Unlock Deck
Unlock for access to all 77 flashcards in this deck.
Unlock Deck
k this deck
10
An increase in the price of a good is shown by a:
A) movement up and to the left along the supply curve.
B) movement down and to the right along the supply curve.
C) movement up and to the right along the supply curve.
D) movement down and to the left along the supply curve.
A) movement up and to the left along the supply curve.
B) movement down and to the right along the supply curve.
C) movement up and to the right along the supply curve.
D) movement down and to the left along the supply curve.
Unlock Deck
Unlock for access to all 77 flashcards in this deck.
Unlock Deck
k this deck
11
Two products are complements if:
A) a decrease in the price of one causes buyers to demand less of the other.
B) an increase in the price of one causes buyers to demand more of the other.
C) a decrease in the price of one causes buyers to demand more of the other.
D) individuals consume the goods together.
A) a decrease in the price of one causes buyers to demand less of the other.
B) an increase in the price of one causes buyers to demand more of the other.
C) a decrease in the price of one causes buyers to demand more of the other.
D) individuals consume the goods together.
Unlock Deck
Unlock for access to all 77 flashcards in this deck.
Unlock Deck
k this deck
12
If an increase in the price of one good causes buyers to demand less of another good,then the two goods are:
A) normal goods.
B) inferior goods.
C) substitutes.
D) complements.
A) normal goods.
B) inferior goods.
C) substitutes.
D) complements.
Unlock Deck
Unlock for access to all 77 flashcards in this deck.
Unlock Deck
k this deck
13
A product's ________ describes the amount of the product that is demanded for each possible combination of its price and other factors.
A) demand curve
B) price-consumption curve
C) utility function
D) demand function
A) demand curve
B) price-consumption curve
C) utility function
D) demand function
Unlock Deck
Unlock for access to all 77 flashcards in this deck.
Unlock Deck
k this deck
14
Two products are substitutes if:
A) an increase in the price of one causes buyers to demand less of the other.
B) an increase in the price of one causes buyers to demand more of the other.
C) a decrease in the price of one causes buyers to demand more of the other.
D) individuals consume the goods together.
A) an increase in the price of one causes buyers to demand less of the other.
B) an increase in the price of one causes buyers to demand more of the other.
C) a decrease in the price of one causes buyers to demand more of the other.
D) individuals consume the goods together.
Unlock Deck
Unlock for access to all 77 flashcards in this deck.
Unlock Deck
k this deck
15
An increase in the price of milk would be shown by a:
A) rightward shift of the supply curve for milk.
B) movement up and to the right along the supply curve for milk.
C) leftward shift of the supply curve for milk.
D) movement down and to the left along the supply curve for milk.
A) rightward shift of the supply curve for milk.
B) movement up and to the right along the supply curve for milk.
C) leftward shift of the supply curve for milk.
D) movement down and to the left along the supply curve for milk.
Unlock Deck
Unlock for access to all 77 flashcards in this deck.
Unlock Deck
k this deck
16
A change in demand of a good is shown by a:
A) movement along a demand curve.
B) shift of a demand curve.
C) movement along the demand function.
D) shift of the demand function.
A) movement along a demand curve.
B) shift of a demand curve.
C) movement along the demand function.
D) shift of the demand function.
Unlock Deck
Unlock for access to all 77 flashcards in this deck.
Unlock Deck
k this deck
17
An increase in the price of a good is shown by a:
A) rightward shift of the demand curve.
B) leftward shift of the demand curve.
C) movement up and to the left along the demand curve.
D) movement down and to the right along the demand curve.
A) rightward shift of the demand curve.
B) leftward shift of the demand curve.
C) movement up and to the left along the demand curve.
D) movement down and to the right along the demand curve.
Unlock Deck
Unlock for access to all 77 flashcards in this deck.
Unlock Deck
k this deck
18
The relationship that shows how much buyers of a product want to buy at each possible price,holding fixed all other factors is called:
A) a demand curve.
B) elasticity of demand.
C) demand function.
D) an indifference curve.
A) a demand curve.
B) elasticity of demand.
C) demand function.
D) an indifference curve.
Unlock Deck
Unlock for access to all 77 flashcards in this deck.
Unlock Deck
k this deck
19
Suppose the demand function for cable TV service is given by QCTV = 15 - 0.25 × PCTV + 0.0005 × M + 0.3 × PSTV,where QCTV is the quantity of cable TV demanded (thousands of households),PCTV is the price of cable TV,M is income and PSTV is the price of satellite TV service.We can see that:
A) cable TV and satellite TV are substitutes.
B) cable TV and satellite TV are complements.
C) satellite TV is a normal good.
D) satellite TV is an inferior good.
A) cable TV and satellite TV are substitutes.
B) cable TV and satellite TV are complements.
C) satellite TV is a normal good.
D) satellite TV is an inferior good.
Unlock Deck
Unlock for access to all 77 flashcards in this deck.
Unlock Deck
k this deck
20
If an increase in the price of one good causes buyers to demand more of another good,then the two goods are:
A) normal goods.
B) inferior goods.
C) substitutes.
D) complements.
A) normal goods.
B) inferior goods.
C) substitutes.
D) complements.
Unlock Deck
Unlock for access to all 77 flashcards in this deck.
Unlock Deck
k this deck
21
Refer to Figure 2.3.At a price of $13 per CD,there would be:
A) excess supply of 30 thousand CDs.
B) excess demand of 10 thousand CDs.
C) excess supply of 60 thousand CDs.
D) excess demand of 60 thousand CDs.
A) excess supply of 30 thousand CDs.
B) excess demand of 10 thousand CDs.
C) excess supply of 60 thousand CDs.
D) excess demand of 60 thousand CDs.
Unlock Deck
Unlock for access to all 77 flashcards in this deck.
Unlock Deck
k this deck
22
Consider the relationship given by QCars = 100 + 4 × PCars - 2 × PSteel - 0.2 × PWorkers,where QCars is the quantity of cars supplied (in thousands),PCars is the price of cars (in thousands of dollars),PSteel is the price of steel,and PWorkers is the wage earned by autoworkers.If the price of steel is $10 per unit and the price of workers (the wage)is $20,at what price would there be 164,000 cars supplied?
A) $10,000
B) $16,000
C) $22,000
D) $41,000
A) $10,000
B) $16,000
C) $22,000
D) $41,000
Unlock Deck
Unlock for access to all 77 flashcards in this deck.
Unlock Deck
k this deck
23
Consider the relationship given by QCars = 100 + 4 × PCars - 2 × PSteel - 0.2 × PWorkers,where QCars is the quantity of cars supplied (in thousands),PCars is the price of cars (in thousands of dollars),PSteel is the price of steel,and PWorkers is the wage earned by autoworkers.If the price of steel is $10 per unit and the price of workers (the wage)is $20,what is the supply curve for cars?
A) QCars = 124 + 4 × PCars
B) QCars = 100 + 4 × PCars - 2 × PSteel - .2 × PWorkers
C) QCars = 100 + 4 × PCars
D) QCars = 76 + 4 × PCar
A) QCars = 124 + 4 × PCars
B) QCars = 100 + 4 × PCars - 2 × PSteel - .2 × PWorkers
C) QCars = 100 + 4 × PCars
D) QCars = 76 + 4 × PCar
Unlock Deck
Unlock for access to all 77 flashcards in this deck.
Unlock Deck
k this deck
24
Which economist is credited with originating the use of supply and demand analysis?
A) Vernon Smith
B) Adam Smith
C) Alfred Marshall
D) John Maynard Keynes
A) Vernon Smith
B) Adam Smith
C) Alfred Marshall
D) John Maynard Keynes
Unlock Deck
Unlock for access to all 77 flashcards in this deck.
Unlock Deck
k this deck
25
Which economist won the Nobel Prize for using experiments to test the model of supply and demand?
A) Vernon Smith
B) Adam Smith
C) Alfred Marshall
D) Steven Levitt
A) Vernon Smith
B) Adam Smith
C) Alfred Marshall
D) Steven Levitt
Unlock Deck
Unlock for access to all 77 flashcards in this deck.
Unlock Deck
k this deck
26
Consider the relationship given by QCars = 100 + 4 × PCars - 2 × PSteel - 0.2 × PWorkers,where QCars is the quantity of cars supplied (in thousands),PCars is the price of cars (in thousands of dollars),PSteel is the price of steel,and PWorkers is the wage earned by autoworkers.What would be the impact of a $15 increase in the price of steel?
A) The quantity of cars supplied would decrease by 30,000 cars.
B) The quantity of cars supplied would increase by 30,000 cars.
C) The quantity of cars supplied would decrease by 7,500 cars.
D) The quantity of cars supplied would increase by 7,500 cars.
A) The quantity of cars supplied would decrease by 30,000 cars.
B) The quantity of cars supplied would increase by 30,000 cars.
C) The quantity of cars supplied would decrease by 7,500 cars.
D) The quantity of cars supplied would increase by 7,500 cars.
Unlock Deck
Unlock for access to all 77 flashcards in this deck.
Unlock Deck
k this deck
27
Oil is an input used to produce gasoline.An increase in the price of oil would be represented by:
A) a leftward shift of the supply curve for gasoline.
B) a rightward shift of the supply curve for gasoline.
C) a movement up and to the right along the supply curve for gasoline.
D) a movement down and to the left along the supply curve for gasoline.
A) a leftward shift of the supply curve for gasoline.
B) a rightward shift of the supply curve for gasoline.
C) a movement up and to the right along the supply curve for gasoline.
D) a movement down and to the left along the supply curve for gasoline.
Unlock Deck
Unlock for access to all 77 flashcards in this deck.
Unlock Deck
k this deck
28
Which of the following would result from an increase in the supply of a good?
A) Both equilibrium price and quantity would rise.
B) Both equilibrium price and quantity would fall.
C) Equilibrium price would rise, and equilibrium quantity would fall.
D) Equilibrium quantity would rise, and equilibrium price would fall.
A) Both equilibrium price and quantity would rise.
B) Both equilibrium price and quantity would fall.
C) Equilibrium price would rise, and equilibrium quantity would fall.
D) Equilibrium quantity would rise, and equilibrium price would fall.
Unlock Deck
Unlock for access to all 77 flashcards in this deck.
Unlock Deck
k this deck
29
An improvement in the technology used to produce cell phones would be shown by a:
A) rightward shift of the supply curve for cell phones.
B) leftward shift of the supply curve for cell phones.
C) rightward shift of the demand curve for cell phones.
D) leftward shift of the demand curve for cell phones.
A) rightward shift of the supply curve for cell phones.
B) leftward shift of the supply curve for cell phones.
C) rightward shift of the demand curve for cell phones.
D) leftward shift of the demand curve for cell phones.
Unlock Deck
Unlock for access to all 77 flashcards in this deck.
Unlock Deck
k this deck
30
A change in the quantity supplied of a good is represented as a:
A) movement along a supply curve.
B) shift of a supply curve.
C) movement along the supply function.
D) shift of the supply function.
A) movement along a supply curve.
B) shift of a supply curve.
C) movement along the supply function.
D) shift of the supply function.
Unlock Deck
Unlock for access to all 77 flashcards in this deck.
Unlock Deck
k this deck
31
Which of the following is a factor that affects both the supply of and demand for a good?
A) Technology
B) Price of inputs
C) Consumers' income
D) Government regulations
A) Technology
B) Price of inputs
C) Consumers' income
D) Government regulations
Unlock Deck
Unlock for access to all 77 flashcards in this deck.
Unlock Deck
k this deck
32
Consider the relationship given by QCars = 100 + 4 × PCars - 2 × PSteel - 0.2 × PWorkers,where QCars is the quantity of cars supplied (in thousands),PCars is the price of cars (in thousands of dollars),PSteel is the price of steel,and PWorkers is the wage earned by autoworkers.If the price of steel is $10 per unit and the price of workers (the wage)is $20,how many cars will be supplied if the price of cars is $20,000?
A) 96,000
B) 156,000
C) 204,000
D) 960,000
A) 96,000
B) 156,000
C) 204,000
D) 960,000
Unlock Deck
Unlock for access to all 77 flashcards in this deck.
Unlock Deck
k this deck
33
Which of the following would result from an increase in the demand for a good?
A) Both equilibrium price and quantity would rise.
B) Both equilibrium price and quantity would fall.
C) Equilibrium price would rise, and equilibrium quantity would fall.
D) Equilibrium quantity would rise, and equilibrium price would fall.
A) Both equilibrium price and quantity would rise.
B) Both equilibrium price and quantity would fall.
C) Equilibrium price would rise, and equilibrium quantity would fall.
D) Equilibrium quantity would rise, and equilibrium price would fall.
Unlock Deck
Unlock for access to all 77 flashcards in this deck.
Unlock Deck
k this deck
34
Which of the following best describes the process that occurs when the price of a good is below equilibrium?
A) The excess demand for the good provides an incentive for buyers to offer a higher price. These higher prices encourage sellers to supply more of the good.
B) The excess supply of the good provides an incentive for buyers to offer a higher price. These higher prices encourage sellers to supply more of the good.
C) The excess demand for the good provides an incentive for buyers to offer a lower price. These lower prices encourage sellers to supply less of the good.
D) The excess supply for the good provides an incentive for buyers to offer a lower price. These lower prices encourage sellers to supply less of the good.
Unlock Deck
Unlock for access to all 77 flashcards in this deck.
Unlock Deck
k this deck
35
Refer to Figure 2.2.Which diagram represents the effect of a lower gasoline price on the supply of gasoline?
A) A
B) B
C) C
D) D
A) A
B) B
C) C
D) D
Unlock Deck
Unlock for access to all 77 flashcards in this deck.
Unlock Deck
k this deck
36
A product's ______ describes the amount of the product that is supplied for each possible combination of its price and other factors.
A) production function
B) supply curve
C) supply function
D) production possibilities curve
A) production function
B) supply curve
C) supply function
D) production possibilities curve
Unlock Deck
Unlock for access to all 77 flashcards in this deck.
Unlock Deck
k this deck
37
Excess supply is:
A) the result of a price that is above equilibrium, causing the quantity demanded to exceed the quantity supplied.
B) the result of a price that is below equilibrium, causing the quantity demanded to exceed the quantity supplied.
C) the result of a price that is above equilibrium, causing the quantity supplied to exceed the quantity demanded.
D) the result of a price that is below equilibrium, causing the quantity supplied to exceed the quantity demanded.
Unlock Deck
Unlock for access to all 77 flashcards in this deck.
Unlock Deck
k this deck
38
Suppose that the demand for movies is given by Qd = 30 - 2 × PMovies and the supply is given by Qs = 2 + 2 × PMovies.What is the equilibrium price and quantity of movies?
A) PMovies = $7, Q = 30
B) PMovies = $2, Q = 30
C) PMovies = $4, Q = 28
D) PMovies = $7, Q = 16
A) PMovies = $7, Q = 30
B) PMovies = $2, Q = 30
C) PMovies = $4, Q = 28
D) PMovies = $7, Q = 16
Unlock Deck
Unlock for access to all 77 flashcards in this deck.
Unlock Deck
k this deck
39
Refer to Figure 2.2.Which diagram best represents the effect of lower fertilizer prices on the market for corn?
A) A
B) B
C) C
D) D
A) A
B) B
C) C
D) D
Unlock Deck
Unlock for access to all 77 flashcards in this deck.
Unlock Deck
k this deck
40
Refer to Figure 2.3.At a price of $10 per CD,there would be:
A) excess supply of 70 thousand CDs.
B) excess demand of 50 thousand CDs.
C) excess supply of 50 thousand CDs.
D) excess demand of 70 thousand CDs.
A) excess supply of 70 thousand CDs.
B) excess demand of 50 thousand CDs.
C) excess supply of 50 thousand CDs.
D) excess demand of 70 thousand CDs.
Unlock Deck
Unlock for access to all 77 flashcards in this deck.
Unlock Deck
k this deck
41
Refer to Figure 2.4.The elasticity of demand at point a is given by:
A) the slope of line cd times (P1/Q1).
B) the slope of line ab times (Q1/P1).
C) the inverse of the slope of line cd times (P1/Q1).
D) the inverse of the slope of line ab times (Q1/P1).
A) the slope of line cd times (P1/Q1).
B) the slope of line ab times (Q1/P1).
C) the inverse of the slope of line cd times (P1/Q1).
D) the inverse of the slope of line ab times (Q1/P1).
Unlock Deck
Unlock for access to all 77 flashcards in this deck.
Unlock Deck
k this deck
42
The ______ the demand curve,the _____ responsive is the amount demanded to price.
A) steeper; less
B) steeper; more
C) flatter; less
D) higher; less
A) steeper; less
B) steeper; more
C) flatter; less
D) higher; less
Unlock Deck
Unlock for access to all 77 flashcards in this deck.
Unlock Deck
k this deck
43
Suppose a good has a demand curve given by Q = 20 - 8 × P.What is the price elasticity of demand if the price is $2?
A) -4
B) -1/16
C) 1/2
D) -1/2
A) -4
B) -1/16
C) 1/2
D) -1/2
Unlock Deck
Unlock for access to all 77 flashcards in this deck.
Unlock Deck
k this deck
44
Demand is said to be elastic when:
A) the percentage change in the amount demanded is smaller than the percentage change in price.
B) the demand curve is relatively flat.
C) the elasticity of demand is less than -1.
D) the elasticity of demand is greater than -1.
A) the percentage change in the amount demanded is smaller than the percentage change in price.
B) the demand curve is relatively flat.
C) the elasticity of demand is less than -1.
D) the elasticity of demand is greater than -1.
Unlock Deck
Unlock for access to all 77 flashcards in this deck.
Unlock Deck
k this deck
45
Supply curves tend to be _____ in the ______.
A) steeper; long run
B) flatter; long run
C) flatter; short run
D) negatively-sloped; short run and in the long run
A) steeper; long run
B) flatter; long run
C) flatter; short run
D) negatively-sloped; short run and in the long run
Unlock Deck
Unlock for access to all 77 flashcards in this deck.
Unlock Deck
k this deck
46
Which of the following statements about elasticity measures is true?
A) Elasticities are always positive values.
B) Values that are close to zero indicate greater responsiveness.
C) Values that are further from zero indicate greater responsiveness.
D) Values that are further from zero indicate less elasticity.
A) Elasticities are always positive values.
B) Values that are close to zero indicate greater responsiveness.
C) Values that are further from zero indicate greater responsiveness.
D) Values that are further from zero indicate less elasticity.
Unlock Deck
Unlock for access to all 77 flashcards in this deck.
Unlock Deck
k this deck
47
For a linear demand curve,demand is ____ elastic at _____ prices.
A) more; higher
B) less; higher
C) more; lower
D) constantly; all
A) more; higher
B) less; higher
C) more; lower
D) constantly; all
Unlock Deck
Unlock for access to all 77 flashcards in this deck.
Unlock Deck
k this deck
48
According to Table 2.1,which presents hypothetical data on price elasticity of demand,which of the following is true about lamb?
A) Each 2.7% change in the price of lamb causes a 1% change in the quantity demanded of lamb.
B) The demand for lamb is inelastic.
C) Each 1% change in the price of lamb causes a 2.7% change in the quantity demanded of lamb.
D) Lamb is a normal good.
A) Each 2.7% change in the price of lamb causes a 1% change in the quantity demanded of lamb.
B) The demand for lamb is inelastic.
C) Each 1% change in the price of lamb causes a 2.7% change in the quantity demanded of lamb.
D) Lamb is a normal good.
Unlock Deck
Unlock for access to all 77 flashcards in this deck.
Unlock Deck
k this deck
49
Isoelastic demand means that:
A) the elasticity of demand is equal to -1.
B) demand is completely unresponsive to price.
C) the elasticity is demand is infinite.
D) the demand function has the same elasticity at every price.
A) the elasticity of demand is equal to -1.
B) demand is completely unresponsive to price.
C) the elasticity is demand is infinite.
D) the demand function has the same elasticity at every price.
Unlock Deck
Unlock for access to all 77 flashcards in this deck.
Unlock Deck
k this deck
50
What can cause the price of a good to rise?
A) An increase in demand or a decrease in supply
B) An increase in demand or an increase in supply
C) A decrease in demand or an increase in supply
D) A decrease in demand or a decrease in supply
A) An increase in demand or a decrease in supply
B) An increase in demand or an increase in supply
C) A decrease in demand or an increase in supply
D) A decrease in demand or a decrease in supply
Unlock Deck
Unlock for access to all 77 flashcards in this deck.
Unlock Deck
k this deck
51
Which of the following is the formula for the elasticity of Y with respect to X?
A) E = (percent change in Y)/( percent change in X)
B) E = (percent change in X)/(percent change in Y)
C) E = (change in Y)/(change in X)
D) E = (change in X)/(change in Y)
A) E = (percent change in Y)/( percent change in X)
B) E = (percent change in X)/(percent change in Y)
C) E = (change in Y)/(change in X)
D) E = (change in X)/(change in Y)
Unlock Deck
Unlock for access to all 77 flashcards in this deck.
Unlock Deck
k this deck
52
Without more information,the supply and demand model cannot predict the effect on price of:
A) a simultaneous decrease in quantity demanded and increase in quantity supplied.
B) a simultaneous decrease in demand and increase in supply.
C) a simultaneous increase in demand and increase in supply.
D) a simultaneous increase in demand and decrease in supply.
A) a simultaneous decrease in quantity demanded and increase in quantity supplied.
B) a simultaneous decrease in demand and increase in supply.
C) a simultaneous increase in demand and increase in supply.
D) a simultaneous increase in demand and decrease in supply.
Unlock Deck
Unlock for access to all 77 flashcards in this deck.
Unlock Deck
k this deck
53
Suppose there is a decrease in both the demand for and supply of a good.What happens to equilibrium price and quantity?
A) Equilibrium quantity increases, but the effect on equilibrium price is ambiguous.
B) Equilibrium quantity decreases, but the effect on equilibrium price is ambiguous.
C) Equilibrium price increases, but the effect on equilibrium quantity is ambiguous.
D) Equilibrium price decreases, but the effect on equilibrium quantity is ambiguous.
Unlock Deck
Unlock for access to all 77 flashcards in this deck.
Unlock Deck
k this deck
54
According to Table 2.1,which presents hypothetical data on price elasticity of demand,which good's demand is most sensitive to changes in price?
A) Car Repair
B) Bread
C) Electricity
D) Lamb
A) Car Repair
B) Bread
C) Electricity
D) Lamb
Unlock Deck
Unlock for access to all 77 flashcards in this deck.
Unlock Deck
k this deck
55
According to basic supply and demand analysis,when hurricane Katrina caused oil prices to rise,what happened to the equilibrium price and quantity of sport utility vehicles?
A) Equilibrium price and quantity both increased.
B) Equilibrium price and quantity both decreased.
C) Equilibrium price increased, and equilibrium quantity decreased.
D) Equilibrium price decreased, and equilibrium quantity increased.
A) Equilibrium price and quantity both increased.
B) Equilibrium price and quantity both decreased.
C) Equilibrium price increased, and equilibrium quantity decreased.
D) Equilibrium price decreased, and equilibrium quantity increased.
Unlock Deck
Unlock for access to all 77 flashcards in this deck.
Unlock Deck
k this deck
56
Suppose there is an increase in the supply of a good.Which of the following statements is true?
A) The closer the demand curve is to being vertical, the larger the decrease in equilibrium price, and the smaller the increase in equilibrium quantity.
B) The closer the demand curve is to being horizontal, the larger the decrease in equilibrium price, and the smaller the increase in equilibrium quantity.
C) The closer the demand curve is to being vertical, the smaller the decrease in equilibrium price, and the larger the increase in equilibrium quantity.
D) The closer the demand curve is to being vertical, the larger the increase in equilibrium price, and the smaller the decrease in equilibrium quantity.
Unlock Deck
Unlock for access to all 77 flashcards in this deck.
Unlock Deck
k this deck
57
Demand is said to be perfectly inelastic when:
A) the demand curve is horizontal.
B) the elasticity of demand is infinite.
C) the elasticity of demand is zero.
D) consumers are highly responsive to change in the price of a good.
A) the demand curve is horizontal.
B) the elasticity of demand is infinite.
C) the elasticity of demand is zero.
D) consumers are highly responsive to change in the price of a good.
Unlock Deck
Unlock for access to all 77 flashcards in this deck.
Unlock Deck
k this deck
58
If the demand for a good increases at the same time the supply of the good decreases,what happens to equilibrium price and quantity?
A) Equilibrium quantity increases, but the effect on equilibrium price is ambiguous.
B) Equilibrium quantity decreases, but the effect on equilibrium price is ambiguous.
C) Equilibrium price increases, but the effect on equilibrium quantity is ambiguous.
D) Equilibrium price decreases, but the effect on equilibrium quantity is ambiguous.
Unlock Deck
Unlock for access to all 77 flashcards in this deck.
Unlock Deck
k this deck
59
What can cause the equilibrium quantity of a good to fall?
A) An increase in demand or an increase in supply
B) A decrease in demand or a decrease in supply
C) An increase in demand or a decrease in supply
D) A decrease in demand or an increase in supply
A) An increase in demand or an increase in supply
B) A decrease in demand or a decrease in supply
C) An increase in demand or a decrease in supply
D) A decrease in demand or an increase in supply
Unlock Deck
Unlock for access to all 77 flashcards in this deck.
Unlock Deck
k this deck
60
According to Table 2.1,which presents hypothetical data on price elasticity of demand,which of the following would be true if the price of all four goods were to increase by 3%?
A) The quantity of car repairs demanded would decrease by a smaller percentage than would the quantity of bread demanded.
B) The quantity of car repairs demanded would increase by a smaller percentage than would the quantity of lamb demanded.
C) The quantity of electricity demanded would decrease by a smaller percentage than would the quantity of lamb demanded.
D) The quantity of electricity demanded would increase by a smaller percentage than would the quantity of bread demanded.
Unlock Deck
Unlock for access to all 77 flashcards in this deck.
Unlock Deck
k this deck
61
According to the text,which of the following statements is true?
A) The price elasticity of Honda Accords exceeds the price elasticity of demand for BMWs.
B) The price elasticity of BMWs exceeds the price elasticity of demand for Honda Accords.
C) The cross-price elasticity of demand for Hondas and BMWs is relatively large.
D) The income elasticity of demand for BMWs is negative.
Unlock Deck
Unlock for access to all 77 flashcards in this deck.
Unlock Deck
k this deck
62
Recall that a linear demand curve has the form Q = A - BP,where P is price and A and B are positive numbers.Suppose that when price is $5 the amount demanded is 100 and the elasticity of demand is -2.What are the values of A and B?
Unlock Deck
Unlock for access to all 77 flashcards in this deck.
Unlock Deck
k this deck
63
Suppose that an increase in oil prices causes the supply curve of gasoline to shift.Using a graph,illustrate the resulting changes in equilibrium price and quantity in both the short run and the long run.
Unlock Deck
Unlock for access to all 77 flashcards in this deck.
Unlock Deck
k this deck
64
If a firm knows that the demand for its product is inelastic,it could generate more revenue by:
A) lowering the price, because the resulting change in sales would be relatively large.
B) raising the price, because the resulting change in sales would be relatively large.
C) lowering the price, because the resulting change in sales would be relatively small.
D) raising the price, because the resulting change in sales would be relatively small.
Unlock Deck
Unlock for access to all 77 flashcards in this deck.
Unlock Deck
k this deck
65
Along a straight-line demand curve:
A) both the slope and the price elasticity are constant.
B) the slope is constant but the price elasticity is not.
C) the slope is not constant, but the price elasticity is.
D) neither the slope nor the price elasticity is constant.
A) both the slope and the price elasticity are constant.
B) the slope is constant but the price elasticity is not.
C) the slope is not constant, but the price elasticity is.
D) neither the slope nor the price elasticity is constant.
Unlock Deck
Unlock for access to all 77 flashcards in this deck.
Unlock Deck
k this deck
66
Refer to Table 2.2,which presents hypothetical data on cross-price elasticity of demand estimates.Which goods are the best substitutes?
A) Coke and Pepsi
B) Hard Liquor and Beer
C) Beef and Chicken
D) Cheese and Butter
A) Coke and Pepsi
B) Hard Liquor and Beer
C) Beef and Chicken
D) Cheese and Butter
Unlock Deck
Unlock for access to all 77 flashcards in this deck.
Unlock Deck
k this deck
67
Suppose bad weather destroys a significant portion of the nations' corn crop.Will total expenditures on corn increase or decrease? Illustrate your answer with a graph.
Unlock Deck
Unlock for access to all 77 flashcards in this deck.
Unlock Deck
k this deck
68
In general,supply curves with an elasticity of supply between 0 and 1 are referred to as:
A) inelastic.
B) elastic.
C) perfectly elastic.
D) perfectly inelastic.
A) inelastic.
B) elastic.
C) perfectly elastic.
D) perfectly inelastic.
Unlock Deck
Unlock for access to all 77 flashcards in this deck.
Unlock Deck
k this deck
69
Suppose that when the price of hot dogs is $2 per package,there is a demand for 10,000 bags of hot dog buns.When the price of hot dogs is $3 per package,the demand for hot dog buns falls to 8,000 bags.What is the cross-price elasticity of demand for hot dogs and hot dog buns?
A) -0.4
B) -0.25
C) 4
D) 0.25
A) -0.4
B) -0.25
C) 4
D) 0.25
Unlock Deck
Unlock for access to all 77 flashcards in this deck.
Unlock Deck
k this deck
70
Suppose the demand function for the Toyota Camry is given by Qd = 500 - 12PC + 10PH - 5PG + 0.0001M,where PC is the price of the Toyota Camry (in thousands),PH is the price of the Honda Accord (in thousands),PG is the price of gas (per gallon)and M is income.Further,suppose the supply curve for the Toyota Camry is given by Qs = 20PC - 55.
a.What is the demand curve for the Toyota Camry if the price of the Accord is $25,000,gas is $2 per gallon and income is $50,000?
b.What is the equilibrium price and quantity in the market for Toyota Camrys?
c.Is demand elastic or inelastic at the equilibrium price?
d.What is the cross price elasticity of demand between Camrys and Accords at equilibrium?
e.What is the income elasticity of demand for Camrys at equilibrium?
Unlock Deck
Unlock for access to all 77 flashcards in this deck.
Unlock Deck
k this deck
71
Why are total expenditures on a good maximized at the point on the demand curve where the price elasticity of demand equals -1? Explain your answer using the appropriate algebra.
Unlock Deck
Unlock for access to all 77 flashcards in this deck.
Unlock Deck
k this deck
72
An inferior good is characterized by:
A) a positive income elasticity of demand.
B) a negative income elasticity of demand.
C) a negative price elasticity of demand.
D) a positive price elasticity of demand.
A) a positive income elasticity of demand.
B) a negative income elasticity of demand.
C) a negative price elasticity of demand.
D) a positive price elasticity of demand.
Unlock Deck
Unlock for access to all 77 flashcards in this deck.
Unlock Deck
k this deck
73
When the demand curve shifts,the ____ elastic the supply curve at the initial equilibrium price,the _____ the change in equilibrium price and the ______ the change in equilibrium quantity.
A) more; larger; smaller
B) less; larger; smaller
C) more; larger; larger
D) less; smaller; larger
A) more; larger; smaller
B) less; larger; smaller
C) more; larger; larger
D) less; smaller; larger
Unlock Deck
Unlock for access to all 77 flashcards in this deck.
Unlock Deck
k this deck
74
Using a graph,explain how an increase in technology will affect the equilibrium price and quantity of DVD players.Again using a graph,explain what happens in the market for video cassette recorders.
Unlock Deck
Unlock for access to all 77 flashcards in this deck.
Unlock Deck
k this deck
75
Complements are characterized by:
A) negative cross-price elasticity of demand.
B) positive cross-price elasticity of demand.
C) cross-price elasticity of demand equal to zero.
D) cross price elasticity of demand equal to -1.
A) negative cross-price elasticity of demand.
B) positive cross-price elasticity of demand.
C) cross-price elasticity of demand equal to zero.
D) cross price elasticity of demand equal to -1.
Unlock Deck
Unlock for access to all 77 flashcards in this deck.
Unlock Deck
k this deck
76
What is the difference between a change in demand and a change in the quantity demanded of a good? Illustrate you answer using carefully labeled graphs.
Unlock Deck
Unlock for access to all 77 flashcards in this deck.
Unlock Deck
k this deck
77
Total expenditures on a company's product will be largest when it is priced such that the elasticity of demand:
A) equals -1.
B) is greater than -1.
C) is less than -1.
D) equals 0.
A) equals -1.
B) is greater than -1.
C) is less than -1.
D) equals 0.
Unlock Deck
Unlock for access to all 77 flashcards in this deck.
Unlock Deck
k this deck
Unlock Deck
Unlock for access to all 77 flashcards in this deck.


