Deck 19: Statistical Process Control and Quality Management
Full screen (f)
Question
Samples of 200 parts were taken every day and the number of defectives was counted. What are the upper and lower limits for the percent defective chart? 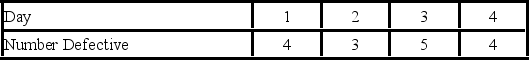
A)0.02 and 0
B)0.2970 and 0
C)0.0297 and 0
D)0.0497 and 0
A)0.02 and 0
B)0.2970 and 0
C)0.0297 and 0
D)0.0497 and 0
Question
Question
Question
Question
Question
Question
Question
Question
Question
Question
Question
Question
Question
Question
Question
Question
Question
Question
Question
Question
Question
Question
Question
Question
Question
Question
Question
Question
Question
Question
Question
Question
Question
Question
Question
Question
Question
Question
Question
Question
A new machine is set or calibrated to fill tubes of toothpaste at precisely 6.75 ounces. Then,once the machine is running,a sample of six tubes is taken every three hours and weighed with the following results:  What is the mean range?
A)0.000
B)0.160
C)0.080
D)0.203
What is the mean range?A)0.000
B)0.160
C)0.080
D)0.203
Question
A new machine is set or calibrated to fill tubes of toothpaste at precisely 6.75 ounces. Then,once the machine is running,a sample of six tubes is taken every three hours and weighed with the following results:  What is the value for the lower control limit (LCL)of the range?
A)0.00
B)0.080
C)0.186
D)0.203
What is the value for the lower control limit (LCL)of the range?A)0.00
B)0.080
C)0.186
D)0.203
Question
A new machine is set or calibrated to fill tubes of toothpaste at precisely 6.75 ounces. Then,once the machine is running,a sample of six tubes is taken every three hours and weighed with the following results:  What is the value of the upper control factor of the range?
A)0
B)2.115
C)2.004
D)3.0
What is the value of the upper control factor of the range?A)0
B)2.115
C)2.004
D)3.0
Question
A new machine is set or calibrated to fill tubes of toothpaste at precisely 6.75 ounces. Then,once the machine is running,a sample of six tubes is taken every three hours and weighed with the following results:  What is the upper control limit (UCL)for the mean?
A)6.738
B)6.999
C)6.779
D)7.221
What is the upper control limit (UCL)for the mean?A)6.738
B)6.999
C)6.779
D)7.221
Question
A new machine is set or calibrated to fill tubes of toothpaste at precisely 6.75 ounces. Then,once the machine is running,a sample of six tubes is taken every three hours and weighed with the following results:  What is X-bar for 7 pm?
A)6.71
B)6.72
C)6.74
D)6.76
What is X-bar for 7 pm?A)6.71
B)6.72
C)6.74
D)6.76
Question
A new machine is set or calibrated to fill tubes of toothpaste at precisely 6.75 ounces. Then,once the machine is running,a sample of six tubes is taken every three hours and weighed with the following results:  What is the value of A2,the control limit factor for averages?
A)0
B)1
C)0.577
D)0.483
What is the value of A2,the control limit factor for averages?A)0
B)1
C)0.577
D)0.483
Question
A new machine is set or calibrated to fill tubes of toothpaste at precisely 6.75 ounces. Then,once the machine is running,a sample of six tubes is taken every three hours and weighed with the following results:  What is the range of the samples at 7 am?
A)0.05
B)0.06
C)0.11
D)0.12
What is the range of the samples at 7 am?A)0.05
B)0.06
C)0.11
D)0.12
Question
A new machine used in the production of motor mount bolts was put into operation. Five samples of size 100 were randomly selected and the number of defectives in each sample was noted.  What is the LCL?
A)0%
B)−2.2%
C)4.8%
D)1.6%
What is the LCL?A)0%
B)−2.2%
C)4.8%
D)1.6%
Question
Question
A new machine is set or calibrated to fill tubes of toothpaste at precisely 6.75 ounces. Then,once the machine is running,a sample of six tubes is taken every three hours and weighed with the following results:  What is X-bar for 7 am?
A)6.72
B)6.74
C)6.78
D)6.80
What is X-bar for 7 am?A)6.72
B)6.74
C)6.78
D)6.80
Question
Question
Question
A new machine that fills tubes of toothpaste will be monitored using statistical process control. The following data were collected while the machine was closely monitored and under control. Each day a random sample of six tubes are weighed. Based on the data,the process mean is 6.752.  What is the lower control limit for the x-bar chart rounded to three decimal places?
A)6.816
B)6.676
C)6.688
D)6.828
What is the lower control limit for the x-bar chart rounded to three decimal places?A)6.816
B)6.676
C)6.688
D)6.828
Question
Random samples of four items are selected from a manufacturing process at regular intervals and a certain quality characteristic is measured. After 25 samples,  = 15,350 and
  = 411.4. How many samples were collected?
A)4
B)25
C)100
D)20
= 15,350 and = 411.4. How many samples were collected?A)4
B)25
C)100
D)20
Question
Question
A new machine used in the production of motor mount bolts was put into operation. Five samples of size 100 were randomly selected and the number of defectives in each sample was noted.  What is the UCL?
A)6.7%
B)7.4%
C)8.1%
D)100%
What is the UCL?A)6.7%
B)7.4%
C)8.1%
D)100%
Question
Question
A new machine is set or calibrated to fill tubes of toothpaste at precisely 6.75 ounces. Then,once the machine is running,a sample of six tubes is taken every three hours and weighed with the following results:  What is the value of the lower control factor of the range?
A)0
B)2.115
C)2.004
D)3.0
What is the value of the lower control factor of the range?A)0
B)2.115
C)2.004
D)3.0
Question
A new machine is set or calibrated to fill tubes of toothpaste at precisely 6.75 ounces. Then,once the machine is running,a sample of six tubes is taken every three hours and weighed with the following results:  What is the range of the samples at 4 pm?
A)0.05
B)0.06
C)0.11
D)0.12
What is the range of the samples at 4 pm?A)0.05
B)0.06
C)0.11
D)0.12
Question
A new machine used in the production of motor mount bolts was put into operation. Five samples of size 100 were randomly selected and the number of defectives in each sample was noted.  What is the average percent defective?
A)2.0%
B)2.3%
C)2.6%
D)2.9%
What is the average percent defective?A)2.0%
B)2.3%
C)2.6%
D)2.9%
Question
Question
Question
Question
Question
Question
Question
Question
A new machine used in the production of motor mount bolts was put into operation. Five samples of size 100 were randomly selected and the number of defectives in each sample was noted.  The measurement of quality is based on ________.
A)an attribute
B)a variable
C)a scale
D)a chart
The measurement of quality is based on ________.A)an attribute
B)a variable
C)a scale
D)a chart
Question
Question
Question
Question
Question
Question
Question
Question
Question
A new machine is set or calibrated to fill tubes of toothpaste at precisely 6.75 ounces. Then,once the machine is running,a sample of six tubes is taken every three hours and weighed with the following results:  The measurement of quality is based on ________.
A)an attribute
B)a variable
C)a scale
D)a chart
The measurement of quality is based on ________.A)an attribute
B)a variable
C)a scale
D)a chart
Question
Question
Question

Unlock Deck
Sign up to unlock the cards in this deck!
Unlock Deck
Unlock Deck
1/82
Play
Full screen (f)
Deck 19: Statistical Process Control and Quality Management
1
Samples of 200 parts were taken every day and the number of defectives was counted. What are the upper and lower limits for the percent defective chart?
A)0.02 and 0
B)0.2970 and 0
C)0.0297 and 0
D)0.0497 and 0
A)0.02 and 0
B)0.2970 and 0
C)0.0297 and 0
D)0.0497 and 0
0.0497 and 0
2
What is usually developed to evaluate a sampling plan?
A)Frequency polygon
B)Scatter diagram
C)Operating characteristic curve
D)Simple bar chart
A)Frequency polygon
B)Scatter diagram
C)Operating characteristic curve
D)Simple bar chart
Operating characteristic curve
3
A c-bar chart shows the percent of the production that is defective.
False
4
Pareto charts are based on the 80-20 rule,which says 80% of the factors cause 20% of the problem.
Unlock Deck
Unlock for access to all 82 flashcards in this deck.
Unlock Deck
k this deck
5
Quality control charts indicate whether a production process is in control or out of control.
Unlock Deck
Unlock for access to all 82 flashcards in this deck.
Unlock Deck
k this deck
6
Mean charts are designed to determine whether a process is in or out of control based on sample means.
Unlock Deck
Unlock for access to all 82 flashcards in this deck.
Unlock Deck
k this deck
7
In acceptance sampling,there is one unique operating characteristic curve for a specified sampling plan.
Unlock Deck
Unlock for access to all 82 flashcards in this deck.
Unlock Deck
k this deck
8
The purpose of a statistical quality control chart is to identify when assignable causes of variation have entered the production system so that the cause may be identified and corrected.
Unlock Deck
Unlock for access to all 82 flashcards in this deck.
Unlock Deck
k this deck
9
A subassembly is inspected and the number of defects recorded. A new group of assemblers began work Monday morning. The number of defects per subassembly for the first 10 they produced was: 3,2,0,5,4,6,0,7,7,and 6. What are the upper and lower limits for the c-bar chart?
A)15 and 0
B)10 and 0
C)1.12 and 0
D)6 and −2
A)15 and 0
B)10 and 0
C)1.12 and 0
D)6 and −2
Unlock Deck
Unlock for access to all 82 flashcards in this deck.
Unlock Deck
k this deck
10
Percent defective charts,which are also known as p-charts,show the percent of the production that is or is not acceptable.
Unlock Deck
Unlock for access to all 82 flashcards in this deck.
Unlock Deck
k this deck
11
Which probability distribution is used to develop a percent defective chart?
A)Normal distribution
B)Chi-square distribution
C)Poisson distribution
D)Binomial distribution
A)Normal distribution
B)Chi-square distribution
C)Poisson distribution
D)Binomial distribution
Unlock Deck
Unlock for access to all 82 flashcards in this deck.
Unlock Deck
k this deck
12
In acceptance sampling,usually 100% of the incoming lot is checked.
Unlock Deck
Unlock for access to all 82 flashcards in this deck.
Unlock Deck
k this deck
13
These are examples of attributes: the width of a cracked weld; the length of time that a relay works; the amount of water in a radiator; the diameter of a tire.
Unlock Deck
Unlock for access to all 82 flashcards in this deck.
Unlock Deck
k this deck
14
Which probability distribution is used to develop a control chart for sample means?
A)Normal distribution
B)Chi-square distribution
C)Poisson distribution
D)Binomial distribution
A)Normal distribution
B)Chi-square distribution
C)Poisson distribution
D)Binomial distribution
Unlock Deck
Unlock for access to all 82 flashcards in this deck.
Unlock Deck
k this deck
15
One purpose of quality control is to reduce the costs associated with producing and delivering poor quality goods and services.
Unlock Deck
Unlock for access to all 82 flashcards in this deck.
Unlock Deck
k this deck
16
Assignable causes are usually large in number and random in nature,and they cannot be entirely eliminated.
Unlock Deck
Unlock for access to all 82 flashcards in this deck.
Unlock Deck
k this deck
17
There are two general types of causes of variations in manufacturing and service processes: chance and assignable causes.
Unlock Deck
Unlock for access to all 82 flashcards in this deck.
Unlock Deck
k this deck
18
Control charts can be developed for both variables and attributes.
Unlock Deck
Unlock for access to all 82 flashcards in this deck.
Unlock Deck
k this deck
19
In acceptance sampling,if the number of defects in a sample is less than or equal to the acceptance number,then the incoming lot is accepted.
Unlock Deck
Unlock for access to all 82 flashcards in this deck.
Unlock Deck
k this deck
20
A fishbone diagram is used to determine if a process is out of control.
Unlock Deck
Unlock for access to all 82 flashcards in this deck.
Unlock Deck
k this deck
21
In a control chart,expected variation is defined by the ________.
A)standard deviation
B)standard error of the distribution
C)upper control limits only
D)upper and lower control limits
A)standard deviation
B)standard error of the distribution
C)upper control limits only
D)upper and lower control limits
Unlock Deck
Unlock for access to all 82 flashcards in this deck.
Unlock Deck
k this deck
22
A sampling plan states that if 20 incoming bolts are checked and 2 or less defective bolts are discovered,the lot will be rejected. If an incoming lot is 10 percent defective,what is the probability of rejecting the lot?
A)0
B)1
C)0.323
D)0.667
A)0
B)1
C)0.323
D)0.667
Unlock Deck
Unlock for access to all 82 flashcards in this deck.
Unlock Deck
k this deck
23
The upper and lower control limits are usually set ________.
A)at the mean
B)above the mean
C)at three standard deviations from the mean
D)at two standard deviations from the mean
A)at the mean
B)above the mean
C)at three standard deviations from the mean
D)at two standard deviations from the mean
Unlock Deck
Unlock for access to all 82 flashcards in this deck.
Unlock Deck
k this deck
24
A sampling plan states that if 20 incoming transistors are checked and 2 or less defects are found,the lot is accepted. If an incoming lot is 10 percent defective,what is the probability of accepting the lot of transistors?
A)0
B)1
C)0.677
D)0.333
A)0
B)1
C)0.677
D)0.333
Unlock Deck
Unlock for access to all 82 flashcards in this deck.
Unlock Deck
k this deck
25
What is the process that ensures that a company is producing a quality product or service?
A)Six Sigma
B)Pareto analysis
C)Fishbone chart analysis
D)Diagnostic chart
A)Six Sigma
B)Pareto analysis
C)Fishbone chart analysis
D)Diagnostic chart
Unlock Deck
Unlock for access to all 82 flashcards in this deck.
Unlock Deck
k this deck
26
The Quality Assurance Department selected 12 samples of 100 printed circuit boards and tested them. The number of defective printed circuit boards in each sample was 3,3,0,5,1,1,5,6,6,2,0,and 1. What kind of control chart should be constructed to monitor the process?
A)Mean chart
B)Range chart
C)Percent defective chart
D)c-bar chart
A)Mean chart
B)Range chart
C)Percent defective chart
D)c-bar chart
Unlock Deck
Unlock for access to all 82 flashcards in this deck.
Unlock Deck
k this deck
27
What process investigates the potential causes of an outcome or effect such as poor quality?
A)SPC
B)Pareto analysis
C)Fishbone chart analysis
D)Diagnostic chart
A)SPC
B)Pareto analysis
C)Fishbone chart analysis
D)Diagnostic chart
Unlock Deck
Unlock for access to all 82 flashcards in this deck.
Unlock Deck
k this deck
28
Control charts are used to determine if a process is ________.
A)in or out of control
B)measurable
C)fixable
D)testable
A)in or out of control
B)measurable
C)fixable
D)testable
Unlock Deck
Unlock for access to all 82 flashcards in this deck.
Unlock Deck
k this deck
29
The Quality Assurance Department selected a sample of 12 printed circuit boards and tested them. The number of defects in each circuit board was 3,3,0,5,1,1,5,6,6,2,0,and 1. What kind of control chart should be constructed to monitor the process?
A)Mean chart
B)Range chart
C)Percent defective chart
D)c-bar chart
A)Mean chart
B)Range chart
C)Percent defective chart
D)c-bar chart
Unlock Deck
Unlock for access to all 82 flashcards in this deck.
Unlock Deck
k this deck
30
The technique that tallies types of defects and their frequency is called ________.
A)range charts
B)Pareto analysis
C)control charts
D)fishbone diagram
A)range charts
B)Pareto analysis
C)control charts
D)fishbone diagram
Unlock Deck
Unlock for access to all 82 flashcards in this deck.
Unlock Deck
k this deck
31
Which probability distribution is used to develop an operating characteristic curve?
A)Normal distribution
B)Chi-square distribution
C)Poisson distribution
D)Binomial distribution
A)Normal distribution
B)Chi-square distribution
C)Poisson distribution
D)Binomial distribution
Unlock Deck
Unlock for access to all 82 flashcards in this deck.
Unlock Deck
k this deck
32
A fishbone diagram classifies potential causes into categories. What are they?
A)Chance and assignable variation
B)Methods,materials,equipment,and personnel
C)Percent defective and percent nondefective
D)Causes and effects
A)Chance and assignable variation
B)Methods,materials,equipment,and personnel
C)Percent defective and percent nondefective
D)Causes and effects
Unlock Deck
Unlock for access to all 82 flashcards in this deck.
Unlock Deck
k this deck
33
If a company reports that its quarterly earnings will be between $100 million and $125 million,the range is an example of ________ variation.
A)chance
B)external
C)assignable
D)controlled
A)chance
B)external
C)assignable
D)controlled
Unlock Deck
Unlock for access to all 82 flashcards in this deck.
Unlock Deck
k this deck
34
What type of variation can be reduced,or even eliminated,and is usually nonrandom in nature?
A)Chance
B)External
C)Assignable
D)Covariation
A)Chance
B)External
C)Assignable
D)Covariation
Unlock Deck
Unlock for access to all 82 flashcards in this deck.
Unlock Deck
k this deck
35
If a company reports that its quarterly earnings will be between $100 million and $125 million depending on the consumer demand,consumer demand is an example of ________ variation.
A)chance
B)external
C)assignable
D)standard
A)chance
B)external
C)assignable
D)standard
Unlock Deck
Unlock for access to all 82 flashcards in this deck.
Unlock Deck
k this deck
36
Cappelli Inc. designs and manufactures women's apparel using material from various mills. Their acceptance sampling plan states that 20 two-inch squares of the incoming material must be carefully checked. If 3 or less squares reveal imperfections,the lot is accepted. What is the probability that an incoming lot from Blufton Mills that contains 40 percent imperfect cloth will be accepted?
A)0
B)0.239
C)0.016
D)0.0024
A)0
B)0.239
C)0.016
D)0.0024
Unlock Deck
Unlock for access to all 82 flashcards in this deck.
Unlock Deck
k this deck
37
The cause-and-effect chart is an example of a ________.
A)range chart
B)Pareto chart
C)control chart
D)fishbone diagram
A)range chart
B)Pareto chart
C)control chart
D)fishbone diagram
Unlock Deck
Unlock for access to all 82 flashcards in this deck.
Unlock Deck
k this deck
38
A chart used to show the results of a Pareto analysis is a ________.
A)range chart
B)bar chart
C)control chart
D)fishbone diagram
A)range chart
B)bar chart
C)control chart
D)fishbone diagram
Unlock Deck
Unlock for access to all 82 flashcards in this deck.
Unlock Deck
k this deck
39
What chart helps to identify the relatively few factors that impact the performance of a manufacturing or service process?
A)SPC
B)Pareto analysis
C)Fishbone chart analysis
D)Diagnostic chart
A)SPC
B)Pareto analysis
C)Fishbone chart analysis
D)Diagnostic chart
Unlock Deck
Unlock for access to all 82 flashcards in this deck.
Unlock Deck
k this deck
40
Equipment failure would be an example of ________ variation.
A)chance
B)external
C)assignable
D)standard
A)chance
B)external
C)assignable
D)standard
Unlock Deck
Unlock for access to all 82 flashcards in this deck.
Unlock Deck
k this deck
41
A new machine is set or calibrated to fill tubes of toothpaste at precisely 6.75 ounces. Then,once the machine is running,a sample of six tubes is taken every three hours and weighed with the following results: What is the mean range?
A)0.000
B)0.160
C)0.080
D)0.203
What is the mean range?A)0.000
B)0.160
C)0.080
D)0.203
Unlock Deck
Unlock for access to all 82 flashcards in this deck.
Unlock Deck
k this deck
42
A new machine is set or calibrated to fill tubes of toothpaste at precisely 6.75 ounces. Then,once the machine is running,a sample of six tubes is taken every three hours and weighed with the following results: What is the value for the lower control limit (LCL)of the range?
A)0.00
B)0.080
C)0.186
D)0.203
What is the value for the lower control limit (LCL)of the range?A)0.00
B)0.080
C)0.186
D)0.203
Unlock Deck
Unlock for access to all 82 flashcards in this deck.
Unlock Deck
k this deck
43
A new machine is set or calibrated to fill tubes of toothpaste at precisely 6.75 ounces. Then,once the machine is running,a sample of six tubes is taken every three hours and weighed with the following results: What is the value of the upper control factor of the range?
A)0
B)2.115
C)2.004
D)3.0
What is the value of the upper control factor of the range?A)0
B)2.115
C)2.004
D)3.0
Unlock Deck
Unlock for access to all 82 flashcards in this deck.
Unlock Deck
k this deck
44
A new machine is set or calibrated to fill tubes of toothpaste at precisely 6.75 ounces. Then,once the machine is running,a sample of six tubes is taken every three hours and weighed with the following results: What is the upper control limit (UCL)for the mean?
A)6.738
B)6.999
C)6.779
D)7.221
What is the upper control limit (UCL)for the mean?A)6.738
B)6.999
C)6.779
D)7.221
Unlock Deck
Unlock for access to all 82 flashcards in this deck.
Unlock Deck
k this deck
45
A new machine is set or calibrated to fill tubes of toothpaste at precisely 6.75 ounces. Then,once the machine is running,a sample of six tubes is taken every three hours and weighed with the following results: What is X-bar for 7 pm?
A)6.71
B)6.72
C)6.74
D)6.76
What is X-bar for 7 pm?A)6.71
B)6.72
C)6.74
D)6.76
Unlock Deck
Unlock for access to all 82 flashcards in this deck.
Unlock Deck
k this deck
46
A new machine is set or calibrated to fill tubes of toothpaste at precisely 6.75 ounces. Then,once the machine is running,a sample of six tubes is taken every three hours and weighed with the following results: What is the value of A2,the control limit factor for averages?
A)0
B)1
C)0.577
D)0.483
What is the value of A2,the control limit factor for averages?A)0
B)1
C)0.577
D)0.483
Unlock Deck
Unlock for access to all 82 flashcards in this deck.
Unlock Deck
k this deck
47
A new machine is set or calibrated to fill tubes of toothpaste at precisely 6.75 ounces. Then,once the machine is running,a sample of six tubes is taken every three hours and weighed with the following results: What is the range of the samples at 7 am?
A)0.05
B)0.06
C)0.11
D)0.12
What is the range of the samples at 7 am?A)0.05
B)0.06
C)0.11
D)0.12
Unlock Deck
Unlock for access to all 82 flashcards in this deck.
Unlock Deck
k this deck
48
A new machine used in the production of motor mount bolts was put into operation. Five samples of size 100 were randomly selected and the number of defectives in each sample was noted. What is the LCL?
A)0%
B)−2.2%
C)4.8%
D)1.6%
What is the LCL?A)0%
B)−2.2%
C)4.8%
D)1.6%
Unlock Deck
Unlock for access to all 82 flashcards in this deck.
Unlock Deck
k this deck
49
Random samples of four items are selected from a manufacturing process at regular intervals and a certain quality characteristic is measured. After 25 samples,ΣX = 15,350 and ΣR = 411.4. To construct a mean chart,what is the value for R-bar used to compute the limits?
A)411.4
B)614
C)16.46
D)102.88
A)411.4
B)614
C)16.46
D)102.88
Unlock Deck
Unlock for access to all 82 flashcards in this deck.
Unlock Deck
k this deck
50
A new machine is set or calibrated to fill tubes of toothpaste at precisely 6.75 ounces. Then,once the machine is running,a sample of six tubes is taken every three hours and weighed with the following results: What is X-bar for 7 am?
A)6.72
B)6.74
C)6.78
D)6.80
What is X-bar for 7 am?A)6.72
B)6.74
C)6.78
D)6.80
Unlock Deck
Unlock for access to all 82 flashcards in this deck.
Unlock Deck
k this deck
51
Random samples of four items are selected from a manufacturing process at regular intervals,and a certain quality characteristic is measured. After 25 samples,ΣX = 15,350 and ΣR = 411.4. To construct a mean chart,what is the value for the centerline?
A)15,350
B)614
C)411.4
D)3837.5
A)15,350
B)614
C)411.4
D)3837.5
Unlock Deck
Unlock for access to all 82 flashcards in this deck.
Unlock Deck
k this deck
52
Random samples of four items are selected from a manufacturing process at regular intervals and a certain quality characteristic is measured. After 25 samples,ΣX = 15,350 and ΣR = 411.4. What is the sample size?
A)4
B)25
C)100
D)20
A)4
B)25
C)100
D)20
Unlock Deck
Unlock for access to all 82 flashcards in this deck.
Unlock Deck
k this deck
53
A new machine that fills tubes of toothpaste will be monitored using statistical process control. The following data were collected while the machine was closely monitored and under control. Each day a random sample of six tubes are weighed. Based on the data,the process mean is 6.752. What is the lower control limit for the x-bar chart rounded to three decimal places?
A)6.816
B)6.676
C)6.688
D)6.828
What is the lower control limit for the x-bar chart rounded to three decimal places?A)6.816
B)6.676
C)6.688
D)6.828
Unlock Deck
Unlock for access to all 82 flashcards in this deck.
Unlock Deck
k this deck
54
Random samples of four items are selected from a manufacturing process at regular intervals and a certain quality characteristic is measured. After 25 samples, = 15,350 and = 411.4. How many samples were collected?
A)4
B)25
C)100
D)20
= 15,350 and = 411.4. How many samples were collected?A)4
B)25
C)100
D)20
Unlock Deck
Unlock for access to all 82 flashcards in this deck.
Unlock Deck
k this deck
55
If the upper and lower control limits are set at ±3 standard deviations from the mean,we would expect that ________.
A)99.7% of the sample means are within the control limits
B)95% of the sample means are within the control limits
C)about 68% of the sample means are within the control limits
D)about 5% of the sample means are outside the control limits
A)99.7% of the sample means are within the control limits
B)95% of the sample means are within the control limits
C)about 68% of the sample means are within the control limits
D)about 5% of the sample means are outside the control limits
Unlock Deck
Unlock for access to all 82 flashcards in this deck.
Unlock Deck
k this deck
56
A new machine used in the production of motor mount bolts was put into operation. Five samples of size 100 were randomly selected and the number of defectives in each sample was noted. What is the UCL?
A)6.7%
B)7.4%
C)8.1%
D)100%
What is the UCL?A)6.7%
B)7.4%
C)8.1%
D)100%
Unlock Deck
Unlock for access to all 82 flashcards in this deck.
Unlock Deck
k this deck
57
Random samples of four items are selected from a manufacturing process at regular intervals and a certain quality characteristic is measured. After 25 samples,ΣX = 15,350 and ΣR = 411.4. To construct a mean chart,what is the upper control limit for the mean?
A)614.00
B)411.4
C)626.00
D)3837.5
A)614.00
B)411.4
C)626.00
D)3837.5
Unlock Deck
Unlock for access to all 82 flashcards in this deck.
Unlock Deck
k this deck
58
A new machine is set or calibrated to fill tubes of toothpaste at precisely 6.75 ounces. Then,once the machine is running,a sample of six tubes is taken every three hours and weighed with the following results: What is the value of the lower control factor of the range?
A)0
B)2.115
C)2.004
D)3.0
What is the value of the lower control factor of the range?A)0
B)2.115
C)2.004
D)3.0
Unlock Deck
Unlock for access to all 82 flashcards in this deck.
Unlock Deck
k this deck
59
A new machine is set or calibrated to fill tubes of toothpaste at precisely 6.75 ounces. Then,once the machine is running,a sample of six tubes is taken every three hours and weighed with the following results: What is the range of the samples at 4 pm?
A)0.05
B)0.06
C)0.11
D)0.12
What is the range of the samples at 4 pm?A)0.05
B)0.06
C)0.11
D)0.12
Unlock Deck
Unlock for access to all 82 flashcards in this deck.
Unlock Deck
k this deck
60
A new machine used in the production of motor mount bolts was put into operation. Five samples of size 100 were randomly selected and the number of defectives in each sample was noted. What is the average percent defective?
A)2.0%
B)2.3%
C)2.6%
D)2.9%
What is the average percent defective?A)2.0%
B)2.3%
C)2.6%
D)2.9%
Unlock Deck
Unlock for access to all 82 flashcards in this deck.
Unlock Deck
k this deck
61
A quality control chart is used to monitor the customer wait time at a local call center. Sample means of five times are averaged and plotted over time. The last 50 sample means are randomly distributed between the upper and lower control limits. The process is ________.
A)out of control
B)in control
C)improving
D)showing assignable variation
A)out of control
B)in control
C)improving
D)showing assignable variation
Unlock Deck
Unlock for access to all 82 flashcards in this deck.
Unlock Deck
k this deck
62
A quality control chart is used to monitor the customer wait time at a local call center. Sample means of five times are averaged and plotted over time. Over the last hundred sample means,no sample means were outside a control limit. The chart shows ________.
A)chance variation
B)standard variation
C)assignable variation
D)total variation
A)chance variation
B)standard variation
C)assignable variation
D)total variation
Unlock Deck
Unlock for access to all 82 flashcards in this deck.
Unlock Deck
k this deck
63
A large restaurant contracts with a local laundry to wash white napkins. The laundry returns the napkins in bundles of 100 napkins. The restaurant randomly samples 10 napkins from each bundle to make sure that the napkins are clean with no stains or other defects. By sampling only 10 of the napkins,the restaurant may conclude that all of the napkins are clean and use the bundle,even when the napkins are actually dirty and should not be used. This sampling risk is called ________.
A)producer's risk
B)uncertainty
C)consumer's risk
D)inspection risk
A)producer's risk
B)uncertainty
C)consumer's risk
D)inspection risk
Unlock Deck
Unlock for access to all 82 flashcards in this deck.
Unlock Deck
k this deck
64
A curve that graphs the percent defective versus the probability of accepting that percent defective is referred to as ________.
A)a percent defective chart
B)a range chart
C)an operating characteristic curve or OC curve
D)a c-bar chart
A)a percent defective chart
B)a range chart
C)an operating characteristic curve or OC curve
D)a c-bar chart
Unlock Deck
Unlock for access to all 82 flashcards in this deck.
Unlock Deck
k this deck
65
Consider a company that wishes to verify that an incoming product meets the stipulated requirements by screening the products using a statistical sampling plan. If the sample inspection reveals that a lot was accepted even though it had more defects than it should,this is referred to as ________.
A)a Type I error
B)producer's risk
C)consumer's risk
D)a sampling error
A)a Type I error
B)producer's risk
C)consumer's risk
D)a sampling error
Unlock Deck
Unlock for access to all 82 flashcards in this deck.
Unlock Deck
k this deck
66
Random samples of four items are selected from a manufacturing process at regular intervals and a certain quality characteristic is measured. After 25 samples,ΣX = 15,350 and ΣR = 411.4 The measurement of quality is based on ________.
A)an attribute
B)a variable
C)a scale
D)a chart
A)an attribute
B)a variable
C)a scale
D)a chart
Unlock Deck
Unlock for access to all 82 flashcards in this deck.
Unlock Deck
k this deck
67
Consider a situation where the lower control limit of a percent defective chart is negative. It must be that ________.
A)the absolute value of the negative LCL must be taken to arrive at a positive value
B)an error was made in computing the LCL because negative values are impossible
C)the process is out of control and must be redesigned
D)the lower limit is set to zero
A)the absolute value of the negative LCL must be taken to arrive at a positive value
B)an error was made in computing the LCL because negative values are impossible
C)the process is out of control and must be redesigned
D)the lower limit is set to zero
Unlock Deck
Unlock for access to all 82 flashcards in this deck.
Unlock Deck
k this deck
68
A new machine used in the production of motor mount bolts was put into operation. Five samples of size 100 were randomly selected and the number of defectives in each sample was noted. The measurement of quality is based on ________.
A)an attribute
B)a variable
C)a scale
D)a chart
The measurement of quality is based on ________.A)an attribute
B)a variable
C)a scale
D)a chart
Unlock Deck
Unlock for access to all 82 flashcards in this deck.
Unlock Deck
k this deck
69
Random samples of four items are selected from a manufacturing process at regular intervals and a certain quality characteristic is measured. After 25 samples,ΣX = 15,350 and ΣR = 411.4. To construct a mean chart,what is the LCL for the mean?
A)602.00
B)411.40
C)625.67
D)0.00
A)602.00
B)411.40
C)625.67
D)0.00
Unlock Deck
Unlock for access to all 82 flashcards in this deck.
Unlock Deck
k this deck
70
A large restaurant contracts with a local laundry to wash white napkins. The laundry returns the napkins in bundles of 100 napkins. The restaurant uses a sampling plan to make a decision to use the bundle of napkins or return the bundle to the laundry. The sampling plan uses a sample size of ten with a "number of rejects allowed" of one. If the number of dirty napkins in a sample of ten is two,what decision is made?
A)The sample of ten is returned to the laundry.
B)The bundle is returned to the laundry.
C)The bundle is accepted and used.
D)The good napkins from the sample are kept.
A)The sample of ten is returned to the laundry.
B)The bundle is returned to the laundry.
C)The bundle is accepted and used.
D)The good napkins from the sample are kept.
Unlock Deck
Unlock for access to all 82 flashcards in this deck.
Unlock Deck
k this deck
71
A diagnostic chart used to identify sources of variation,where the number and types of defects are tallied,is referred to as a(n)________.
A)fishbone diagram
B)X-bar chart
C)Pareto chart
D)process control chart
A)fishbone diagram
B)X-bar chart
C)Pareto chart
D)process control chart
Unlock Deck
Unlock for access to all 82 flashcards in this deck.
Unlock Deck
k this deck
72
The Quality Assurance Department selected 12 samples of 100 printed circuit boards and tested them. The number of defective printed circuit boards in each sample was 3,3,0,5,1,1,5,6,6,2,0,and 1. The measurement of quality is based on ________.
A)an attribute
B)a variable
C)a scale
D)a chart
A)an attribute
B)a variable
C)a scale
D)a chart
Unlock Deck
Unlock for access to all 82 flashcards in this deck.
Unlock Deck
k this deck
73
A large restaurant contracts with a local laundry to wash white napkins. The laundry returns the napkins in bundles of 100 napkins. The restaurant randomly samples 10 napkins to make sure that the napkins are clean with no stains or other defects. The restaurant is using a method called ________.
A)statistical process control
B)fishbone analysis
C)Pareto analysis
D)acceptance sampling
A)statistical process control
B)fishbone analysis
C)Pareto analysis
D)acceptance sampling
Unlock Deck
Unlock for access to all 82 flashcards in this deck.
Unlock Deck
k this deck
74
Random samples of four items are selected from a manufacturing process at regular intervals and a certain quality characteristic is measured. After 25 samples,ΣX = 15,350 and ΣR = 411.4. To construct a range chart,what is the UCL for the range?
A)37.553
B)411.400
C)0.000
D)102.850
A)37.553
B)411.400
C)0.000
D)102.850
Unlock Deck
Unlock for access to all 82 flashcards in this deck.
Unlock Deck
k this deck
75
A quality control chart is used to monitor the customer wait time at a local call center. Sample means of five times are averaged and plotted over time. Over the last hundred sample means,one sample mean was outside a control limit. The process is ________.
A)out of control
B)in control
C)highly variable
D)showing an assignable cause
A)out of control
B)in control
C)highly variable
D)showing an assignable cause
Unlock Deck
Unlock for access to all 82 flashcards in this deck.
Unlock Deck
k this deck
76
A quality control chart is used to monitor the customer wait time at a local call center. Sample means of five times are averaged and plotted over time. The last five sample means show a trend of increasing sample means. The process is ________.
A)out of control
B)in control
C)improving
D)showing chance variation
A)out of control
B)in control
C)improving
D)showing chance variation
Unlock Deck
Unlock for access to all 82 flashcards in this deck.
Unlock Deck
k this deck
77
A new machine is set or calibrated to fill tubes of toothpaste at precisely 6.75 ounces. Then,once the machine is running,a sample of six tubes is taken every three hours and weighed with the following results: The measurement of quality is based on ________.
A)an attribute
B)a variable
C)a scale
D)a chart
The measurement of quality is based on ________.A)an attribute
B)a variable
C)a scale
D)a chart
Unlock Deck
Unlock for access to all 82 flashcards in this deck.
Unlock Deck
k this deck
78
In acceptance sampling,the risk of accepting a poor-quality lot is known as ________.
A)consumer's risk
B)producer's risk
C)a Type I error
D)none of these answers is correct
A)consumer's risk
B)producer's risk
C)a Type I error
D)none of these answers is correct
Unlock Deck
Unlock for access to all 82 flashcards in this deck.
Unlock Deck
k this deck
79
A quality control chart is used to monitor the customer wait time at a local call center. Sample means of five times are averaged and plotted over time. The last five sample means show a trend of decreasing sample means. The process is ________.
A)out of control
B)in control
C)improving
D)showing chance variation
A)out of control
B)in control
C)improving
D)showing chance variation
Unlock Deck
Unlock for access to all 82 flashcards in this deck.
Unlock Deck
k this deck
80
Random samples of four items are selected from a manufacturing process at regular intervals and a certain quality characteristic is measured. After 25 samples,ΣX = 15,350 and ΣR = 411.4. To construct a range chart,what is the LCL for the range?
A)602.004
B)411.400
C)625.666
D)0.000
A)602.004
B)411.400
C)625.666
D)0.000
Unlock Deck
Unlock for access to all 82 flashcards in this deck.
Unlock Deck
k this deck
Unlock Deck
Unlock for access to all 82 flashcards in this deck.


