Deck 7: Human Populations
Full screen (f)
Question
Question
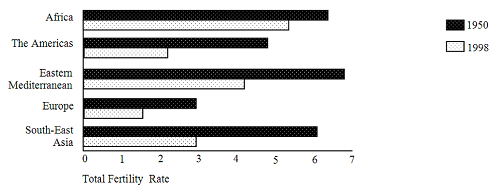
According to the graph, which region had the highest total fertility rate in 1998?
A)Africa
B)The Americas
C)Eastern Mediterranean
D)Europe
E)South-East Asia
Question
Question
Question
Question
Question
Question
Question
Question
Question
Question
Question
Question
Question
Question
Question
Question
Question
Question
Question

The histogram on the left represents a population whose birth rates
A)Have not changed for many years
B)Have recently decreased
C)Are gradually increasing
D)Are sharply increasing
E)None of these.Birth rates cannot be determined by the age class histogram
Question
The best title for the vertical axis on the graph is 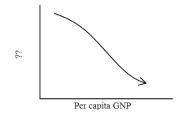
A)Life expectancy
B)Average dietary protein intake per day
C)Female literacy
D)Infant mortality
E)Rate of infectious diseases
A)Life expectancy
B)Average dietary protein intake per day
C)Female literacy
D)Infant mortality
E)Rate of infectious diseases
Question
Question
Question
Question
The age-class histogram on the left could represent the population of
A)China
B)Mexico
C)Uganda
D)India
E)Sweden
Question
Question
Question
The age-class histogram on the right could represent the population of
A)The United States
B)Western Europe
C)Uganda
D)Japan
E)Sweden
Question
Question
Question
Question
According to the graph, which region has the greatest fertility reduction?
A)Africa
B)The Americas
C)Eastern Mediterranean
D)Europe
E)South-East Asia
Question
According to the graph, which region has had the highest total fertility rate in 1950?
A)Africa
B)The Americas
C)Eastern Mediterranean
D)Europe
E)South-East Asia
Question
Question
Question
Question
A pyramid-shaped age structure histogram is characteristic of a(n) _________ population.
A)Stable
B)Expanding
C)Declining
D)Unpredictable
E)Diminishing
Question
The population represented by the age class histogram on the right will
A)Have a large population of old people soon
B)Not grow much in the coming years
C)Soon begin to decline
D)Grow substantially in the future
E)Grow slowly in the future
Question
Question
Use the following demographic data on three hypothetical countries
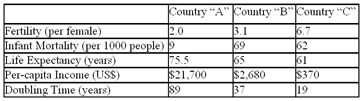
Country "C" probably has __________ rate of female literacy when compared to the other two countries.
A)The highest
B)An intermediate
C)The lowest
D)An equal
E)It is impossible to use the data in the table to identify the rate of female literacy
Country "C" probably has __________ rate of female literacy when compared to the other two countries.
A)The highest
B)An intermediate
C)The lowest
D)An equal
E)It is impossible to use the data in the table to identify the rate of female literacy
Question
Question
Question
Question
Question
Use the following demographic data on three hypothetical countries
Which of the following demographic categories best identifies Country "A"?
A)Developed
B)Moderately developed
C)Less developed
D)Developing
E)Third World
Which of the following demographic categories best identifies Country "A"?
A)Developed
B)Moderately developed
C)Less developed
D)Developing
E)Third World
Question
Question
Question
Question
Question
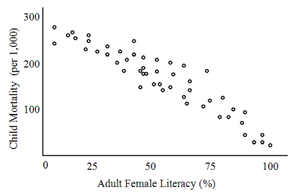
The graph indicates that there is
A)A strong relationship between infant mortality and education of women
B)Little relationship between infant mortality and education for women
C)A relationship between infant mortality and education in general
D)More importance for female rather than male education
E)A relationship between birth rate and education for women
Question
Question
Question
Use the following demographic data on three hypothetical countries
The most industrialized country listed is
A)Country "A"
B)Country "B"
C)Country "C"
D)None of the countries listed are likely to be industrialized
E)It is impossible to use the data in the table to identify an industrialized country
The most industrialized country listed is
A)Country "A"
B)Country "B"
C)Country "C"
D)None of the countries listed are likely to be industrialized
E)It is impossible to use the data in the table to identify an industrialized country
Question
Question
The graph indicates that more children die
A)In the last stage of demographic transition
B)In the first stage of demographic transition
C)When their mothers are illiterate
D)When their mothers are literate
E)When their mothers are poor
Question
Question
Question
Question
Question
Question
Question
Question
Question
Question

Unlock Deck
Sign up to unlock the cards in this deck!
Unlock Deck
Unlock Deck
1/66
Play
Full screen (f)
Deck 7: Human Populations
1
The zero population growth rate is slightly over two children per couple because
A)We always need slightly more young people
B)The older generation is dying
C)Some children die and some couples do not have children
D)That is as low as birth rates can reasonably be expected to get
E)The zero population growth rate is not slightly over two children per couple
A)We always need slightly more young people
B)The older generation is dying
C)Some children die and some couples do not have children
D)That is as low as birth rates can reasonably be expected to get
E)The zero population growth rate is not slightly over two children per couple
Some children die and some couples do not have children
2
According to the graph, which region had the highest total fertility rate in 1998?
A)Africa
B)The Americas
C)Eastern Mediterranean
D)Europe
E)South-East Asia
Africa
3
Malthus and Marx
A)Worked together to form their theories
B)Agreed about the root causes of overpopulation, poverty, and social upheaval
C)Disagreed about the root causes of overpopulation, poverty, and social upheaval
D)Held the same beliefs but worked on different issues
E)Disagreed about the severity of overpopulation, poverty, and social upheaval
Disagreed about the root causes of overpopulation, poverty, and social upheaval
4
Historically, up until the middle ages, populations were mostly limited by:
A)Low fertility rates
B)Culturally imposed family planning practices
C)Disease, famine and war
D)Religious restrictions on marriage
E)Infanticide
A)Low fertility rates
B)Culturally imposed family planning practices
C)Disease, famine and war
D)Religious restrictions on marriage
E)Infanticide
Unlock Deck
Unlock for access to all 66 flashcards in this deck.
Unlock Deck
k this deck
5
Most of the world's human settlements are clustered
A)In wide arable plains
B)In mountainous regions
C)Along coastlines and rivers
D)Between 30 and 50 degrees north latitude
E)In open valleys
A)In wide arable plains
B)In mountainous regions
C)Along coastlines and rivers
D)Between 30 and 50 degrees north latitude
E)In open valleys
Unlock Deck
Unlock for access to all 66 flashcards in this deck.
Unlock Deck
k this deck
6
Disastrous famines in the past 200 years
A)Prove conclusively that Malthus was right
B)Have mostly resulted from politics and economics rather than from overpopulation
C)Prove conclusively that Malthus was mistaken
D)Have resulted from population overshoots based on overuse of resources
E)Prove conclusively that Marx was mistaken
A)Prove conclusively that Malthus was right
B)Have mostly resulted from politics and economics rather than from overpopulation
C)Prove conclusively that Malthus was mistaken
D)Have resulted from population overshoots based on overuse of resources
E)Prove conclusively that Marx was mistaken
Unlock Deck
Unlock for access to all 66 flashcards in this deck.
Unlock Deck
k this deck
7
Neo-Malthusians argue that
A)Malthus's eighteenth century theories apply to similar circumstances today
B)We should never return to the conditions observed by Malthus in his day
C)Malthus could be useful today if reinterpreted
D)Malthus was wrong from the start
E)None of these represents the viewpoint of Neo-Malthusians
A)Malthus's eighteenth century theories apply to similar circumstances today
B)We should never return to the conditions observed by Malthus in his day
C)Malthus could be useful today if reinterpreted
D)Malthus was wrong from the start
E)None of these represents the viewpoint of Neo-Malthusians
Unlock Deck
Unlock for access to all 66 flashcards in this deck.
Unlock Deck
k this deck
8
The I = PAT formula says that our environmental impacts (I) are the product of
A)The population size times affluence and the amount of time it took for the population to reach its current size
B)The population size times affluence and the technology used to produce goods and services consumed
C)The population size times and the amount of technology used
D)The percentage of affluence times and the percentage of technology produced
E)None of the above is correct
Unlock Deck
Unlock for access to all 66 flashcards in this deck.
Unlock Deck
k this deck
9
Historical evidence shows that plagues and diseases:
A)Are highly effective at slowing population growth
B)Affect population growth for at least a century
C)Affect relatively few people in a population
D)Are devastating to human population growth
E)Cause only minor or temporary setbacks in population growth trends
A)Are highly effective at slowing population growth
B)Affect population growth for at least a century
C)Affect relatively few people in a population
D)Are devastating to human population growth
E)Cause only minor or temporary setbacks in population growth trends
Unlock Deck
Unlock for access to all 66 flashcards in this deck.
Unlock Deck
k this deck
10
____________ are the most widely distributed vertebrate organisms on Earth.
A)Fishes
B)Insects
C)Rodents
D)Birds
E)Humans
A)Fishes
B)Insects
C)Rodents
D)Birds
E)Humans
Unlock Deck
Unlock for access to all 66 flashcards in this deck.
Unlock Deck
k this deck
11
The population theory held by Thomas Malthus was that the human population would:
A)Never reach its environment's carrying capacity
B)Develop a modern utopia
C)Reach its environment's carrying capacity and then maintain equilibrium
D)Maintain equilibrium with its carrying capacity
E)Outstrip its resources, then suffer starvation and misery
A)Never reach its environment's carrying capacity
B)Develop a modern utopia
C)Reach its environment's carrying capacity and then maintain equilibrium
D)Maintain equilibrium with its carrying capacity
E)Outstrip its resources, then suffer starvation and misery
Unlock Deck
Unlock for access to all 66 flashcards in this deck.
Unlock Deck
k this deck
12
Ninety percent of the world's population growth in the next century is expected to occur in
A)Less-developed countries
B)China
C)Developed countries
D)Moderately developed nations
E)India
A)Less-developed countries
B)China
C)Developed countries
D)Moderately developed nations
E)India
Unlock Deck
Unlock for access to all 66 flashcards in this deck.
Unlock Deck
k this deck
13
The world human population reached about 1 billion in _________ and passed ____________ in 2011.
A)1400; 78 billion
B)1500; 1 trillion
C)1600; 78 million
D)1700; 7 million
E)1800; 7 billion
A)1400; 78 billion
B)1500; 1 trillion
C)1600; 78 million
D)1700; 7 million
E)1800; 7 billion
Unlock Deck
Unlock for access to all 66 flashcards in this deck.
Unlock Deck
k this deck
14
Malthus argued that ______________ is the ultimate cause of social and environmental problems, and Marx argued that population growth ____________ social and environmental problems.
A)Excess population growth; results from
B)Poverty; results from
C)War; results from
D)Excess population growth; is also the ultimate cause of
E)Poverty; is the ultimate cause of
A)Excess population growth; results from
B)Poverty; results from
C)War; results from
D)Excess population growth; is also the ultimate cause of
E)Poverty; is the ultimate cause of
Unlock Deck
Unlock for access to all 66 flashcards in this deck.
Unlock Deck
k this deck
15
Human population growth most closely resembles:
A)Carrying capacity geometric increase
B)Irruptive growth
C)Malthusian growth
D)S-shaped growth curve
E)J-shaped growth curve
A)Carrying capacity geometric increase
B)Irruptive growth
C)Malthusian growth
D)S-shaped growth curve
E)J-shaped growth curve
Unlock Deck
Unlock for access to all 66 flashcards in this deck.
Unlock Deck
k this deck
16
Demography is the science that describes
A)The earth's carrying capacity
B)Population changes and characteristics
C)Energy resources
D)Food production
E)Environmental factors that affect population sizes
A)The earth's carrying capacity
B)Population changes and characteristics
C)Energy resources
D)Food production
E)Environmental factors that affect population sizes
Unlock Deck
Unlock for access to all 66 flashcards in this deck.
Unlock Deck
k this deck
17
Crude birth rates are measured in terms of the number of children born
A)In a single year
B)Per family
C)Per family per year
D)Per 1,000 people each year
E)Per 1,000 people in the general population
A)In a single year
B)Per family
C)Per family per year
D)Per 1,000 people each year
E)Per 1,000 people in the general population
Unlock Deck
Unlock for access to all 66 flashcards in this deck.
Unlock Deck
k this deck
18
Why is Russia's population declining?
A)There is a one-child policy similar to the one in China and Thailand
B)There has been a massive education campaign to reduce births
C)The standard of living has decreased leading to lower infant mortality and lower birth rates
D)Russia's population is not declining
E)The standard of living has decreased leading to higher death rates and lower birth rates
Unlock Deck
Unlock for access to all 66 flashcards in this deck.
Unlock Deck
k this deck
19
Technological optimists argue that technological advances have:
A)Led to the increase in human population, but whether we can continue is of great concern
B)Proved Marx wrong in his predictions of famine and disaster
C)Proved Malthus wrong in his predictions of famine and disaster
D)Been developed because there are more people, supporting the view that more people are the "ultimate resource."
E)Been a neutral factor in the issue of population growth
Unlock Deck
Unlock for access to all 66 flashcards in this deck.
Unlock Deck
k this deck
20
Human ingenuity and intelligence as the "ultimate resource" is the central theme in the argument of
A)Julian Simon
B)John Muir
C)Thomas Malthus
D)Neo-Malthusians
E)Marxism
A)Julian Simon
B)John Muir
C)Thomas Malthus
D)Neo-Malthusians
E)Marxism
Unlock Deck
Unlock for access to all 66 flashcards in this deck.
Unlock Deck
k this deck
21
The histogram on the left represents a population whose birth rates
A)Have not changed for many years
B)Have recently decreased
C)Are gradually increasing
D)Are sharply increasing
E)None of these.Birth rates cannot be determined by the age class histogram
Unlock Deck
Unlock for access to all 66 flashcards in this deck.
Unlock Deck
k this deck
22
The best title for the vertical axis on the graph is
A)Life expectancy
B)Average dietary protein intake per day
C)Female literacy
D)Infant mortality
E)Rate of infectious diseases
A)Life expectancy
B)Average dietary protein intake per day
C)Female literacy
D)Infant mortality
E)Rate of infectious diseases
Unlock Deck
Unlock for access to all 66 flashcards in this deck.
Unlock Deck
k this deck
23
Which of the following factors does not usually affect the crude death rates of a population?
A)Health care
B)Sanitation
C)Age structure of the population
D)Nutrition
E)All of these affect crude death rates
A)Health care
B)Sanitation
C)Age structure of the population
D)Nutrition
E)All of these affect crude death rates
Unlock Deck
Unlock for access to all 66 flashcards in this deck.
Unlock Deck
k this deck
24
The main cause of world population growth in the past 300 years has been
A)Increasing fecundity
B)Rising fertility
C)Higher birthrates in developing countries
D)Increasing immigration
E) Falling mortality due to longer life expectancy.
A)Increasing fecundity
B)Rising fertility
C)Higher birthrates in developing countries
D)Increasing immigration
E) Falling mortality due to longer life expectancy.
Unlock Deck
Unlock for access to all 66 flashcards in this deck.
Unlock Deck
k this deck
25
A dependency ratio is a comparison between the numbers of
A)Working and nonworking people
B)Parents and children
C)Old people and young people
D)Young infants and older adults
E)Middle aged people and infants
A)Working and nonworking people
B)Parents and children
C)Old people and young people
D)Young infants and older adults
E)Middle aged people and infants
Unlock Deck
Unlock for access to all 66 flashcards in this deck.
Unlock Deck
k this deck
26
The age-class histogram on the left could represent the population of
A)China
B)Mexico
C)Uganda
D)India
E)Sweden
Unlock Deck
Unlock for access to all 66 flashcards in this deck.
Unlock Deck
k this deck
27
The doubling time for a population with an annual percentage growth rate of 7.0% is
A)1 year
B)5 years
C)10 years
D)50 years
E)100 years
A)1 year
B)5 years
C)10 years
D)50 years
E)100 years
Unlock Deck
Unlock for access to all 66 flashcards in this deck.
Unlock Deck
k this deck
28
Demographers usually measure mortality in terms of
A)Deaths per 1,000 persons per year
B)Deaths per person per year
C)The number of children who die per year
D)The total number of deaths per generation
E)Total deaths in a population per year
A)Deaths per 1,000 persons per year
B)Deaths per person per year
C)The number of children who die per year
D)The total number of deaths per generation
E)Total deaths in a population per year
Unlock Deck
Unlock for access to all 66 flashcards in this deck.
Unlock Deck
k this deck
29
The age-class histogram on the right could represent the population of
A)The United States
B)Western Europe
C)Uganda
D)Japan
E)Sweden
Unlock Deck
Unlock for access to all 66 flashcards in this deck.
Unlock Deck
k this deck
30
The difference between "total growth rate" and "natural increase" is that total growth rates
A)Include only the number of births and deaths
B)Include immigration and emigration as well as births and deaths
C)Include only immigration and emigration
D)Include infant mortality as well as adult deaths
E)Are not expressed as percentages
A)Include only the number of births and deaths
B)Include immigration and emigration as well as births and deaths
C)Include only immigration and emigration
D)Include infant mortality as well as adult deaths
E)Are not expressed as percentages
Unlock Deck
Unlock for access to all 66 flashcards in this deck.
Unlock Deck
k this deck
31
A population growing at one percent per year should double in about ___ years.
A)30
B)70
C)10
D)2
E)0.2
A)30
B)70
C)10
D)2
E)0.2
Unlock Deck
Unlock for access to all 66 flashcards in this deck.
Unlock Deck
k this deck
32
There is some evidence that population growth today is ____________ rather than ______________.
A)Slowing slightly; continuing to accelerate
B)Continuing to accelerate; slowing slightly
C)Increasing; leveling off
D)Leveling off; decreasing
E)Leveling off; slowing slightly
A)Slowing slightly; continuing to accelerate
B)Continuing to accelerate; slowing slightly
C)Increasing; leveling off
D)Leveling off; decreasing
E)Leveling off; slowing slightly
Unlock Deck
Unlock for access to all 66 flashcards in this deck.
Unlock Deck
k this deck
33
According to the graph, which region has the greatest fertility reduction?
A)Africa
B)The Americas
C)Eastern Mediterranean
D)Europe
E)South-East Asia
Unlock Deck
Unlock for access to all 66 flashcards in this deck.
Unlock Deck
k this deck
34
According to the graph, which region has had the highest total fertility rate in 1950?
A)Africa
B)The Americas
C)Eastern Mediterranean
D)Europe
E)South-East Asia
Unlock Deck
Unlock for access to all 66 flashcards in this deck.
Unlock Deck
k this deck
35
The total fertility rate is the number of children born
A)To the average woman per year
B)To the average woman during her lifetime
C)In the world during a single year
D)In a population during a single year
E)In a population during an entire generation
A)To the average woman per year
B)To the average woman during her lifetime
C)In the world during a single year
D)In a population during a single year
E)In a population during an entire generation
Unlock Deck
Unlock for access to all 66 flashcards in this deck.
Unlock Deck
k this deck
36
The average age that a newborn can expect to attain in a given society is referred to as
A)Life expectancy
B)Infant mortality
C)Life span
D)Survivorship
E)Life age
A)Life expectancy
B)Infant mortality
C)Life span
D)Survivorship
E)Life age
Unlock Deck
Unlock for access to all 66 flashcards in this deck.
Unlock Deck
k this deck
37
You were in a discussion with a classmate who complained that immigrants were taking away jobs and abusing social services.In response, another classmate who is a proponent of the open door policy explained that immigrants can actually be a bonus to a country.Someone supporting an open door policy would NOT use which of the following statements?
A)Immigrants are usually of a different racial or ethnic background and add cultural diversity
B)Immigrants usually perform dangerous work that citizens are unwilling to do
C)Immigrants usually perform work at a pay scale that citizens are unwilling to accept
D)Immigrants are usually welcomed by other immigrants or descendants of immigrants
E)All of these would probably be used by someone supporting an open door policy
Unlock Deck
Unlock for access to all 66 flashcards in this deck.
Unlock Deck
k this deck
38
A pyramid-shaped age structure histogram is characteristic of a(n) _________ population.
A)Stable
B)Expanding
C)Declining
D)Unpredictable
E)Diminishing
Unlock Deck
Unlock for access to all 66 flashcards in this deck.
Unlock Deck
k this deck
39
The population represented by the age class histogram on the right will
A)Have a large population of old people soon
B)Not grow much in the coming years
C)Soon begin to decline
D)Grow substantially in the future
E)Grow slowly in the future
Unlock Deck
Unlock for access to all 66 flashcards in this deck.
Unlock Deck
k this deck
40
Which of the following is NOT a factor contributing to decreased life expectancy?
A)Disease
B)Improved sanitation
C)Poverty
D)Famine
E)Warfare
A)Disease
B)Improved sanitation
C)Poverty
D)Famine
E)Warfare
Unlock Deck
Unlock for access to all 66 flashcards in this deck.
Unlock Deck
k this deck
41
Use the following demographic data on three hypothetical countries
Country "C" probably has __________ rate of female literacy when compared to the other two countries.
A)The highest
B)An intermediate
C)The lowest
D)An equal
E)It is impossible to use the data in the table to identify the rate of female literacy
Country "C" probably has __________ rate of female literacy when compared to the other two countries.
A)The highest
B)An intermediate
C)The lowest
D)An equal
E)It is impossible to use the data in the table to identify the rate of female literacy
Unlock Deck
Unlock for access to all 66 flashcards in this deck.
Unlock Deck
k this deck
42
Breast-feeding children for long periods
A)Is a luxury that mainly wealthy women enjoy
B)Increases fertility when caloric intake is low
C)Can be a successful population control strategy
D)Is a luxury that mainly wealthy women enjoy and it also limits fertility when caloric intake is low
E)Limits fertility when caloric intake is low and can be a successful population control strategy
Unlock Deck
Unlock for access to all 66 flashcards in this deck.
Unlock Deck
k this deck
43
Which of the following is considered a TRUE pronatalist pressure?
A)Legitimate needs for support in old age
B)The need for hands to help in farm work and to watch younger siblings
C)Macho pride in men who have many children
D)Woman's status determined by the number of children she has
E)All of these are correct
A)Legitimate needs for support in old age
B)The need for hands to help in farm work and to watch younger siblings
C)Macho pride in men who have many children
D)Woman's status determined by the number of children she has
E)All of these are correct
Unlock Deck
Unlock for access to all 66 flashcards in this deck.
Unlock Deck
k this deck
44
Women who ________ are LEAST likely to have many children.
A)Cannot afford children
B)Live where many children die young
C)Are subordinate to their husbands
D)Are able to earn an income for themselves
E)All of these are correct
A)Cannot afford children
B)Live where many children die young
C)Are subordinate to their husbands
D)Are able to earn an income for themselves
E)All of these are correct
Unlock Deck
Unlock for access to all 66 flashcards in this deck.
Unlock Deck
k this deck
45
The demographic transition refers to a country's change from
A)High birth and death rates to low birth and death rates
B)High to low birth rates and low to high death rates
C)Low to high birth rates and high to low death rates
D)A majority of young people to a majority of elderly people
E)A majority of elderly people to a majority of young people
A)High birth and death rates to low birth and death rates
B)High to low birth rates and low to high death rates
C)Low to high birth rates and high to low death rates
D)A majority of young people to a majority of elderly people
E)A majority of elderly people to a majority of young people
Unlock Deck
Unlock for access to all 66 flashcards in this deck.
Unlock Deck
k this deck
46
Use the following demographic data on three hypothetical countries
Which of the following demographic categories best identifies Country "A"?
A)Developed
B)Moderately developed
C)Less developed
D)Developing
E)Third World
Which of the following demographic categories best identifies Country "A"?
A)Developed
B)Moderately developed
C)Less developed
D)Developing
E)Third World
Unlock Deck
Unlock for access to all 66 flashcards in this deck.
Unlock Deck
k this deck
47
Which of the following is a mechanical barrier to conception?
A)Abortion
B)Condoms
C)Birth control pills
D)Vasectomies
E)IUD
A)Abortion
B)Condoms
C)Birth control pills
D)Vasectomies
E)IUD
Unlock Deck
Unlock for access to all 66 flashcards in this deck.
Unlock Deck
k this deck
48
"Birth dearths" can be a problem because they cause
A)Labor shortages
B)Military weakness
C)A decrease in workers
D)A decrease in taxpayers
E)All of these are correct
A)Labor shortages
B)Military weakness
C)A decrease in workers
D)A decrease in taxpayers
E)All of these are correct
Unlock Deck
Unlock for access to all 66 flashcards in this deck.
Unlock Deck
k this deck
49
Family planning means enabling people to
A)Have fewer children so that the population growth rate can reach ZPG
B)Have no children
C)Have many children
D)Decide in advance how many children they should have
E)Have more children if they live in a country with a birth dearth
A)Have fewer children so that the population growth rate can reach ZPG
B)Have no children
C)Have many children
D)Decide in advance how many children they should have
E)Have more children if they live in a country with a birth dearth
Unlock Deck
Unlock for access to all 66 flashcards in this deck.
Unlock Deck
k this deck
50
Which of the following is not required for a demographic transition to occur?
A)Increased confidence that children will survive to maturity
B)Improved standard of living
C)Improved social status of women
D)Increased military strength
E)Increased availability and use of birth control
A)Increased confidence that children will survive to maturity
B)Improved standard of living
C)Improved social status of women
D)Increased military strength
E)Increased availability and use of birth control
Unlock Deck
Unlock for access to all 66 flashcards in this deck.
Unlock Deck
k this deck
51
The graph indicates that there is
A)A strong relationship between infant mortality and education of women
B)Little relationship between infant mortality and education for women
C)A relationship between infant mortality and education in general
D)More importance for female rather than male education
E)A relationship between birth rate and education for women
Unlock Deck
Unlock for access to all 66 flashcards in this deck.
Unlock Deck
k this deck
52
Birth rate would tend to decrease with a
A)Decrease in education
B)Decrease in affluence
C)Decrease in infant mortality rate
D)Decrease in average marrying age
E)Decrease in sanitation
A)Decrease in education
B)Decrease in affluence
C)Decrease in infant mortality rate
D)Decrease in average marrying age
E)Decrease in sanitation
Unlock Deck
Unlock for access to all 66 flashcards in this deck.
Unlock Deck
k this deck
53
Pronatalist pressures are influences that lead people to
A)Increase fecundity
B)Have more children
C)Have fewer children
D)Prevent infant mortality
E)Wait until later in life to have children
A)Increase fecundity
B)Have more children
C)Have fewer children
D)Prevent infant mortality
E)Wait until later in life to have children
Unlock Deck
Unlock for access to all 66 flashcards in this deck.
Unlock Deck
k this deck
54
Use the following demographic data on three hypothetical countries
The most industrialized country listed is
A)Country "A"
B)Country "B"
C)Country "C"
D)None of the countries listed are likely to be industrialized
E)It is impossible to use the data in the table to identify an industrialized country
The most industrialized country listed is
A)Country "A"
B)Country "B"
C)Country "C"
D)None of the countries listed are likely to be industrialized
E)It is impossible to use the data in the table to identify an industrialized country
Unlock Deck
Unlock for access to all 66 flashcards in this deck.
Unlock Deck
k this deck
55
Proponents of social justice believe that environmental and social problems will decrease if
A)We can educate poor people about family planning
B)Resources are distributed fairly
C)Better ethics are taught to poor, uneducated populations
D)We just reduce the number of people on Earth
E)We concentrate on population control
A)We can educate poor people about family planning
B)Resources are distributed fairly
C)Better ethics are taught to poor, uneducated populations
D)We just reduce the number of people on Earth
E)We concentrate on population control
Unlock Deck
Unlock for access to all 66 flashcards in this deck.
Unlock Deck
k this deck
56
The graph indicates that more children die
A)In the last stage of demographic transition
B)In the first stage of demographic transition
C)When their mothers are illiterate
D)When their mothers are literate
E)When their mothers are poor
Unlock Deck
Unlock for access to all 66 flashcards in this deck.
Unlock Deck
k this deck
57
A demographic transition is expected to accompany
A)Colonization, as in Africa and Asia
B)Economic development and stabilization
C)The development of capitalism
D)The introduction of modern medicine
E)All of these
A)Colonization, as in Africa and Asia
B)Economic development and stabilization
C)The development of capitalism
D)The introduction of modern medicine
E)All of these
Unlock Deck
Unlock for access to all 66 flashcards in this deck.
Unlock Deck
k this deck
58
Less developed countries can best argue that developed countries are primarily responsible for overpopulation problems because
A)Developed countries grow most of the global food resources
B)Less developed countries have no population-based environmental problems
C)Less developed countries have recently drastically reduced their fertility rates
D)Developed countries do not understand a global society
E)Less developed countries were many times impoverished by colonialism
Unlock Deck
Unlock for access to all 66 flashcards in this deck.
Unlock Deck
k this deck
59
The message from author Garret Hardin's "lifeboat ethics" is that
A)Helping poor people will, in time, reduce their rate of reproduction
B)The poorer countries of the world are caught in a demographic trap
C)Economic growth will reduce the birth rate of poor nations
D)The world has enough resources for everybody
E)Helping poor people will simply increase their rate of reproduction
Unlock Deck
Unlock for access to all 66 flashcards in this deck.
Unlock Deck
k this deck
60
One of the _________ effective ways to stabilize populations is to _________.
A)Most; provide free contraceptives
B)Least; provide free contraceptives
C)Least; decrease child mortality
D)Most; decrease child mortality
E)Most; expect mandatory sterilization
A)Most; provide free contraceptives
B)Least; provide free contraceptives
C)Least; decrease child mortality
D)Most; decrease child mortality
E)Most; expect mandatory sterilization
Unlock Deck
Unlock for access to all 66 flashcards in this deck.
Unlock Deck
k this deck
61
The world population began growing rapidly during the Middle Ages.
Unlock Deck
Unlock for access to all 66 flashcards in this deck.
Unlock Deck
k this deck
62
The most pessimistic projection of population growth projects the human population to reach 25 billion by 2150.
Unlock Deck
Unlock for access to all 66 flashcards in this deck.
Unlock Deck
k this deck
63
Use birth rates, death rates, emigration rates, and fertility rates to explain a current example of the population dynamics in a nation's human population.Choose the nation you want to describe.
Unlock Deck
Unlock for access to all 66 flashcards in this deck.
Unlock Deck
k this deck
64
As compared to China, India's population control programs have not been as successful as China's.
Unlock Deck
Unlock for access to all 66 flashcards in this deck.
Unlock Deck
k this deck
65
The world's highest current population growth rate is in the United Arab Emirates.
Unlock Deck
Unlock for access to all 66 flashcards in this deck.
Unlock Deck
k this deck
66
Draw a graph that shows the relationship of education for females and infant mortality rates.Appropriately label the x and y axes.
Unlock Deck
Unlock for access to all 66 flashcards in this deck.
Unlock Deck
k this deck
Unlock Deck
Unlock for access to all 66 flashcards in this deck.


