Deck 10: Comparing Two Means and Two Proportions
Full screen (f)
Question
Question
Question
Question
Question
Question
Question
Question
Question
Question
Question
Question
Question
Question
Question
Question
Question
Question
Question
Question
Question
Question
Question
Question
Question
Question
Question
Question
Question
Question
Question
Question
Question
Question
Question
Question
Question
Question
Question
Question
Question
Question
When we test H0: μ1 ≤ μ2,HA: μ1 > μ2 at α = .10,where 
= 77.4,
= 72.2,s1 = 3.3,s2 = 2.1,n1 = 6,n2 = 6,what is the estimated pooled variance?
= 77.4,
= 72.2,s1 = 3.3,s2 = 2.1,n1 = 6,n2 = 6,what is the estimated pooled variance?
Question
Using a 90 percent confidence interval for the difference between the proportions of failures in factory 1 and factory 2,where ![Using a 90 percent confidence interval for the difference between the proportions of failures in factory 1 and factory 2,where = .05, = .04,n<sub>1</sub> = 500,n<sub>2</sub> = 2000 of [-.0076,.0276],can we reject the null hypothesis at α = .10?<div style=padding-top: 35px>](https://storage.examlex.com/TB2340/11ea7431_188d_ffa2_b6ac_1741e42c5f14_TB2340_11.jpg)
= .05,![Using a 90 percent confidence interval for the difference between the proportions of failures in factory 1 and factory 2,where = .05, = .04,n<sub>1</sub> = 500,n<sub>2</sub> = 2000 of [-.0076,.0276],can we reject the null hypothesis at α = .10?<div style=padding-top: 35px>](https://storage.examlex.com/TB2340/11ea7431_188d_ffa3_b6ac_5f35d6d02d16_TB2340_11.jpg)
= .04,n1 = 500,n2 = 2000 of [-.0076,.0276],can we reject the null hypothesis at α = .10?
= .05,
= .04,n1 = 500,n2 = 2000 of [-.0076,.0276],can we reject the null hypothesis at α = .10?
Question
Find a 95 percent confidence interval for μ1 - μ2,where n1 = 15,n2 = 10,
= 1.94,
= 1.04,s12 = .2025 and s22 = .0676.(Assume equal population variances. )
= 1.94,
= 1.04,s12 = .2025 and s22 = .0676.(Assume equal population variances. )
Question
Question
Construct a 95 percent confidence interval for μ1 - μ2,where 
= 34.36,
= 26.45,s1 = 9,s2 = 6,n1 = 10,n2 = 16.(Assume equal population variances. )
= 34.36,
= 26.45,s1 = 9,s2 = 6,n1 = 10,n2 = 16.(Assume equal population variances. )
Question
Find a 95 percent confidence interval for μ1 - μ2,where n1 = 50,n2 = 75, 
= 82,
= 76,s12 = 8,and s22 = 6.Assume unequal variances.
= 82,
= 76,s12 = 8,and s22 = 6.Assume unequal variances.
Question
When we test H0: μ1 ≤ μ2,HA: μ1 > μ2 at α = .10,where 
= 77.4,
= 72.2,s1 = 3.3,s2 = 2.1,n1 = 6,n2 = 6,can we reject the null hypothesis?
= 77.4,
= 72.2,s1 = 3.3,s2 = 2.1,n1 = 6,n2 = 6,can we reject the null hypothesis?
Question
Find a 95 percent confidence interval for the difference between means,where n1 = 50,n2 = 36, 
= 80,
= 75,s12 = 5,and s22 = 3.Assume unequal variances.
= 80,
= 75,s12 = 5,and s22 = 3.Assume unequal variances.
Question
Question
When we test H0: p1 - p2 ≤ .01,HA: p1 - p2 > .01 at α = .05 where 
= .08,
= .035,n1 = 200,n2 = 400,can we reject the null hypothesis?
= .08,
= .035,n1 = 200,n2 = 400,can we reject the null hypothesis?
Question
When testing H0: μ1 - μ2 = 2,HA: μ1 - μ2 > 2,where 
= 522,
= 516,s12 = 28,s22 = 24,n1 = 40,n2 = 30,at α = .01,what can we conclude?
= 522,
= 516,s12 = 28,s22 = 24,n1 = 40,n2 = 30,at α = .01,what can we conclude?
Question
Question
Find a 90 percent confidence interval for the difference between the proportions of failures in factory 1 and factory 2,where 
= .05,
= .04,n1 = 500,n2 = 2000.
= .05,
= .04,n1 = 500,n2 = 2000.
Question
Find a 95 percent confidence interval for the difference between the proportions of older and younger drivers who have tickets,where 
= .275,
= .25,n1 = 1000,n2 = 1000.
= .275,
= .25,n1 = 1000,n2 = 1000.
Question
Question
Question
When we test H0: p1 - p2 ≤ .01,HA: p1 - p2 > .01,at α = .05,where 
= .08,
= .035,n1 = 200,and n2 = 400,what is the standard deviation used in the calculation of the test statistic?
= .08,
= .035,n1 = 200,and n2 = 400,what is the standard deviation used in the calculation of the test statistic?
Question
Find a 98 percent confidence interval for the paired difference. 
Question
When testing H0: μ1 - μ2 = 2,HA: μ1 - μ2 > 2,where 
= 522,
= 516,σ12 = 28,σ22 = 24,n1 = 40,n2 = 30,at α = .01,what is the test statistic?
= 522,
= 516,σ12 = 28,σ22 = 24,n1 = 40,n2 = 30,at α = .01,what is the test statistic?
Question
When we test H0: μ1 - μ2 ≤ 0,HA: μ1 - μ2 > 0, 
= 15.4,
= 14.5,σ1 = 2,σ2 = 2.28,n1 = 35,and n2 = 18 at α = .01,what is the value of the test statistic?
= 15.4,
= 14.5,σ1 = 2,σ2 = 2.28,n1 = 35,and n2 = 18 at α = .01,what is the value of the test statistic?
Question
A fast food company uses two management-training methods.Method 1 is a traditional method of training and Method 2 is a new and innovative method.The company has just hired 31 new management trainees.15 of the trainees are randomly selected and assigned to the first method,and the remaining 16 trainees are assigned to the second training method.After three months of training,the management trainees took a standardized test.The test was designed to evaluate their performance and learning from training.The sample mean score and sample standard deviation of the two methods are given below.The management wants to determine if the company should implement the new training method.
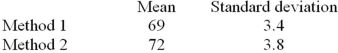
Is there evidence at α = .05 to conclude that the new training method is more effective than the traditional training method?
Is there evidence at α = .05 to conclude that the new training method is more effective than the traditional training method?
Question
Question
Question
Question
At α = .10,testing the hypothesis that the proportion of consumer industry companies' (CON)winter-quarter profit growth is more than 2 percent greater than the proportion of banking companies' (BKG)winter-quarter profit growth,given that 

nCON = 300,and nBKG = 400,can we reject the null hypothesis?
nCON = 300,and nBKG = 400,can we reject the null hypothesis?
Question
A fast-food company uses two management-training methods.Method 1 is a traditional method of training,and Method 2 is a new and innovative method.The company has just hired 31 new management trainees.15 of the trainees are randomly selected and assigned to Method 1,and the remaining 16 trainees are assigned to Method 1 .After three months of training,the management trainees take a standardized test.The test is designed to evaluate their performance and learning from the training.The sample mean score and sample standard deviation of the two methods are given below.Company management wants to determine whether the company should implement the new training method.
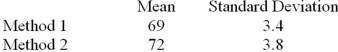
What is the absolute value of the rejection point (critical value of the test statistic)at α = .05?
What is the absolute value of the rejection point (critical value of the test statistic)at α = .05?
Question
At α = .10,testing the hypothesis that the proportion of consumer industry companies' (CON)winter-quarter profit growth is more than 2 percent greater than the proportion of banking companies' (BKG)winter-quarter profit growth,given that 

nCON = 300,and nBKG = 400,calculate the estimated standard deviation for the model.
nCON = 300,and nBKG = 400,calculate the estimated standard deviation for the model.
Question
A fast-food company uses two management-training methods.Method 1 is a traditional method of training,and Method 2 is a new and innovative method.The company has just hired 31 new management trainees.15 of the trainees are randomly selected and assigned to Method 1,and the remaining 16 trainees are assigned to Method 2.After three months of training,the management trainees take a standardized test.The test is designed to evaluate their performance and learning from the training.The sample mean score and sample standard deviation of the two methods are given below.Company management wants to determine whether the company should implement the new training method.
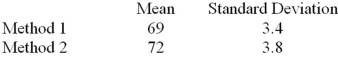
Write the null and alternative hypotheses.
Write the null and alternative hypotheses.
Question
When we test H0: μ1 - μ2 ≤ 0,HA: μ1 - μ2 > 0, 
= 15.4,
= 14.5,s1 = 2,s2 = 2.28,n1 = 35,and n2 = 18 at α = .01,can we reject the null hypothesis? (Assume unequal variances. )
= 15.4,
= 14.5,s1 = 2,s2 = 2.28,n1 = 35,and n2 = 18 at α = .01,can we reject the null hypothesis? (Assume unequal variances. )
Question
Find a 95 percent confidence interval for μ1 - μ2,where n1 = 9,n2 = 6, 

s12 = 6,and s22 = 3.(Assume equal population variances. )
s12 = 6,and s22 = 3.(Assume equal population variances. )
Question
Question
Question
Question
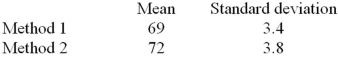
A fast food company uses two management-training methods.Method 1 is a traditional method of training and Method 2 is a new and innovative method.The company has just hired 31 new management trainees.15 of the trainees are randomly selected and assigned to the first method,and the remaining 16 trainees are assigned to the second training method.After three months of training,the management trainees took a standardized test.The test was designed to evaluate their performance and learning from training.The sample mean score and sample standard deviation of the two methods are given below.The management wants to determine if the company should implement the new training method.

What is the sample value of the test statistic?
What is the sample value of the test statistic?
Question
A fast food company uses two management-training methods.Method 1 is a traditional method of training and Method 2 is a new and innovative method.The company has just hired 31 new management trainees.15 of the trainees are randomly selected and assigned to the first method,and the remaining 16 trainees are assigned to the second training method.After three months of training,the management trainees took a standardized test.The test was designed to evaluate their performance and learning from training.The sample mean score and sample standard deviation of the two methods are given below.The management wants to determine if the company should implement the new training method.
What is the absolute value of the rejection point (critical value of the test statistic)at α = .01?
What is the absolute value of the rejection point (critical value of the test statistic)at α = .01?
Question
A fast food company uses two management-training methods.Method 1 is a traditional method of training and Method 2 is a new and innovative method.The company has just hired 31 new management trainees.15 of the trainees are randomly selected and assigned to the first method,and the remaining 16 trainees are assigned to the second training method.After three months of training,the management trainees took a standardized test.The test was designed to evaluate their performance and learning from training.The sample mean score and sample standard deviation of the two methods are given below.The management wants to determine if the company should implement the new training method.

Is there evidence at α = .01 to conclude that the new training method is more effective than the traditional training method?
Is there evidence at α = .01 to conclude that the new training method is more effective than the traditional training method?
Question
Question
Find a 90 percent confidence interval for the difference between the proportions of group l and group 2.Let p1 represent the population proportion of the people in group 1 who are in favor of new packaging,and let p2 represent the population proportion of the people in group 2 who are in favor of new packaging. 
= .21,
= .13,n1 = 300,and n2 = 400.
= .21,
= .13,n1 = 300,and n2 = 400.
Question

Unlock Deck
Sign up to unlock the cards in this deck!
Unlock Deck
Unlock Deck
1/118
Play
Full screen (f)
Deck 10: Comparing Two Means and Two Proportions
1
If the limits of the confidence interval of the difference between the means of two normally distributed populations were 8.5 and 11.5 at the 95 percent confidence level,then we can conclude that we are 95 percent certain that there is a significant difference between the two population means.
True
2
Assume that we are constructing a confidence interval for the difference in the means of two populations based on independent random samples.If both sample sizes
and the distributions of both populations are highly skewed,then a confidence interval for the difference in the means can be constructed using the t test statistic.
and the distributions of both populations are highly skewed,then a confidence interval for the difference in the means can be constructed using the t test statistic.
False
3
An independent samples experiment is an experiment in which there is no relationship between the measurements in the different samples.
True
4
When testing the difference between two proportions selected from populations with large independent samples,the z test statistic is used.
Unlock Deck
Unlock for access to all 118 flashcards in this deck.
Unlock Deck
k this deck
5
In forming a confidence interval for μ1 - μ2,only two assumptions are required: independent samples and sample sizes of at least 30.
Unlock Deck
Unlock for access to all 118 flashcards in this deck.
Unlock Deck
k this deck
6
The controller of a chain of toy stores is interested in determining whether there is any difference in the weekly sales of store 1 and store 2.The weekly sales are normally distributed.This problem should be analyzed using an independent means method.
Unlock Deck
Unlock for access to all 118 flashcards in this deck.
Unlock Deck
k this deck
7
There are two types of machines called type A and type B.Both type A and type B can be used to produce a certain product.The production manager wants to compare efficiency of the two machines.He assigns each of the 15 workers to both types of machines to compare their hourly production rate.In other words,each worker operates machine A and machine B for one hour each.These two samples are independent.
Unlock Deck
Unlock for access to all 118 flashcards in this deck.
Unlock Deck
k this deck
8
In testing the difference between the means of two independent populations,if neither population is normally distributed,then the sampling distribution of the difference in means will be approximately normal,provided that the sum of the sample sizes obtained from the two populations is at least 30.
Unlock Deck
Unlock for access to all 118 flashcards in this deck.
Unlock Deck
k this deck
9
When we are testing a hypothesis about the difference in two population proportions based on large independent samples,we compute a combined (pooled)proportion from the two samples if we assume that there is no difference between the two proportions in our null hypothesis.
Unlock Deck
Unlock for access to all 118 flashcards in this deck.
Unlock Deck
k this deck
10
In testing for the equality of means from two independent populations,if the hypothesis of equal population means is rejected at α = .01,it will __________ be rejected at α = .05.
A)Always
B)Sometimes
C)Never
A)Always
B)Sometimes
C)Never
Unlock Deck
Unlock for access to all 118 flashcards in this deck.
Unlock Deck
k this deck
11
In testing the difference between the means of two normally distributed populations using independent random samples,the alternative hypothesis always indicates no differences between the two specified means.
Unlock Deck
Unlock for access to all 118 flashcards in this deck.
Unlock Deck
k this deck
12
In testing the difference between the means of two normally distributed populations using independent random samples,we can only use a two-sided test.
Unlock Deck
Unlock for access to all 118 flashcards in this deck.
Unlock Deck
k this deck
13
If the limits of the confidence interval of the difference between the means of two normally distributed populations were from -2.6 to 1.4 at the 95 percent confidence level,then we can conclude that we are 95 percent certain that there is a significant difference between the two population means.
Unlock Deck
Unlock for access to all 118 flashcards in this deck.
Unlock Deck
k this deck
14
When comparing two independent population means,if n1 = 13 and n2 = 10,degrees of freedom for the t statistic is 22.
Unlock Deck
Unlock for access to all 118 flashcards in this deck.
Unlock Deck
k this deck
15
In an experiment involving matched pairs,a sample of 12 pairs of observations is collected.The degrees of freedom for the t statistic is 10.
Unlock Deck
Unlock for access to all 118 flashcards in this deck.
Unlock Deck
k this deck
16
When comparing two population means based on independent random samples,the pooled estimate of the variance is used when there is an assumption of equal population variances.
Unlock Deck
Unlock for access to all 118 flashcards in this deck.
Unlock Deck
k this deck
17
In testing the difference between the means of two normally distributed populations using large independent random samples,the sample sizes from the two populations must be equal.
Unlock Deck
Unlock for access to all 118 flashcards in this deck.
Unlock Deck
k this deck
18
A new company is in the process of evaluating its customer service.The company offers two types of sales: (1)Internet sales and (2)store sales.The marketing research manager believes that the Internet sales are more than 10 percent higher than store sales.The null hypothesis would be:
A)PInternet - Pstore > .10
B)PInternet - Pstore < .10
C)PInternet - Pstore ≥ .10
D)PInternet - Pstore ≤ .10
E)PInternet - Pstore = .10
A)PInternet - Pstore > .10
B)PInternet - Pstore < .10
C)PInternet - Pstore ≥ .10
D)PInternet - Pstore ≤ .10
E)PInternet - Pstore = .10
Unlock Deck
Unlock for access to all 118 flashcards in this deck.
Unlock Deck
k this deck
19
In testing the difference between two means from two independent populations,the sample sizes do not have to be equal.
Unlock Deck
Unlock for access to all 118 flashcards in this deck.
Unlock Deck
k this deck
20
In order to test the effectiveness of a drug called XZR designed to reduce cholesterol levels,9 heart patients' cholesterol levels are measured before they are given the drug.The same 9 patients use XZR for two continuous months.After two months of continuous use,the 9 patients' cholesterol levels are measured again.The comparison of cholesterol levels before versus after administering the drug is an example of testing the difference between:
A)Two means from independent populations.
B)Two population variances from independent populations.
C)Two population proportions.
D)Matched pairs from two dependent populations.
A)Two means from independent populations.
B)Two population variances from independent populations.
C)Two population proportions.
D)Matched pairs from two dependent populations.
Unlock Deck
Unlock for access to all 118 flashcards in this deck.
Unlock Deck
k this deck
21
Given the following information about a hypothesis test of the difference between two means based on independent random samples,which one of the following is the correct rejection region at a significance level of .05?
HA: ?A > ?B,
S1 = 4,s2 = 2,n1 = 13,n2 = 10.
A)Reject H0 if t > 1.96
B)Reject H0 if t > 1.645
C)Reject H0 if t > 1.721
D)Reject H0 if t > 2.08
E)Reject H0 if t > 1.782
HA: ?A > ?B,
S1 = 4,s2 = 2,n1 = 13,n2 = 10.
A)Reject H0 if t > 1.96
B)Reject H0 if t > 1.645
C)Reject H0 if t > 1.721
D)Reject H0 if t > 2.08
E)Reject H0 if t > 1.782
Unlock Deck
Unlock for access to all 118 flashcards in this deck.
Unlock Deck
k this deck
22
When testing the difference between two population proportions,the _______ test statistic is used.
A)z
B)t
C)F
D)t2
A)z
B)t
C)F
D)t2
Unlock Deck
Unlock for access to all 118 flashcards in this deck.
Unlock Deck
k this deck
23
In comparing the difference between two independent population means,the sampling distributions of the population means are at least approximately ________________.
A)Skewed right
B)Skewed left
C)Normal
D)Binomial
A)Skewed right
B)Skewed left
C)Normal
D)Binomial
Unlock Deck
Unlock for access to all 118 flashcards in this deck.
Unlock Deck
k this deck
24
When testing a hypothesis about the mean of a population of paired differences in which two different observations are taken on the same units,the correct test statistic to use is _________.
A)z
B)t
C)F
D)Chi-square
E)None of these
A)z
B)t
C)F
D)Chi-square
E)None of these
Unlock Deck
Unlock for access to all 118 flashcards in this deck.
Unlock Deck
k this deck
25
A financial analyst working for a financial consulting company wishes to find evidence that the average price-to-earnings ratio in the consumer industry is higher than the average price-to-earnings ratio in the banking industry.The alternative hypothesis is:
A)μconsumer = μbanking
B)μconsumer ≤ μbanking
C)μconsumer > μbanking
D)μconsumer < μbanking
E)μconsumer ≠ μbanking
A)μconsumer = μbanking
B)μconsumer ≤ μbanking
C)μconsumer > μbanking
D)μconsumer < μbanking
E)μconsumer ≠ μbanking
Unlock Deck
Unlock for access to all 118 flashcards in this deck.
Unlock Deck
k this deck
26
In testing the difference between two independent population means,it is assumed that the level of measurement is at least ______________.
A)A ratio variable
B)A qualitative variable
C)An interval variable
D)A categorical variable
A)A ratio variable
B)A qualitative variable
C)An interval variable
D)A categorical variable
Unlock Deck
Unlock for access to all 118 flashcards in this deck.
Unlock Deck
k this deck
27
When testing the difference between two population proportions using large independent random samples,the __________ test statistic is used.
A)z
B)t
C)F
D)Chi-square
E)None of these
A)z
B)t
C)F
D)Chi-square
E)None of these
Unlock Deck
Unlock for access to all 118 flashcards in this deck.
Unlock Deck
k this deck
28
An experiment in which two different measurements are taken on the same units and inferences are made using the differences between the pairs of measurements is a(n)______ experiment.
A)Paired difference
B)Equal variances
C)Independent samples
D)Dependent samples
A)Paired difference
B)Equal variances
C)Independent samples
D)Dependent samples
Unlock Deck
Unlock for access to all 118 flashcards in this deck.
Unlock Deck
k this deck
29
If we are testing the hypothesis about the mean of a population of paired differences with samples of n1 = 10,n2 = 10,the degrees of freedom for the t statistic is ____.
A)19
B)18
C)9
D)8
E)10
A)19
B)18
C)9
D)8
E)10
Unlock Deck
Unlock for access to all 118 flashcards in this deck.
Unlock Deck
k this deck
30
When comparing two independent population means by using samples selected from two independent normally distributed populations with equal variances,the correct test statistic to use is ______.
A)z
B)t
C)F
D)t2
A)z
B)t
C)F
D)t2
Unlock Deck
Unlock for access to all 118 flashcards in this deck.
Unlock Deck
k this deck
31
In testing the difference between two means from two normally distributed independent populations,the distribution of the difference in sample means will be:
A)Normally distributed only if sample sizes are equal.
B)Normally distributed only if both population standard deviations are known.
C)Normally distributed.
D)Normally distributed if both sample sizes are very large.
E)Normally distributed only if both population variances are equal.
A)Normally distributed only if sample sizes are equal.
B)Normally distributed only if both population standard deviations are known.
C)Normally distributed.
D)Normally distributed if both sample sizes are very large.
E)Normally distributed only if both population variances are equal.
Unlock Deck
Unlock for access to all 118 flashcards in this deck.
Unlock Deck
k this deck
32
In testing the difference between the means of two independent populations,the variances of the two samples can be pooled if the population variances are assumed to ____________.
A)Be unequal
B)Be greater than the mean
C)Sum to 1
D)Be equal
A)Be unequal
B)Be greater than the mean
C)Sum to 1
D)Be equal
Unlock Deck
Unlock for access to all 118 flashcards in this deck.
Unlock Deck
k this deck
33
In testing the difference between the means of two normally distributed populations using independent random samples,the correct test statistic to use is:
A)z statistic.
B)t statistic.
C)F statistiC.
D)Chi-square statistic.
E)None of thesE.
A)z statistic.
B)t statistic.
C)F statistiC.
D)Chi-square statistic.
E)None of thesE.
Unlock Deck
Unlock for access to all 118 flashcards in this deck.
Unlock Deck
k this deck
34
When testing the difference for the population of paired differences in which two different observations are taken on the same units,the correct test statistic to use is ____.
A)z
B)t
C)F
D)t2
A)z
B)t
C)F
D)t2
Unlock Deck
Unlock for access to all 118 flashcards in this deck.
Unlock Deck
k this deck
35
In order to test the effectiveness of a drug called XZR designed to reduce cholesterol levels,9 heart patients' cholesterol levels are measured before they are given the drug.The same 9 patients use XZR for two continuous months.After two months of continuous use,the 9 patients' cholesterol levels are measured again.The comparison of cholesterol levels before versus after the administration of the drug is an example of testing the difference between two ____________.
A)Samples of equal variances
B)Independent samples
C)Paired samples
D)Samples of unequal variances
A)Samples of equal variances
B)Independent samples
C)Paired samples
D)Samples of unequal variances
Unlock Deck
Unlock for access to all 118 flashcards in this deck.
Unlock Deck
k this deck
36
A new company is in the process of evaluating its customer service.The company offers two types of sales: (1)Internet sales and (2)store sales.The marketing research manager believes that the Internet sales are more than 10 percent higher than store sales.The alternative hypothesis for this problem would be stated as:
A)PInternet - Pstore > 0
B)PInternet - Pstore < 0
C)PInternet - Pstore ≥ 0
D)PInternet - Pstore ≤ .10
E)PInternet - Pstore > .10
A)PInternet - Pstore > 0
B)PInternet - Pstore < 0
C)PInternet - Pstore ≥ 0
D)PInternet - Pstore ≤ .10
E)PInternet - Pstore > .10
Unlock Deck
Unlock for access to all 118 flashcards in this deck.
Unlock Deck
k this deck
37
In which of the following tests is the variable of interest the difference between the values of the observations from the two samples,rather than the actual observations themselves?
A)A test of hypothesis about the mean of a population of paired differences selected from two related samples.
B)A test of hypothesis about the difference between the means of two normally distributed populations using independent samples.
C)A test of hypothesis about the difference between two population proportions,using large independent random samples.
D)A test of hypothesis about the difference between the variances of two normally distributed populations using independent samples.
Unlock Deck
Unlock for access to all 118 flashcards in this deck.
Unlock Deck
k this deck
38
An experiment in which there is no relationship between the measurements on the different samples is a(n)______ experiment.
A)Paired difference
B)Equal variances
C)Independent samples
D)Dependent samples
A)Paired difference
B)Equal variances
C)Independent samples
D)Dependent samples
Unlock Deck
Unlock for access to all 118 flashcards in this deck.
Unlock Deck
k this deck
39
In testing the difference between two independent population means,if the assumption is of unequal variances,the critical value of the t statistic is obtained by calculating the ___________________.
A)Degrees of freedom
B)Sum of the two sample sizes (n1 + n2)
C)p-value
D)Pooled variance
A)Degrees of freedom
B)Sum of the two sample sizes (n1 + n2)
C)p-value
D)Pooled variance
Unlock Deck
Unlock for access to all 118 flashcards in this deck.
Unlock Deck
k this deck
40
If we are testing the difference between the means of two normally distributed independent populations with samples of n1 = 10,n2 = 10,the degrees of freedom for the t statistic is ______.
A)19
B)18
C)9
D)8
E)20
A)19
B)18
C)9
D)8
E)20
Unlock Deck
Unlock for access to all 118 flashcards in this deck.
Unlock Deck
k this deck
41
Given the following information about a hypothesis test of the difference between two means based on independent random samples,what is the standard deviation of the difference between the two means? Assume that the samples are obtained from normally distributed populations having equal variances.
HA: ?A > ?B,
S1 = 5,s2 = 3,n1 = 13,n2 = 10.
A)1.792
B)1.679
C)2.823
D)3.210
E)1.478
HA: ?A > ?B,
S1 = 5,s2 = 3,n1 = 13,n2 = 10.
A)1.792
B)1.679
C)2.823
D)3.210
E)1.478
Unlock Deck
Unlock for access to all 118 flashcards in this deck.
Unlock Deck
k this deck
42
When we test H0: μ1 ≤ μ2,HA: μ1 > μ2 at α = .10,where
= 77.4,
= 72.2,s1 = 3.3,s2 = 2.1,n1 = 6,n2 = 6,what is the estimated pooled variance?
= 77.4,
= 72.2,s1 = 3.3,s2 = 2.1,n1 = 6,n2 = 6,what is the estimated pooled variance?
Unlock Deck
Unlock for access to all 118 flashcards in this deck.
Unlock Deck
k this deck
43
Using a 90 percent confidence interval for the difference between the proportions of failures in factory 1 and factory 2,where
= .05,
= .04,n1 = 500,n2 = 2000 of [-.0076,.0276],can we reject the null hypothesis at α = .10?
= .05,
= .04,n1 = 500,n2 = 2000 of [-.0076,.0276],can we reject the null hypothesis at α = .10?
Unlock Deck
Unlock for access to all 118 flashcards in this deck.
Unlock Deck
k this deck
44
Find a 95 percent confidence interval for μ1 - μ2,where n1 = 15,n2 = 10,
= 1.94,
= 1.04,s12 = .2025 and s22 = .0676.(Assume equal population variances. )
= 1.94,
= 1.04,s12 = .2025 and s22 = .0676.(Assume equal population variances. )
Unlock Deck
Unlock for access to all 118 flashcards in this deck.
Unlock Deck
k this deck
45
The test of means for two related populations matches the observations (matched pairs)in order to reduce the ________________ attributable to the difference between individual observations and other factors.
A)Means
B)Test statistic
C)Degrees of freedom
D)Variation
A)Means
B)Test statistic
C)Degrees of freedom
D)Variation
Unlock Deck
Unlock for access to all 118 flashcards in this deck.
Unlock Deck
k this deck
46
Construct a 95 percent confidence interval for μ1 - μ2,where
= 34.36,
= 26.45,s1 = 9,s2 = 6,n1 = 10,n2 = 16.(Assume equal population variances. )
= 34.36,
= 26.45,s1 = 9,s2 = 6,n1 = 10,n2 = 16.(Assume equal population variances. )
Unlock Deck
Unlock for access to all 118 flashcards in this deck.
Unlock Deck
k this deck
47
Find a 95 percent confidence interval for μ1 - μ2,where n1 = 50,n2 = 75,
= 82,
= 76,s12 = 8,and s22 = 6.Assume unequal variances.
= 82,
= 76,s12 = 8,and s22 = 6.Assume unequal variances.
Unlock Deck
Unlock for access to all 118 flashcards in this deck.
Unlock Deck
k this deck
48
When we test H0: μ1 ≤ μ2,HA: μ1 > μ2 at α = .10,where
= 77.4,
= 72.2,s1 = 3.3,s2 = 2.1,n1 = 6,n2 = 6,can we reject the null hypothesis?
= 77.4,
= 72.2,s1 = 3.3,s2 = 2.1,n1 = 6,n2 = 6,can we reject the null hypothesis?
Unlock Deck
Unlock for access to all 118 flashcards in this deck.
Unlock Deck
k this deck
49
Find a 95 percent confidence interval for the difference between means,where n1 = 50,n2 = 36,
= 80,
= 75,s12 = 5,and s22 = 3.Assume unequal variances.
= 80,
= 75,s12 = 5,and s22 = 3.Assume unequal variances.
Unlock Deck
Unlock for access to all 118 flashcards in this deck.
Unlock Deck
k this deck
50
Given two independent normal distributions with s12 - s22 = 100,?1 = ?2 = 50,n1 = n2 = 50,the sampling distribution of the mean difference
Will have a mean of _________.
A)1
B)0
C)50
D)100
Will have a mean of _________.
A)1
B)0
C)50
D)100
Unlock Deck
Unlock for access to all 118 flashcards in this deck.
Unlock Deck
k this deck
51
When we test H0: p1 - p2 ≤ .01,HA: p1 - p2 > .01 at α = .05 where
= .08,
= .035,n1 = 200,n2 = 400,can we reject the null hypothesis?
= .08,
= .035,n1 = 200,n2 = 400,can we reject the null hypothesis?
Unlock Deck
Unlock for access to all 118 flashcards in this deck.
Unlock Deck
k this deck
52
When testing H0: μ1 - μ2 = 2,HA: μ1 - μ2 > 2,where
= 522,
= 516,s12 = 28,s22 = 24,n1 = 40,n2 = 30,at α = .01,what can we conclude?
= 522,
= 516,s12 = 28,s22 = 24,n1 = 40,n2 = 30,at α = .01,what can we conclude?
Unlock Deck
Unlock for access to all 118 flashcards in this deck.
Unlock Deck
k this deck
53
Given the following information about a hypothesis test of the difference between two means based on independent random samples,what is the calculated value of the test statistic? Assume that the samples are obtained from normally distributed populations having equal variances.
HA: ?A > ?B,
S1 = 5,s2 = 3,n1 = 13,n2 = 10.
A)t = 1.96
B)t = 1.5
C)t = 2.823
D)t = 1.674
E)t = 1.063
HA: ?A > ?B,
S1 = 5,s2 = 3,n1 = 13,n2 = 10.
A)t = 1.96
B)t = 1.5
C)t = 2.823
D)t = 1.674
E)t = 1.063
Unlock Deck
Unlock for access to all 118 flashcards in this deck.
Unlock Deck
k this deck
54
Find a 90 percent confidence interval for the difference between the proportions of failures in factory 1 and factory 2,where
= .05,
= .04,n1 = 500,n2 = 2000.
= .05,
= .04,n1 = 500,n2 = 2000.
Unlock Deck
Unlock for access to all 118 flashcards in this deck.
Unlock Deck
k this deck
55
Find a 95 percent confidence interval for the difference between the proportions of older and younger drivers who have tickets,where
= .275,
= .25,n1 = 1000,n2 = 1000.
= .275,
= .25,n1 = 1000,n2 = 1000.
Unlock Deck
Unlock for access to all 118 flashcards in this deck.
Unlock Deck
k this deck
56
If we are testing the hypothesis about the mean of a population of paired differences with samples of n1 = 8,n2 = 8,the degrees of freedom for the t statistic is ____.
A)16
B)7
C)14
D)9
A)16
B)7
C)14
D)9
Unlock Deck
Unlock for access to all 118 flashcards in this deck.
Unlock Deck
k this deck
57
In testing the difference between the means of two normally distributed populations,if μ1 = μ2 = 50,n1 = 9,n2 = 13,the degrees of freedom for the t statistic equals ___________.
A)22
B)21
C)19
D)20
A)22
B)21
C)19
D)20
Unlock Deck
Unlock for access to all 118 flashcards in this deck.
Unlock Deck
k this deck
58
When we test H0: p1 - p2 ≤ .01,HA: p1 - p2 > .01,at α = .05,where
= .08,
= .035,n1 = 200,and n2 = 400,what is the standard deviation used in the calculation of the test statistic?
= .08,
= .035,n1 = 200,and n2 = 400,what is the standard deviation used in the calculation of the test statistic?
Unlock Deck
Unlock for access to all 118 flashcards in this deck.
Unlock Deck
k this deck
59
Find a 98 percent confidence interval for the paired difference.
Unlock Deck
Unlock for access to all 118 flashcards in this deck.
Unlock Deck
k this deck
60
When testing H0: μ1 - μ2 = 2,HA: μ1 - μ2 > 2,where
= 522,
= 516,σ12 = 28,σ22 = 24,n1 = 40,n2 = 30,at α = .01,what is the test statistic?
= 522,
= 516,σ12 = 28,σ22 = 24,n1 = 40,n2 = 30,at α = .01,what is the test statistic?
Unlock Deck
Unlock for access to all 118 flashcards in this deck.
Unlock Deck
k this deck
61
When we test H0: μ1 - μ2 ≤ 0,HA: μ1 - μ2 > 0,
= 15.4,
= 14.5,σ1 = 2,σ2 = 2.28,n1 = 35,and n2 = 18 at α = .01,what is the value of the test statistic?
= 15.4,
= 14.5,σ1 = 2,σ2 = 2.28,n1 = 35,and n2 = 18 at α = .01,what is the value of the test statistic?
Unlock Deck
Unlock for access to all 118 flashcards in this deck.
Unlock Deck
k this deck
62
A fast food company uses two management-training methods.Method 1 is a traditional method of training and Method 2 is a new and innovative method.The company has just hired 31 new management trainees.15 of the trainees are randomly selected and assigned to the first method,and the remaining 16 trainees are assigned to the second training method.After three months of training,the management trainees took a standardized test.The test was designed to evaluate their performance and learning from training.The sample mean score and sample standard deviation of the two methods are given below.The management wants to determine if the company should implement the new training method.
Is there evidence at α = .05 to conclude that the new training method is more effective than the traditional training method?
Is there evidence at α = .05 to conclude that the new training method is more effective than the traditional training method?
Unlock Deck
Unlock for access to all 118 flashcards in this deck.
Unlock Deck
k this deck
63
Let p1 represent the population proportion of U.S.senatorial and congressional (House of Representatives)Democrats who are in favor of a new modest tax on "junk food".Let p2 represent the population proportion of U.S.senatorial and congressional Republicans who are in favor of a new modest tax on "junk food." Out of the 265 Democratic senators and members of Congress,106 of them are in favor of a "junk food" tax.Out of the 285 Republican senators and members of Congress,only 57 are in favor a "junk food" tax.At α = .01,can we conclude that the proportion of Democrats who favor a "junk food" tax is more than 5 percent higher than the proportion of Republicans who favor the new tax?
Unlock Deck
Unlock for access to all 118 flashcards in this deck.
Unlock Deck
k this deck
64
Find a 99 percent confidence interval for the difference between means,given that n1 = 49,n2 = 49,
Unlock Deck
Unlock for access to all 118 flashcards in this deck.
Unlock Deck
k this deck
65
Calculate the t statistic for testing equality of means where
Unlock Deck
Unlock for access to all 118 flashcards in this deck.
Unlock Deck
k this deck
66
At α = .10,testing the hypothesis that the proportion of consumer industry companies' (CON)winter-quarter profit growth is more than 2 percent greater than the proportion of banking companies' (BKG)winter-quarter profit growth,given that
nCON = 300,and nBKG = 400,can we reject the null hypothesis?
nCON = 300,and nBKG = 400,can we reject the null hypothesis?
Unlock Deck
Unlock for access to all 118 flashcards in this deck.
Unlock Deck
k this deck
67
A fast-food company uses two management-training methods.Method 1 is a traditional method of training,and Method 2 is a new and innovative method.The company has just hired 31 new management trainees.15 of the trainees are randomly selected and assigned to Method 1,and the remaining 16 trainees are assigned to Method 1 .After three months of training,the management trainees take a standardized test.The test is designed to evaluate their performance and learning from the training.The sample mean score and sample standard deviation of the two methods are given below.Company management wants to determine whether the company should implement the new training method.
What is the absolute value of the rejection point (critical value of the test statistic)at α = .05?
What is the absolute value of the rejection point (critical value of the test statistic)at α = .05?
Unlock Deck
Unlock for access to all 118 flashcards in this deck.
Unlock Deck
k this deck
68
At α = .10,testing the hypothesis that the proportion of consumer industry companies' (CON)winter-quarter profit growth is more than 2 percent greater than the proportion of banking companies' (BKG)winter-quarter profit growth,given that
nCON = 300,and nBKG = 400,calculate the estimated standard deviation for the model.
nCON = 300,and nBKG = 400,calculate the estimated standard deviation for the model.
Unlock Deck
Unlock for access to all 118 flashcards in this deck.
Unlock Deck
k this deck
69
A fast-food company uses two management-training methods.Method 1 is a traditional method of training,and Method 2 is a new and innovative method.The company has just hired 31 new management trainees.15 of the trainees are randomly selected and assigned to Method 1,and the remaining 16 trainees are assigned to Method 2.After three months of training,the management trainees take a standardized test.The test is designed to evaluate their performance and learning from the training.The sample mean score and sample standard deviation of the two methods are given below.Company management wants to determine whether the company should implement the new training method.
Write the null and alternative hypotheses.
Write the null and alternative hypotheses.
Unlock Deck
Unlock for access to all 118 flashcards in this deck.
Unlock Deck
k this deck
70
When we test H0: μ1 - μ2 ≤ 0,HA: μ1 - μ2 > 0,
= 15.4,
= 14.5,s1 = 2,s2 = 2.28,n1 = 35,and n2 = 18 at α = .01,can we reject the null hypothesis? (Assume unequal variances. )
= 15.4,
= 14.5,s1 = 2,s2 = 2.28,n1 = 35,and n2 = 18 at α = .01,can we reject the null hypothesis? (Assume unequal variances. )
Unlock Deck
Unlock for access to all 118 flashcards in this deck.
Unlock Deck
k this deck
71
Find a 95 percent confidence interval for μ1 - μ2,where n1 = 9,n2 = 6,
s12 = 6,and s22 = 3.(Assume equal population variances. )
s12 = 6,and s22 = 3.(Assume equal population variances. )
Unlock Deck
Unlock for access to all 118 flashcards in this deck.
Unlock Deck
k this deck
72
In an opinion survey,a random sample of 1000 adults from the United States and 1000 adults from Germany were asked whether they supported the death penalty.590 American adults and 560 German adults indicated that they supported the death penalty.The researcher wants to know whether there is sufficient evidence to conclude that the proportion of adults who support the death penalty is higher in the United States than in Germany.What is the rejection point (critical value of the test statistic)at α = .10?
Unlock Deck
Unlock for access to all 118 flashcards in this deck.
Unlock Deck
k this deck
73
Let p1 represent the population proportion of U.S.senatorial and congressional (House of Representatives)Democrats who are in favor of a new modest tax on "junk food." Let p2 represent the population proportion of U.S.senatorial and congressional Republicans who are in favor of a new modest tax on "junk food." Out of the 265 Democratic senators and members of Congress,106 of them are in favor of a "junk food" tax.Out of the 285 Republican senators and members of Congress,only 57 are in favor of a "junk food" tax.Find a 95 percent confidence interval for the difference between proportions l and 2.
Unlock Deck
Unlock for access to all 118 flashcards in this deck.
Unlock Deck
k this deck
74
Calculate the pooled variance where sample 1 has data: 16,14,19,18,19,20,15,18,17,18;and sample 2 has data: 13,19,14,17,21,14,15,10,13,15.
Unlock Deck
Unlock for access to all 118 flashcards in this deck.
Unlock Deck
k this deck
75
A fast food company uses two management-training methods.Method 1 is a traditional method of training and Method 2 is a new and innovative method.The company has just hired 31 new management trainees.15 of the trainees are randomly selected and assigned to the first method,and the remaining 16 trainees are assigned to the second training method.After three months of training,the management trainees took a standardized test.The test was designed to evaluate their performance and learning from training.The sample mean score and sample standard deviation of the two methods are given below.The management wants to determine if the company should implement the new training method.
What is the sample value of the test statistic?
What is the sample value of the test statistic?
Unlock Deck
Unlock for access to all 118 flashcards in this deck.
Unlock Deck
k this deck
76
A fast food company uses two management-training methods.Method 1 is a traditional method of training and Method 2 is a new and innovative method.The company has just hired 31 new management trainees.15 of the trainees are randomly selected and assigned to the first method,and the remaining 16 trainees are assigned to the second training method.After three months of training,the management trainees took a standardized test.The test was designed to evaluate their performance and learning from training.The sample mean score and sample standard deviation of the two methods are given below.The management wants to determine if the company should implement the new training method.
What is the absolute value of the rejection point (critical value of the test statistic)at α = .01?
What is the absolute value of the rejection point (critical value of the test statistic)at α = .01?
Unlock Deck
Unlock for access to all 118 flashcards in this deck.
Unlock Deck
k this deck
77
A fast food company uses two management-training methods.Method 1 is a traditional method of training and Method 2 is a new and innovative method.The company has just hired 31 new management trainees.15 of the trainees are randomly selected and assigned to the first method,and the remaining 16 trainees are assigned to the second training method.After three months of training,the management trainees took a standardized test.The test was designed to evaluate their performance and learning from training.The sample mean score and sample standard deviation of the two methods are given below.The management wants to determine if the company should implement the new training method.
Is there evidence at α = .01 to conclude that the new training method is more effective than the traditional training method?
Is there evidence at α = .01 to conclude that the new training method is more effective than the traditional training method?
Unlock Deck
Unlock for access to all 118 flashcards in this deck.
Unlock Deck
k this deck
78
Testing the equality of means at α = .05,where sample 1 has data: 16,14,19,18,19,20,15,18,17,18;and sample 2 has data: 13,19,14,17,21,14,15,10,13,15,can we reject the null hypothesis? (Assume equal population variances. )
Unlock Deck
Unlock for access to all 118 flashcards in this deck.
Unlock Deck
k this deck
79
Find a 90 percent confidence interval for the difference between the proportions of group l and group 2.Let p1 represent the population proportion of the people in group 1 who are in favor of new packaging,and let p2 represent the population proportion of the people in group 2 who are in favor of new packaging.
= .21,
= .13,n1 = 300,and n2 = 400.
= .21,
= .13,n1 = 300,and n2 = 400.
Unlock Deck
Unlock for access to all 118 flashcards in this deck.
Unlock Deck
k this deck
80
Determine the 95 percent confidence interval for the difference between two population means,where sample 1 has data: 16,14,19,18,19,20,15,18,17,18;and sample 2 has data: 13,19,14,17,21,14,15,10,13,15.(Assume equal population variances. )
Unlock Deck
Unlock for access to all 118 flashcards in this deck.
Unlock Deck
k this deck
Unlock Deck
Unlock for access to all 118 flashcards in this deck.


