Deck 12: Human Populations
Full screen (f)
Question
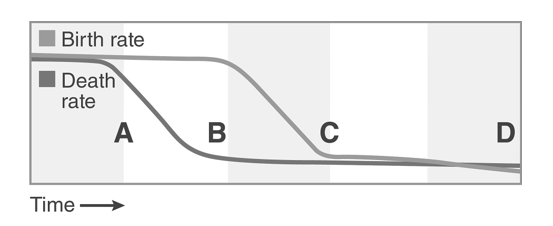
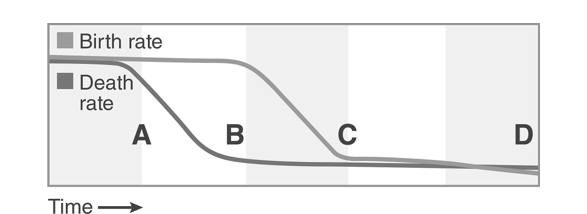
-Assuming no immigration,at which point would this country's population grow most rapidly?
A)A
B)B
C)C
D)D
Question
Question
Question
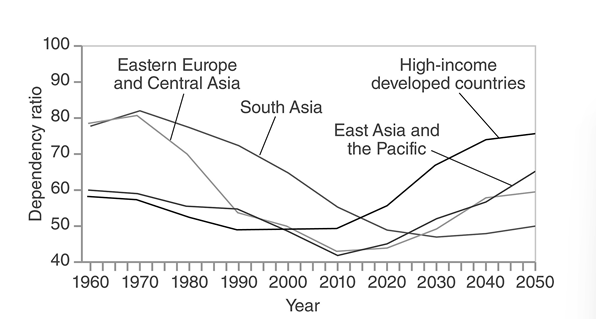
-Which of the following best explains why the dependency ratio in South Asia has been declining?
A)The longer life expectancy has allowed people to work for more years,thus not being dependent on others for social services.
B)The decreasing birth rate has resulted in fewer children dependent on social services.
C)The life expectancy in South Asia has been declining because of natural disasters and diseases,so there are fewer elderly citizens to take care of.
D)The increasing population in the region has resulted in more working-age people who depend on social services.
Question
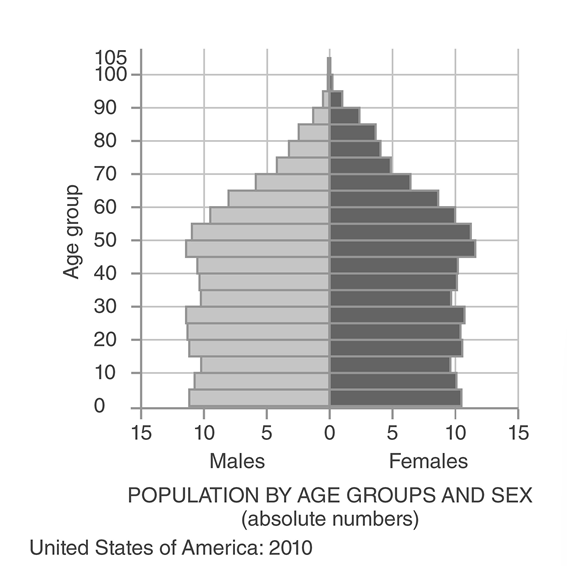
-Which one of the following statements about the figure above is true?
A)The size of each bar generally increases from the top down because of immigration.
B)The greater number of females 85 years or older reflects an unusually high percentage of females born between 1920 and 1925.
C)The declining size of bars from ages 40- 44 to ages 30- 34 most likely represents declining fertility rates.
D)The size of each bar generally increases from the top down because of increased fertility of later generations.
Question
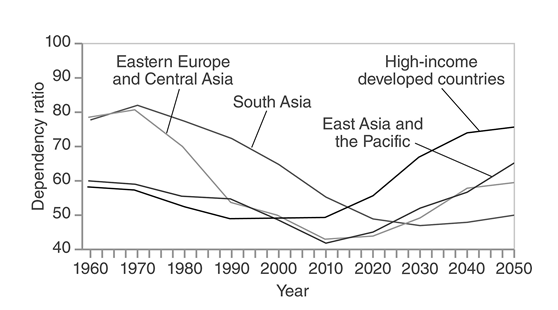
-Examine the dependency ratio trends for the regions in this figure.Which of the following best explains the recent increase in the dependency ratio in developed countries?
A)As per capita income rises,people marry at a younger age.
B)More people have to work to keep per capita incomes high.
C)Life spans are longer resulting in an increase in elderly citizens.
D)As per capita income rises,family size increases.
Question
Question
Question
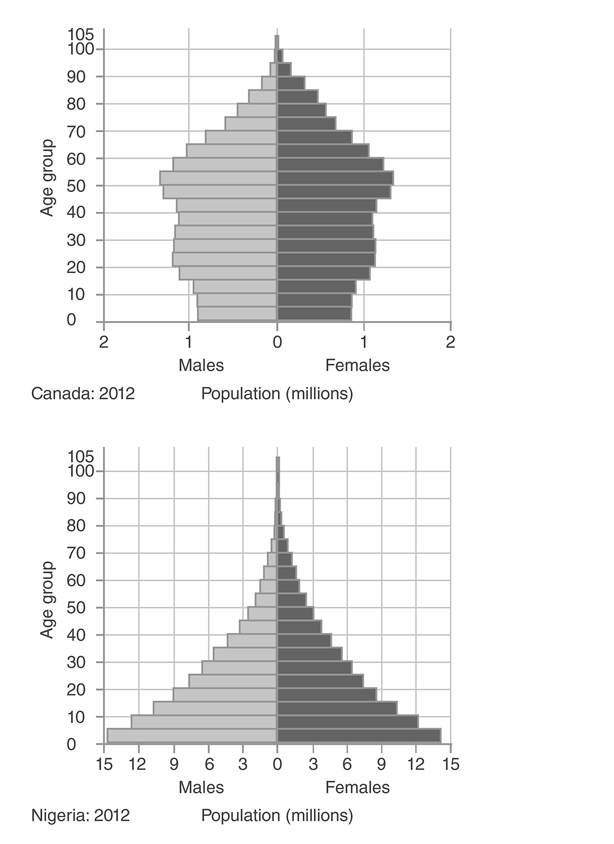
-What is the population in Canada likely to experience soon?
A)Government institution of a population control policy
B)More senior citizens
C)More single males
D)Exponential population growth
Question
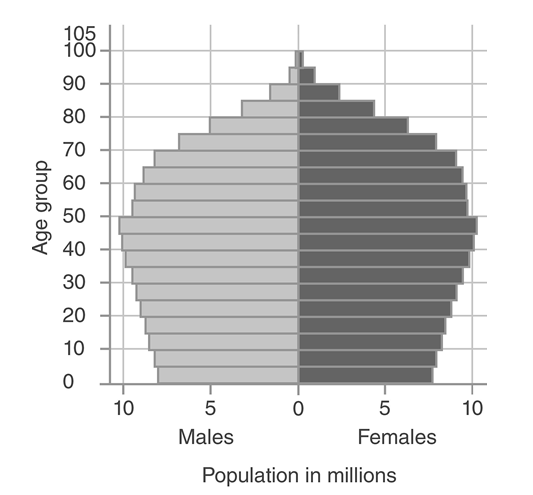
-The age structure of the country in this figure reflects _______.
A)an increasing fertility rate
B)an increasing rate of childhood mortality
C)a fertility rate that has declined
D)the impact of increased immigration into the country
Question
Question
-How many people are between the ages of 45 and 49 in the country shown in this age structure diagram?
A)10 million
B)10 billion
C)20 million
D)This cannot be determined.
Question
Question
Question
Question
Question
-Which of the following will slow the rate of global population increase?
A)Allowing universal immigration rights
B)Delaying the age of first reproduction
C)Increasing life expectancy
D)Increasing life expectancy and reducing infant mortality
Question
Question
Question
Question
Question
Question
Question
Question
Question
Question
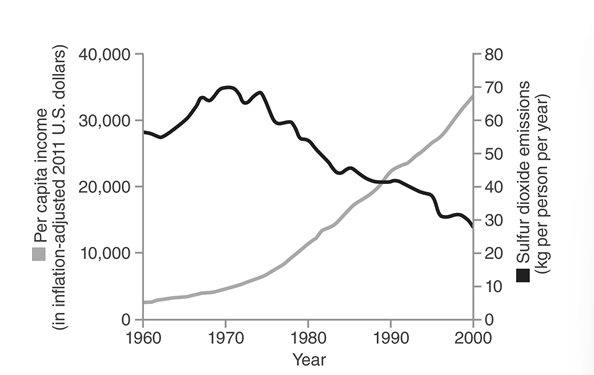
-Which of the following best explains the trends in sulfur emissions in England since 1970?
A)The population of England increased rapidly during the latter half of the 20th century,so per capita emissions decreased even though total emissions increased.
B)Regulations and new technology were employed to reduce sulfur emissions.
C)Sulfur emissions is inversely proportional to per capita income because wealthier people do not need to use sulfur products.
D)England began running out of sulfur resources.
Question
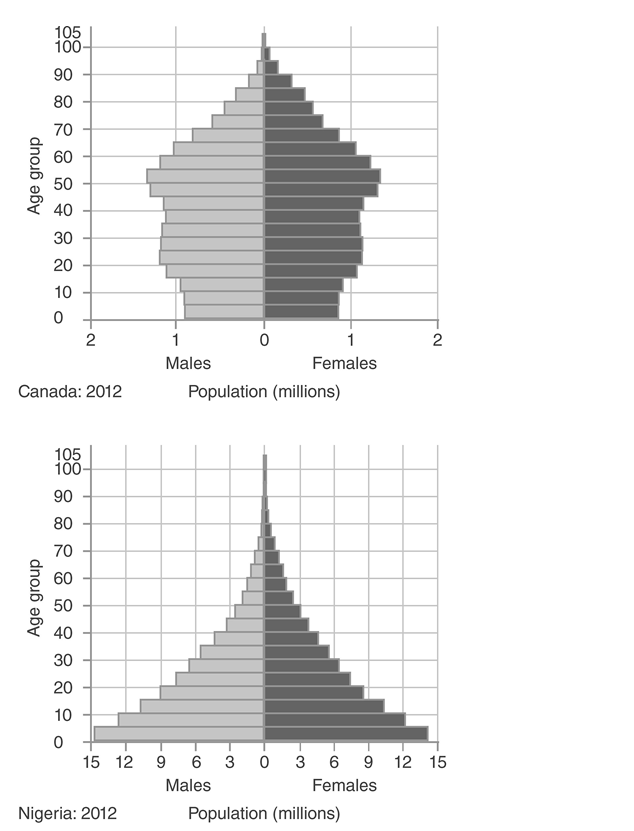
-The age structure diagram of Canada suggests that its total fertility rate is_______ .
A)less than its replacement rate
B)steadily rising
C)zero
D)now rising but has been recently declining
Question
Question
Question
Question
Question
Question
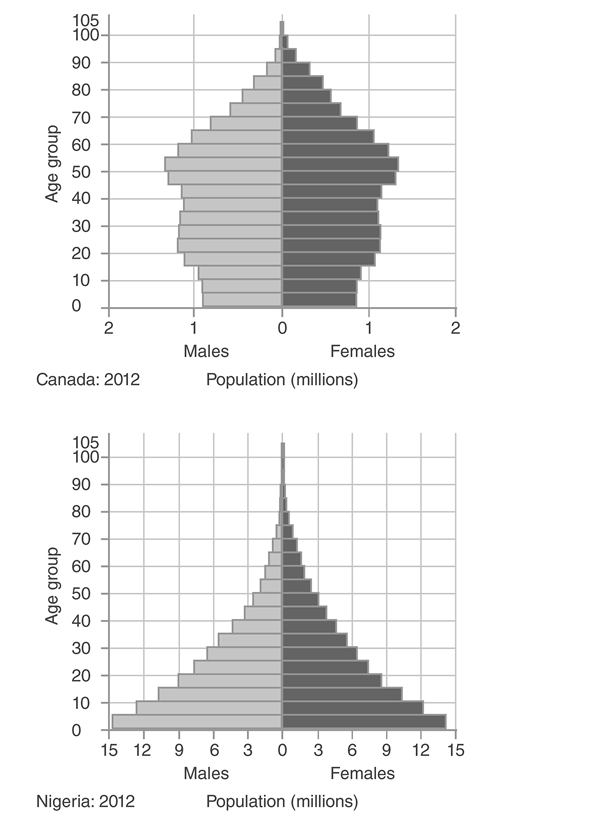
-Which of the following can you determine from the figure above?
A)The population in Canada is growing more rapidly than that in Nigeria.
B)The population in Nigeria has many more males than females.
C)The population in Nigeria is aging rapidly.
D)The population in Nigeria is growing more rapidly than that in Canada.
Question
Question
Question
Question
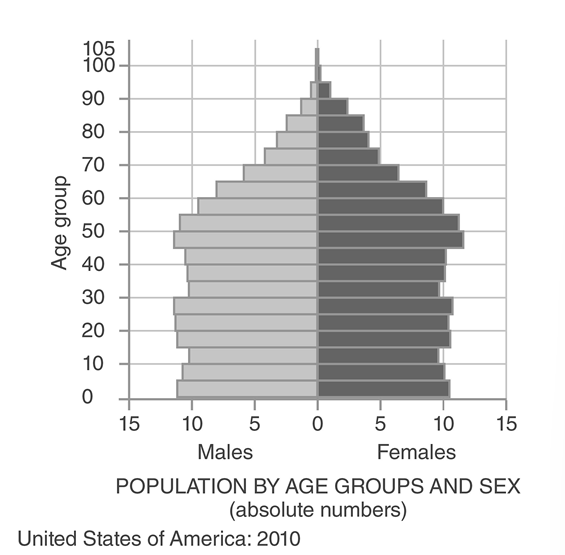
-In this figure,the width of each bar is a measure of the ___________.
A)size of the family of women of reproductive age
B)age of first reproduction of the age group
C)total fertility of the age group
D)number of individuals in the age group
Question
Question

Unlock Deck
Sign up to unlock the cards in this deck!
Unlock Deck
Unlock Deck
1/40
Play
Full screen (f)
Deck 12: Human Populations
1
-Assuming no immigration,at which point would this country's population grow most rapidly?
A)A
B)B
C)C
D)D
B
2
Assuming no immigration,at which point would this country's population decline?
A)A
B)B
C)C
D)D
A)A
B)B
C)C
D)D
D
3
The United Nations' best estimate is that the global population will ___________.
A)continue to increase indefinitely
B)begin to decline by the middle of the 21st century as humans deplete Earth's resources
C)reach 13 billion by the year 2080
D)level off at approximately 10 billion in the year 2100
A)continue to increase indefinitely
B)begin to decline by the middle of the 21st century as humans deplete Earth's resources
C)reach 13 billion by the year 2080
D)level off at approximately 10 billion in the year 2100
level off at approximately 10 billion in the year 2100
4
-Which of the following best explains why the dependency ratio in South Asia has been declining?
A)The longer life expectancy has allowed people to work for more years,thus not being dependent on others for social services.
B)The decreasing birth rate has resulted in fewer children dependent on social services.
C)The life expectancy in South Asia has been declining because of natural disasters and diseases,so there are fewer elderly citizens to take care of.
D)The increasing population in the region has resulted in more working-age people who depend on social services.
Unlock Deck
Unlock for access to all 40 flashcards in this deck.
Unlock Deck
k this deck
5
-Which one of the following statements about the figure above is true?
A)The size of each bar generally increases from the top down because of immigration.
B)The greater number of females 85 years or older reflects an unusually high percentage of females born between 1920 and 1925.
C)The declining size of bars from ages 40- 44 to ages 30- 34 most likely represents declining fertility rates.
D)The size of each bar generally increases from the top down because of increased fertility of later generations.
Unlock Deck
Unlock for access to all 40 flashcards in this deck.
Unlock Deck
k this deck
6
-Examine the dependency ratio trends for the regions in this figure.Which of the following best explains the recent increase in the dependency ratio in developed countries?
A)As per capita income rises,people marry at a younger age.
B)More people have to work to keep per capita incomes high.
C)Life spans are longer resulting in an increase in elderly citizens.
D)As per capita income rises,family size increases.
Unlock Deck
Unlock for access to all 40 flashcards in this deck.
Unlock Deck
k this deck
7
If the global population increases to 9 billion by the middle of the 21st century,which of the following would be necessary?
A)A global one-child policy
B)Universal health care coverage
C)A tripling of the amount of water used for irrigating cropland
D)A growth of 50- 70% in global food production over current levels
A)A global one-child policy
B)Universal health care coverage
C)A tripling of the amount of water used for irrigating cropland
D)A growth of 50- 70% in global food production over current levels
Unlock Deck
Unlock for access to all 40 flashcards in this deck.
Unlock Deck
k this deck
8
Which of the following continents is currently experiencing the most rapid population growth?
A)South America
B)Africa
C)Asia
D)Antarctica
A)South America
B)Africa
C)Asia
D)Antarctica
Unlock Deck
Unlock for access to all 40 flashcards in this deck.
Unlock Deck
k this deck
9
-What is the population in Canada likely to experience soon?
A)Government institution of a population control policy
B)More senior citizens
C)More single males
D)Exponential population growth
Unlock Deck
Unlock for access to all 40 flashcards in this deck.
Unlock Deck
k this deck
10
-The age structure of the country in this figure reflects _______.
A)an increasing fertility rate
B)an increasing rate of childhood mortality
C)a fertility rate that has declined
D)the impact of increased immigration into the country
Unlock Deck
Unlock for access to all 40 flashcards in this deck.
Unlock Deck
k this deck
11
During which time period did the world's population more than double?
A)1900- 1950
B)1850- 1900
C)1950- 2000
D)1800- 1850
A)1900- 1950
B)1850- 1900
C)1950- 2000
D)1800- 1850
Unlock Deck
Unlock for access to all 40 flashcards in this deck.
Unlock Deck
k this deck
12
-How many people are between the ages of 45 and 49 in the country shown in this age structure diagram?
A)10 million
B)10 billion
C)20 million
D)This cannot be determined.
Unlock Deck
Unlock for access to all 40 flashcards in this deck.
Unlock Deck
k this deck
13
Ignoring immigration,a developed country that has had a total fertility rate below 2 for several decades__________ .
A)will have a population declining in size
B)probably has a declining dependency ratio
C)has a decreasing average age
D)All of these are correct.
A)will have a population declining in size
B)probably has a declining dependency ratio
C)has a decreasing average age
D)All of these are correct.
Unlock Deck
Unlock for access to all 40 flashcards in this deck.
Unlock Deck
k this deck
14
Women in two developed countries have similar total fertility rates of 3.5.However,women in country A typically have their children about 2 years earlier than women in country B.How will the population growth rates of the two countries compare?
A)The population of country A will increase faster than that of country B.
B)The populations of both countries will be stable,with similar totals and little increase or decrease.
C)The population of country B will increase faster than that of country A.
D)The population of country A will increase,but the population of country B will decline.
Unlock Deck
Unlock for access to all 40 flashcards in this deck.
Unlock Deck
k this deck
15
Nearly all global population growth in the 21st century is expected to occur in____________ .
A)developing countries
B)Micronesia,Swaziland,Botswana,and Lesotho
C)the United States and other developed countries
D)China and India
A)developing countries
B)Micronesia,Swaziland,Botswana,and Lesotho
C)the United States and other developed countries
D)China and India
Unlock Deck
Unlock for access to all 40 flashcards in this deck.
Unlock Deck
k this deck
16
Population momentum helps explain which of the following scenarios?
A)Some European counties are offering incentives to couples who have more than one child.
B)Increasing educational opportunities for women decreases the birth rate in India.
C)China's population continues to grow despite their total fertility rate being 1.8.
D)Most of the increase in the population of the United States is a result of immigration.
Unlock Deck
Unlock for access to all 40 flashcards in this deck.
Unlock Deck
k this deck
17
-Which of the following will slow the rate of global population increase?
A)Allowing universal immigration rights
B)Delaying the age of first reproduction
C)Increasing life expectancy
D)Increasing life expectancy and reducing infant mortality
Unlock Deck
Unlock for access to all 40 flashcards in this deck.
Unlock Deck
k this deck
18
A decline in a country's death rate will result in an increase in the country's population growth rate unless_________ .
A)immigration offsets the deaths occurring in the country
B)the country is in Stage 2 of the demographic transition
C)there is also a decline in the country's birth rate
D)there is an increase in the country's birth rate
A)immigration offsets the deaths occurring in the country
B)the country is in Stage 2 of the demographic transition
C)there is also a decline in the country's birth rate
D)there is an increase in the country's birth rate
Unlock Deck
Unlock for access to all 40 flashcards in this deck.
Unlock Deck
k this deck
19
In general,fertility rates __________.
A)are unrelated to per capita income
B)increase as per capita income increases
C)decrease as per capita income increases
D)decrease as per capita income decreases
A)are unrelated to per capita income
B)increase as per capita income increases
C)decrease as per capita income increases
D)decrease as per capita income decreases
Unlock Deck
Unlock for access to all 40 flashcards in this deck.
Unlock Deck
k this deck
20
Which of the following factors would decrease total fertility rates?
A)Social and economic security
B)High infant mortality
C)Rural lifestyle
D)Poverty
A)Social and economic security
B)High infant mortality
C)Rural lifestyle
D)Poverty
Unlock Deck
Unlock for access to all 40 flashcards in this deck.
Unlock Deck
k this deck
21
Someone in sub-Saharan Africa is least likely to die of_______ .
A)malaria
B)cancer
C)HIV/AIDS
D)diarrheal diseases
A)malaria
B)cancer
C)HIV/AIDS
D)diarrheal diseases
Unlock Deck
Unlock for access to all 40 flashcards in this deck.
Unlock Deck
k this deck
22
In the I=PAT model,how does technology relate to environmental impact?
A)Environmental impact decreases with increased technology.
B)Environmental impact increases with increased technology.
C)Environmental impact may increase or decrease with increased technology,depending on how technology is being used.
D)Environmental impact usually decreases a country's ability to develop new technologies.
Unlock Deck
Unlock for access to all 40 flashcards in this deck.
Unlock Deck
k this deck
23
A country that has undergone a full demographic transition has__________ .
A)a higher birth rate and a lower death rate,and is about to undergo modernization
B)a lower birth rate,a lower death rate,and has undergone modernization
C)a higher birth rate and a lower death rate
D)a lower birth rate and a higher death rate
A)a higher birth rate and a lower death rate,and is about to undergo modernization
B)a lower birth rate,a lower death rate,and has undergone modernization
C)a higher birth rate and a lower death rate
D)a lower birth rate and a higher death rate
Unlock Deck
Unlock for access to all 40 flashcards in this deck.
Unlock Deck
k this deck
24
The world population growth rate is currently close to _________%.
A)1)2
B)5
C)2)5
D)10
A)1)2
B)5
C)2)5
D)10
Unlock Deck
Unlock for access to all 40 flashcards in this deck.
Unlock Deck
k this deck
25
Briefly explain how the status of women affects population growth.
Unlock Deck
Unlock for access to all 40 flashcards in this deck.
Unlock Deck
k this deck
26
The current global human population is approximately_______ .
A)10 billion
B)7 billion
C)1)5 billion
D)7 million
A)10 billion
B)7 billion
C)1)5 billion
D)7 million
Unlock Deck
Unlock for access to all 40 flashcards in this deck.
Unlock Deck
k this deck
27
-Which of the following best explains the trends in sulfur emissions in England since 1970?
A)The population of England increased rapidly during the latter half of the 20th century,so per capita emissions decreased even though total emissions increased.
B)Regulations and new technology were employed to reduce sulfur emissions.
C)Sulfur emissions is inversely proportional to per capita income because wealthier people do not need to use sulfur products.
D)England began running out of sulfur resources.
Unlock Deck
Unlock for access to all 40 flashcards in this deck.
Unlock Deck
k this deck
28
-The age structure diagram of Canada suggests that its total fertility rate is_______ .
A)less than its replacement rate
B)steadily rising
C)zero
D)now rising but has been recently declining
Unlock Deck
Unlock for access to all 40 flashcards in this deck.
Unlock Deck
k this deck
29
What is a demographic transition? What are its five stages? Describe each stage,including its consequences for population growth.
Unlock Deck
Unlock for access to all 40 flashcards in this deck.
Unlock Deck
k this deck
30
The area of land and water needed to provide the resources for one person and absorb his/her wastes defines the __________.
A)resource capacity
B)ecological footprint
C)carbon footprint
D)demographic impression
A)resource capacity
B)ecological footprint
C)carbon footprint
D)demographic impression
Unlock Deck
Unlock for access to all 40 flashcards in this deck.
Unlock Deck
k this deck
31
Define ecological footprint and differentiate between the ecological footprint of a developing country and that of the United States.Support or challenge the following statement: "The population problem does not lie entirely with the developing world."
Unlock Deck
Unlock for access to all 40 flashcards in this deck.
Unlock Deck
k this deck
32
What is the most logical reason for China adopting its one-child policy?
A)It was clear that the country could not live within the limit of its resources if the population continued to grow.
B)Contagious disease was rampant in the 1970s and fewer people meant less contagion.
C)The fertility rate was too low and the country needed more people to populate vacant lands.
D)The modernizing country wanted to give its women greater reproductive freedom.
Unlock Deck
Unlock for access to all 40 flashcards in this deck.
Unlock Deck
k this deck
33
Which of the following will reduce the rate of global population growth?
A)Changing the global total fertility rate to 2
B)Making birth control options readily available in developed countries
C)Encouraging women to reproduce earlier
D)Lifting all immigration moratoriums
A)Changing the global total fertility rate to 2
B)Making birth control options readily available in developed countries
C)Encouraging women to reproduce earlier
D)Lifting all immigration moratoriums
Unlock Deck
Unlock for access to all 40 flashcards in this deck.
Unlock Deck
k this deck
34
-Which of the following can you determine from the figure above?
A)The population in Canada is growing more rapidly than that in Nigeria.
B)The population in Nigeria has many more males than females.
C)The population in Nigeria is aging rapidly.
D)The population in Nigeria is growing more rapidly than that in Canada.
Unlock Deck
Unlock for access to all 40 flashcards in this deck.
Unlock Deck
k this deck
35
According to the I=PAT model,which of the following would most likely reduce a country's environmental impact?
A)Greater use of birth control
B)Discovery of large reserves of fossil fuels within the country's borders
C)Construction of industrial plants to draw on cheaper labor
D)Increased use of electricity and natural gas
A)Greater use of birth control
B)Discovery of large reserves of fossil fuels within the country's borders
C)Construction of industrial plants to draw on cheaper labor
D)Increased use of electricity and natural gas
Unlock Deck
Unlock for access to all 40 flashcards in this deck.
Unlock Deck
k this deck
36
A declining dependency ratio_________ .
A)requires increased spending on education but decreased costs associated with old-age medical expenses
B)requires permanently decreased spending on education but temporarily increased costs associated with old-age medical expenses
C)permits temporarily decreased spending on education and old-age medical expenses
D)requires immediate and permanent increased spending on education and old-age medical expenses
Unlock Deck
Unlock for access to all 40 flashcards in this deck.
Unlock Deck
k this deck
37
The Green Revolution of the 20th century was characterized by________ .
A)increased concern for the environment
B)increased use of environmentally sound products
C)advancements in agricultural techniques
D)increased awareness of the environment and environmental issues
A)increased concern for the environment
B)increased use of environmentally sound products
C)advancements in agricultural techniques
D)increased awareness of the environment and environmental issues
Unlock Deck
Unlock for access to all 40 flashcards in this deck.
Unlock Deck
k this deck
38
-In this figure,the width of each bar is a measure of the ___________.
A)size of the family of women of reproductive age
B)age of first reproduction of the age group
C)total fertility of the age group
D)number of individuals in the age group
Unlock Deck
Unlock for access to all 40 flashcards in this deck.
Unlock Deck
k this deck
39
To enforce China's one-child policy,the government_______ .
A)instituted a system of economic and social incentives and penalties
B)promoted voluntary compliance as a patriotic act
C)pursued strict compliance in rural agricultural areas but not in urban areas
D)deported anyone who did not comply
A)instituted a system of economic and social incentives and penalties
B)promoted voluntary compliance as a patriotic act
C)pursued strict compliance in rural agricultural areas but not in urban areas
D)deported anyone who did not comply
Unlock Deck
Unlock for access to all 40 flashcards in this deck.
Unlock Deck
k this deck
40
Unlike developed countries,children in developing countries often die from________ .
A)common ailments such as diarrhea
B)accidents involving farm equipment and other agricultural activities
C)snakebites or attacks from large predators such as crocodiles and tigers
D)hunting accidents
A)common ailments such as diarrhea
B)accidents involving farm equipment and other agricultural activities
C)snakebites or attacks from large predators such as crocodiles and tigers
D)hunting accidents
Unlock Deck
Unlock for access to all 40 flashcards in this deck.
Unlock Deck
k this deck
Unlock Deck
Unlock for access to all 40 flashcards in this deck.


